Find, Analyze, and Target Any Property Manager in the US
Apr 24, 2026 · 8 min read
Mapping the 36,819 property managers behind every active US rental listing. Introducing Property Management Coverage in AI Connect.

Parcl Labs provides integrated, real-time intelligence on US housing: every for-sale listing, rental listing, sales transaction, and true ownership on ~1.5M portfolios. That unified view of the property lifecycle has made single-family rental (SFR) the largest use case on our platform. Investors, operators, analysts, banks, researchers, government, and media use Parcl Labs as a single source of truth for understanding what's happening across the sector.
Now we're adding another layer: Property Management. Why now? As the SFR asset class matures and more players enter the space, different business models have emerged:
Fully vertical operators like AMH build, own, and manage homes end-to-end.
Hybrid operators like Invitation Homes own and operate most of their portfolio outright, while also running a third-party management business for partners and other institutions.
Portfolio owners who outsource management hold homes and hire third parties to operate them. This group spans everyone from local mom & pops to sophisticated hedge funds.
Pure third-party managers supervise day-to-day operations for portfolios they don't own.
One lens alone - home ownership, or listing management - shows only part of the picture. Tracking the SFR sector today requires both.
Own vs. manage dynamics matter more now, given the regulatory cloud hanging over institutional SFR. We've been at the forefront of analyzing the proposal to ban owners of 350+ single-family homes from new purchases - see our research here. One implication of the policy uncertainty: institutions that want to grow may lean on third-party management rather than acquisition. Now you can track those moves with .
Introducing Property Management Intelligence
Parcl Labs resolves the property management layer behind every active rental listing in the US, refreshed daily through AI Connect.
As of April 22, 2026, coverage spans 36,819 property management entities managing single-family, townhome, and condo rentals nationally. By current active on-market listings per entity:
Active Listings Per Entity | # of Entities |
|---|---|
1,000+ | 16 |
100–999 | 105 |
10–99 | 2,126 |
<10 | 34,572 |
By geographic reach:
Reach | # of Entities |
|---|---|
National (10+ states) | 89 |
Regional (2–9 states) | 1,961 |
Single-state | 34,769 |
The PM data lives at the most granular level: the rental listing. On each one, we resolve the management entity and capture pricing history, property attributes, true owner, and contact details. Aggregated across an entity's full footprint, that produces deep intelligence on their operations:
Operator classification - third-party property manager, brokerage, institutional operator, rental software / listing platform, or self-list.
Door size and footprint - active listings and distribution across markets.
Portfolio profile - property types, age and vintage mix, rent tier, and "buy box" patterns.
Performance - price changes, days on market, algorithmic price detection.
Owner linkage - which investor portfolios own the managed doors.
Contact details.
That PM coverage supports end-to-end workflows:
Service providers selling to PMs build prospect lists, calibrated by door scale, geography, or portfolio profile, and show up to sales conversations with the customer's portfolio intel already in hand.
PMs benchmark competitors on strategy, performance, and owner-side relationships: which investors they work with, and where accounts are fragmented vs. concentrated.
Owners evaluate PMs beyond marketing claims and pick the partner that best fits their needs.
Analysts, researchers, and media track rental-market trends.
Let's put this into action in Atlanta - the country's most dynamic SFR market.
Map SFR Landlord Market Share: Atlanta
Atlanta is the country's most concentrated institutional SFR ownership market. What about market share on the property management side?
As of April 22, 2026, 1,220 distinct property management operators are active in Atlanta, and no single operator controls more than 3.2% of the metro's ~15,000 active rental listings. Parcl Labs resolves the managing entity behind ~80% of on-market Atlanta rentals.
Three operator types primarily run the rental market:
Operator type | % of listings |
|---|---|
3rd-Party PM | 27.1% |
Institutional Landlord | 20.7% |
Brokerage | 18.5% |
Institutional landlords (yellow) cluster in a U-shape around Atlanta's urban core, across the southern, eastern, and western suburbs.
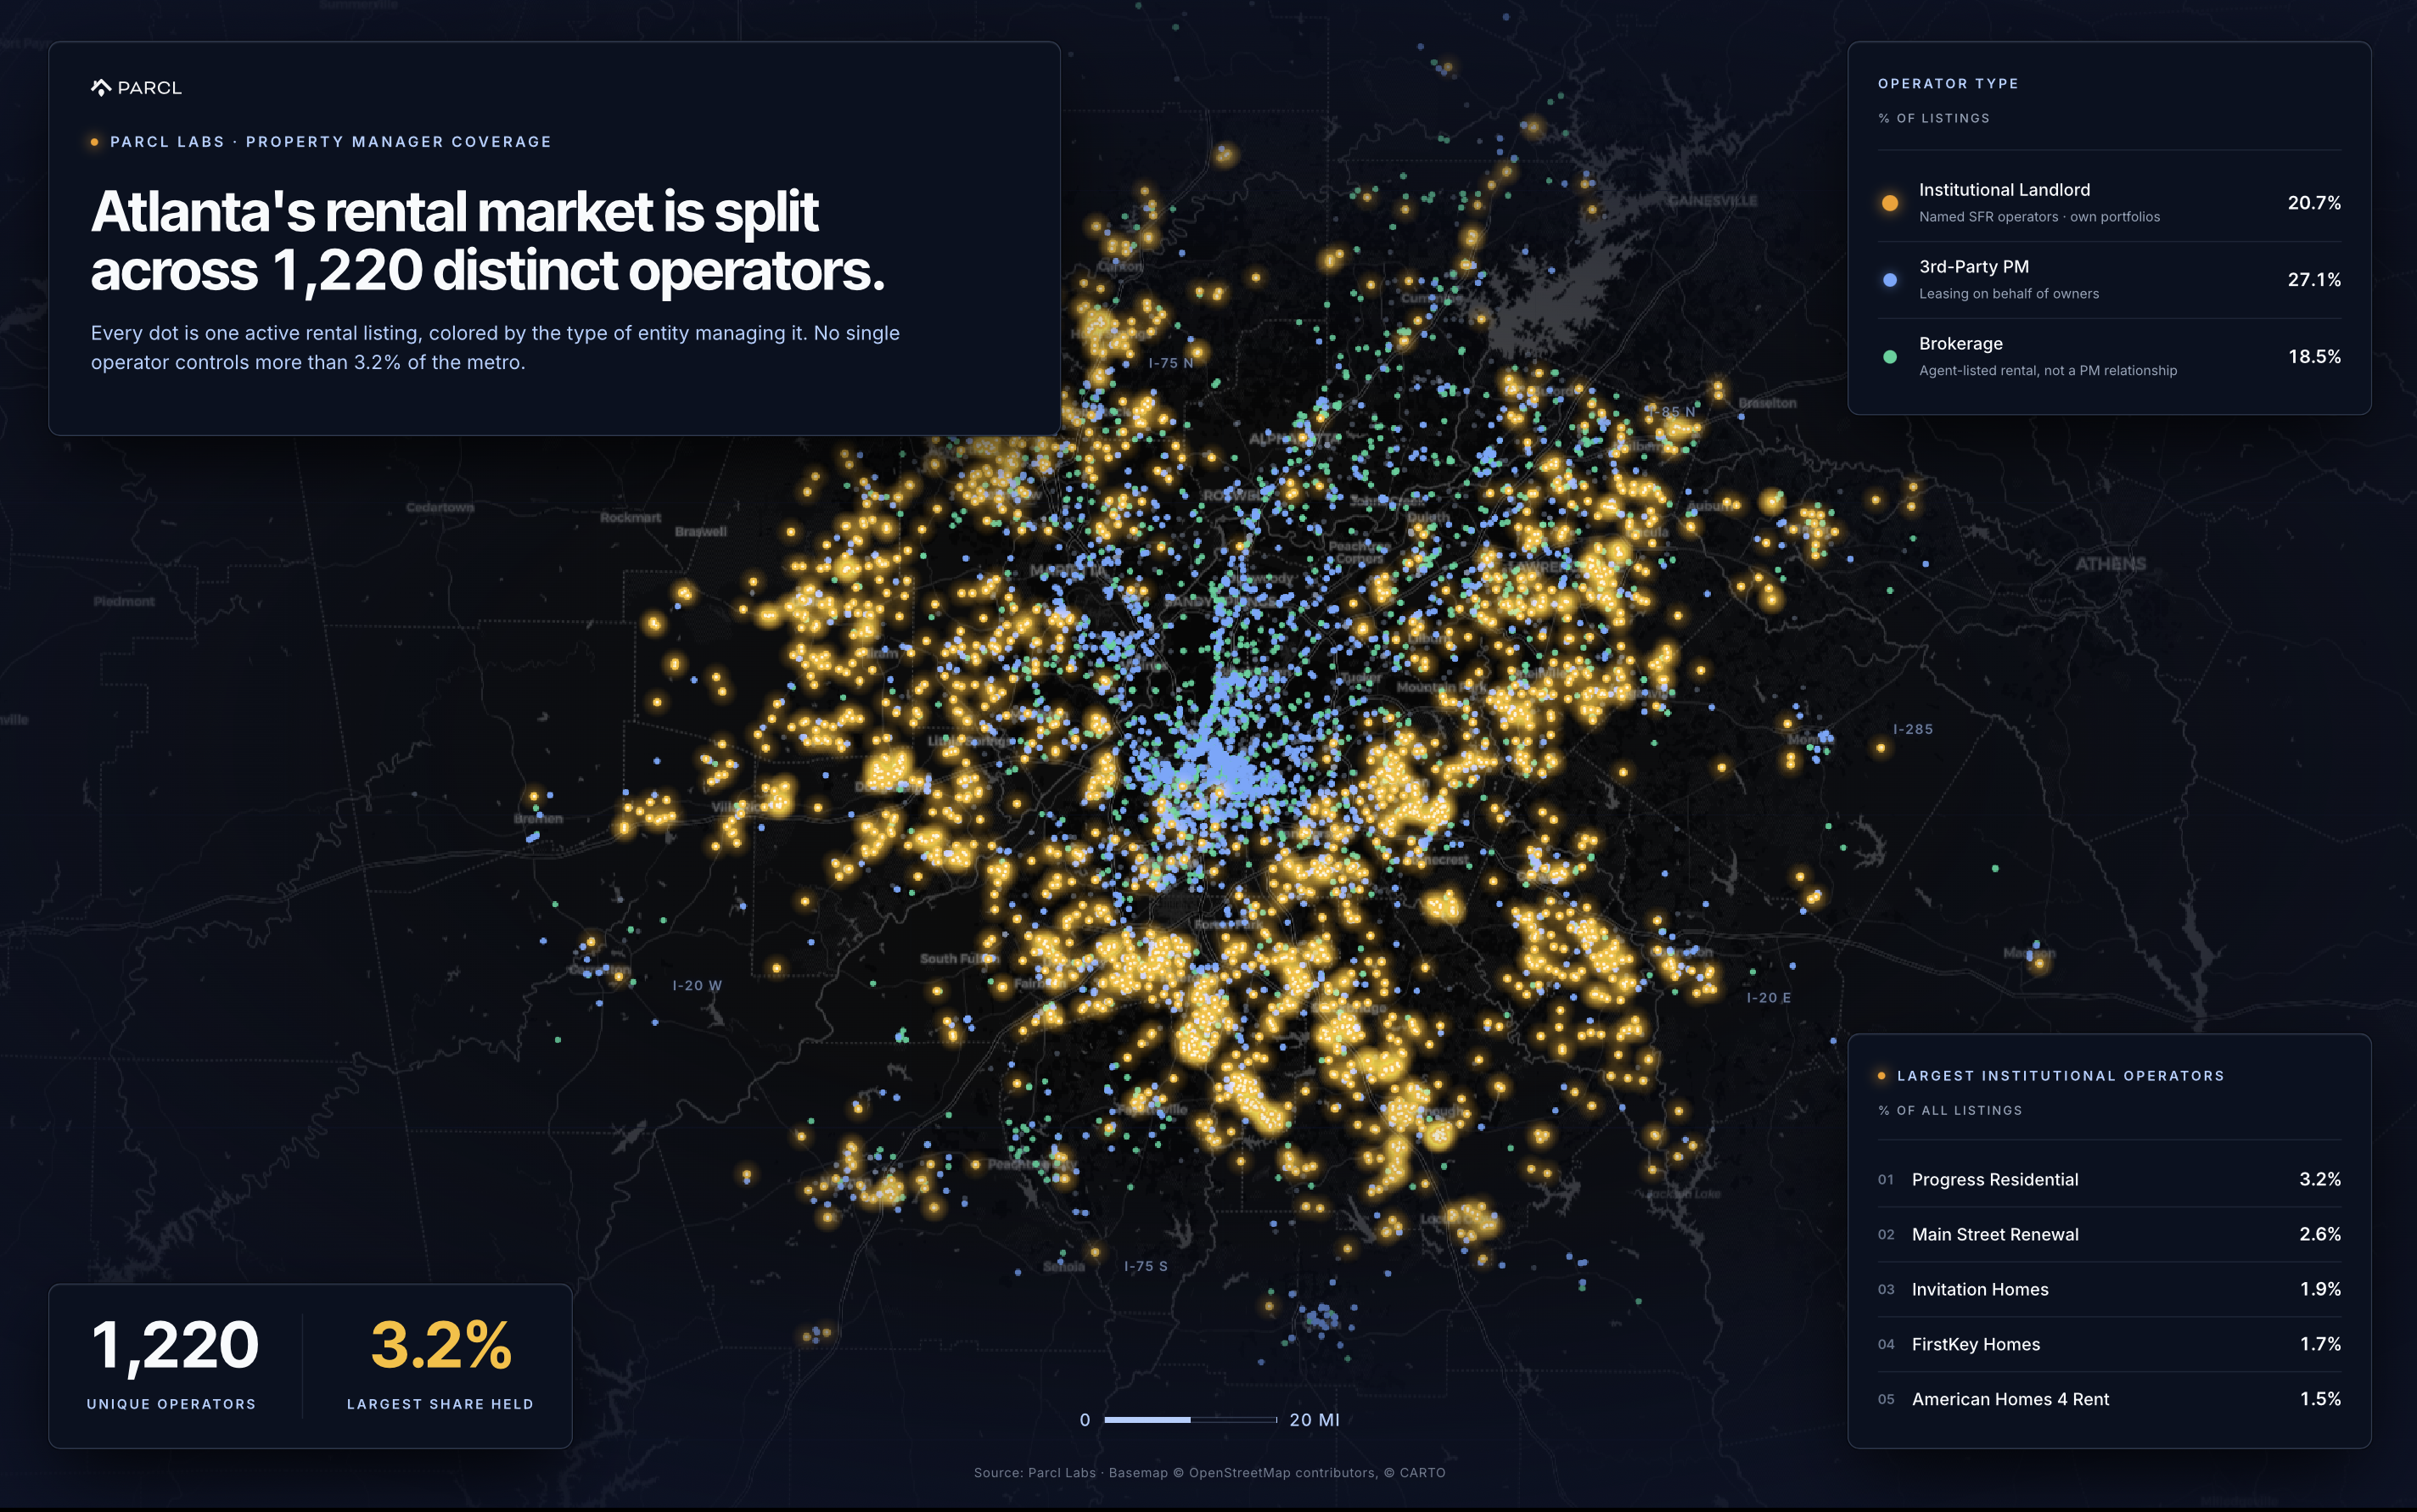
Even in the country's most institutionally concentrated SFR market, no single operator crosses 5% market share. The top five:
Institutional operator | % of active rental listings (Atlanta) |
|---|---|
Progress Residential | 3.2% |
Main Street Renewal (Amherst) | 2.6% |
Invitation Homes | 1.9% |
FirstKey Homes | 1.7% |
American Homes 4 Rent | 1.5% |
Outside the biggest institutional landlords, Atlanta's property management market is broad and diverse. Other top Atlanta landlords by single-family rental share:
Property management | % of single-family rentals (Atlanta) |
|---|---|
Brandywine Homes | 1.3% |
Evernest | 0.7% |
Mynd Management | 0.7% |
Red Rhino | 0.7% |
HomeRiver Group | 0.5% |
Darwin Homes | 0.5% |
Open House Atlanta | 0.4% |
Up & Up Rentals | 0.3% |
Atlanta Leasing & Investment | 0.3% |
Renters Warehouse | 0.3% |
These PMs operate a mix of business models. Evernest, HomeRiver Group, Red Rhino, Atlanta Leasing & Investment, and Renters Warehouse are primarily third-party operators. Brandywine Homes and Darwin Homes run hybrid models, managing captive funds (Lafayette and Pagaya respectively) alongside external owners. Up & Up Rentals and Open House Atlanta are closer to vertically integrated owner-operators. Parcl's PM-owner-linkage surfaces these operational nuances.
This market share analysis ran in five minutes through AI Connect. You can recreate it for any market with a single prompt through our .
Turn Property Management Data into Precision Lead Generation
Top-down by market share is one way to use Parcl's PM data. You can also analyze it bottom-up: aggregate managers by portfolio attributes to build a targeted PM prospect list.
Selling to PMs has become an emerging use case, especially given policy pressure on institutional owners. Third-party managers face no equivalent constraint on their operations, and many vendors are reorienting their sales motion toward them - where the regulatory risk is lower.
Here are two ways to build custom PM lead lists with Parcl data:
Find Geographically Dispersed Property Managers
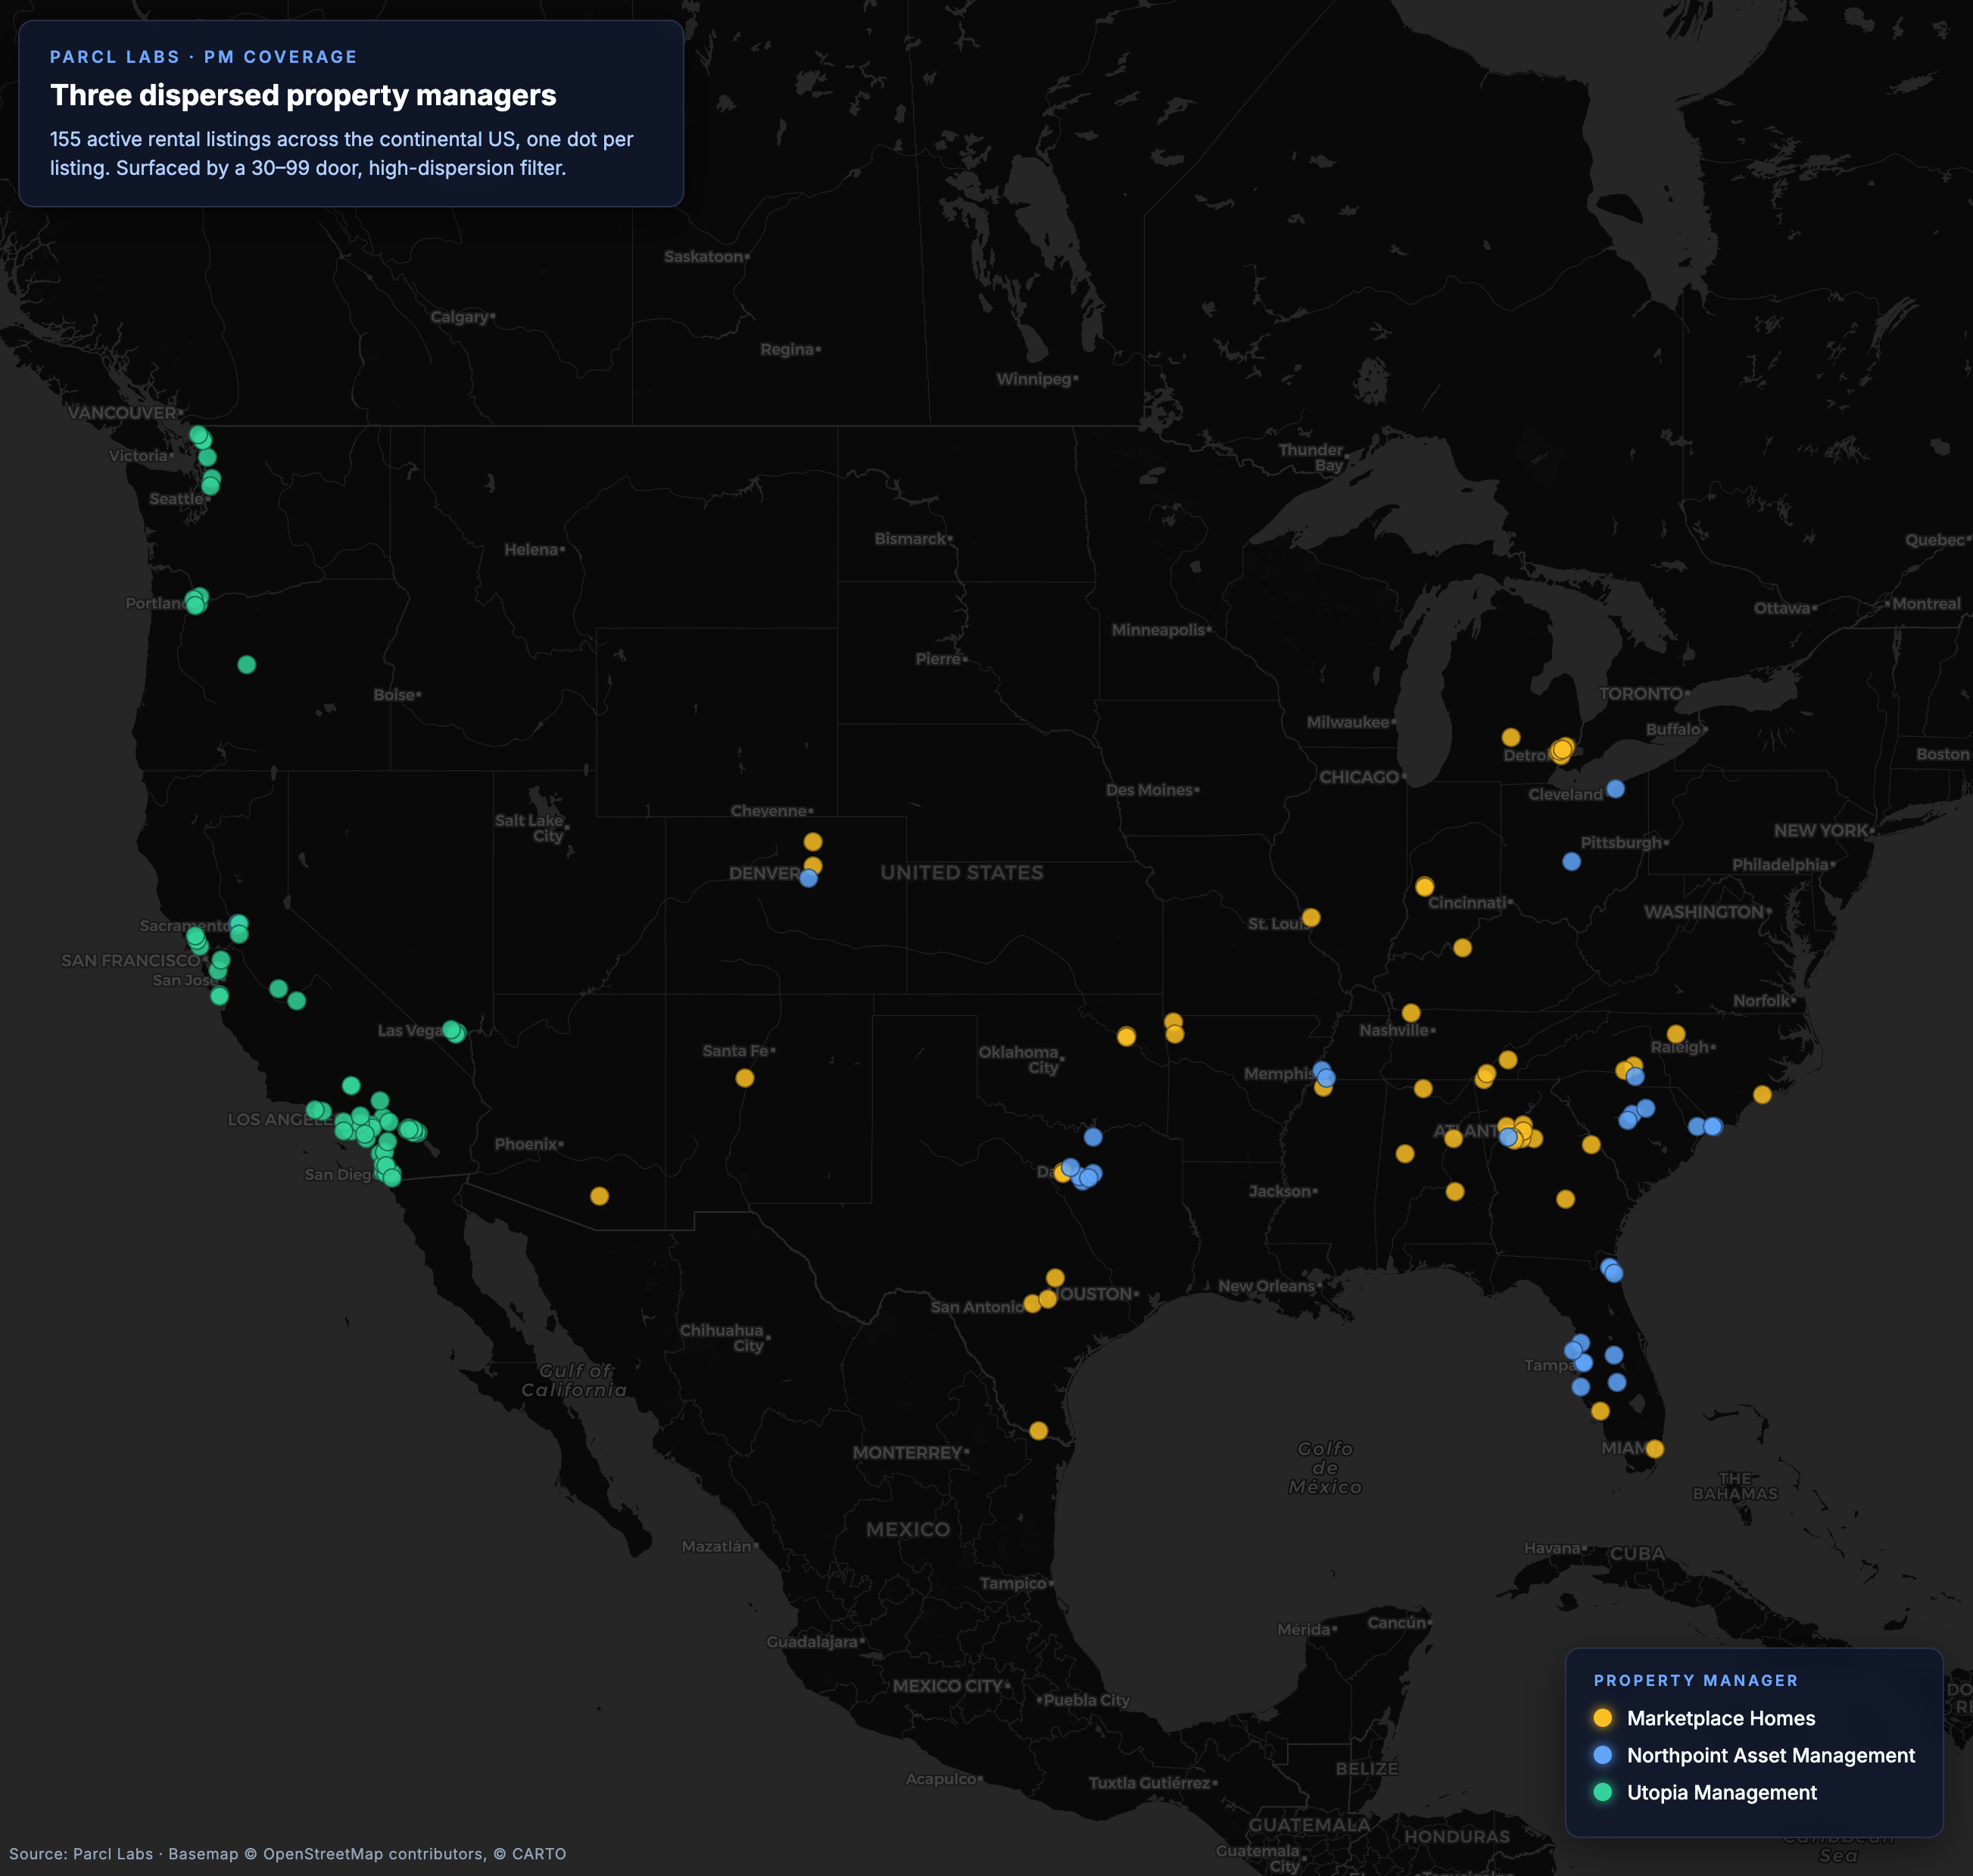
One way to cut PM data is by geographic dispersion: how many markets does a PM operate across? That lens is a priority for multiple vendor types:
Home service providers (maintenance, field services, inspections) target dispersed PMs because those PMs don't have boots on the ground in every market and outsource the gap.
Multi-market simplifiers (insurance, compliance, accounting, rental verification, tax) help PMs cut the overhead of operating across jurisdictions with different rules.
You can find these dispersed managers directly in Parcl. For example, we filtered to mid-size firms with 30 to 99 active, on-market rental listings (a small subset of total doors under management) and ranked them on three dimensions: how many states they operate in, how many MSAs they touch, and how thinly they spread across those MSAs. The approach surfaced 214 PMs, with firms like Marketplace Homes (16 states, 30 MSAs), Northpoint Asset Management (9 states, 17 MSAs), and Utopia Management (4 states, 17 MSAs) rising to the top of the list.
Find Local Property Managers With Older Homes
Another way to cut PM data: how deeply is a PM specialized in a single market and property type? These operators are high-priority targets for several vendor types:
Renovation specialists (roofing, HVAC, plumbing, electrical) target PMs managing older stock, where systems replacement and deferred maintenance drive outsized spend.
National platforms (pricing data, operational playbooks, underwriting models) target local specialists who need a broader benchmark but can't build one in-house.
Acquirers (consolidators, roll-up platforms) target local PMs for acquisition: ready-made local expertise, tenant relationships, and portfolio scale in a target metro.
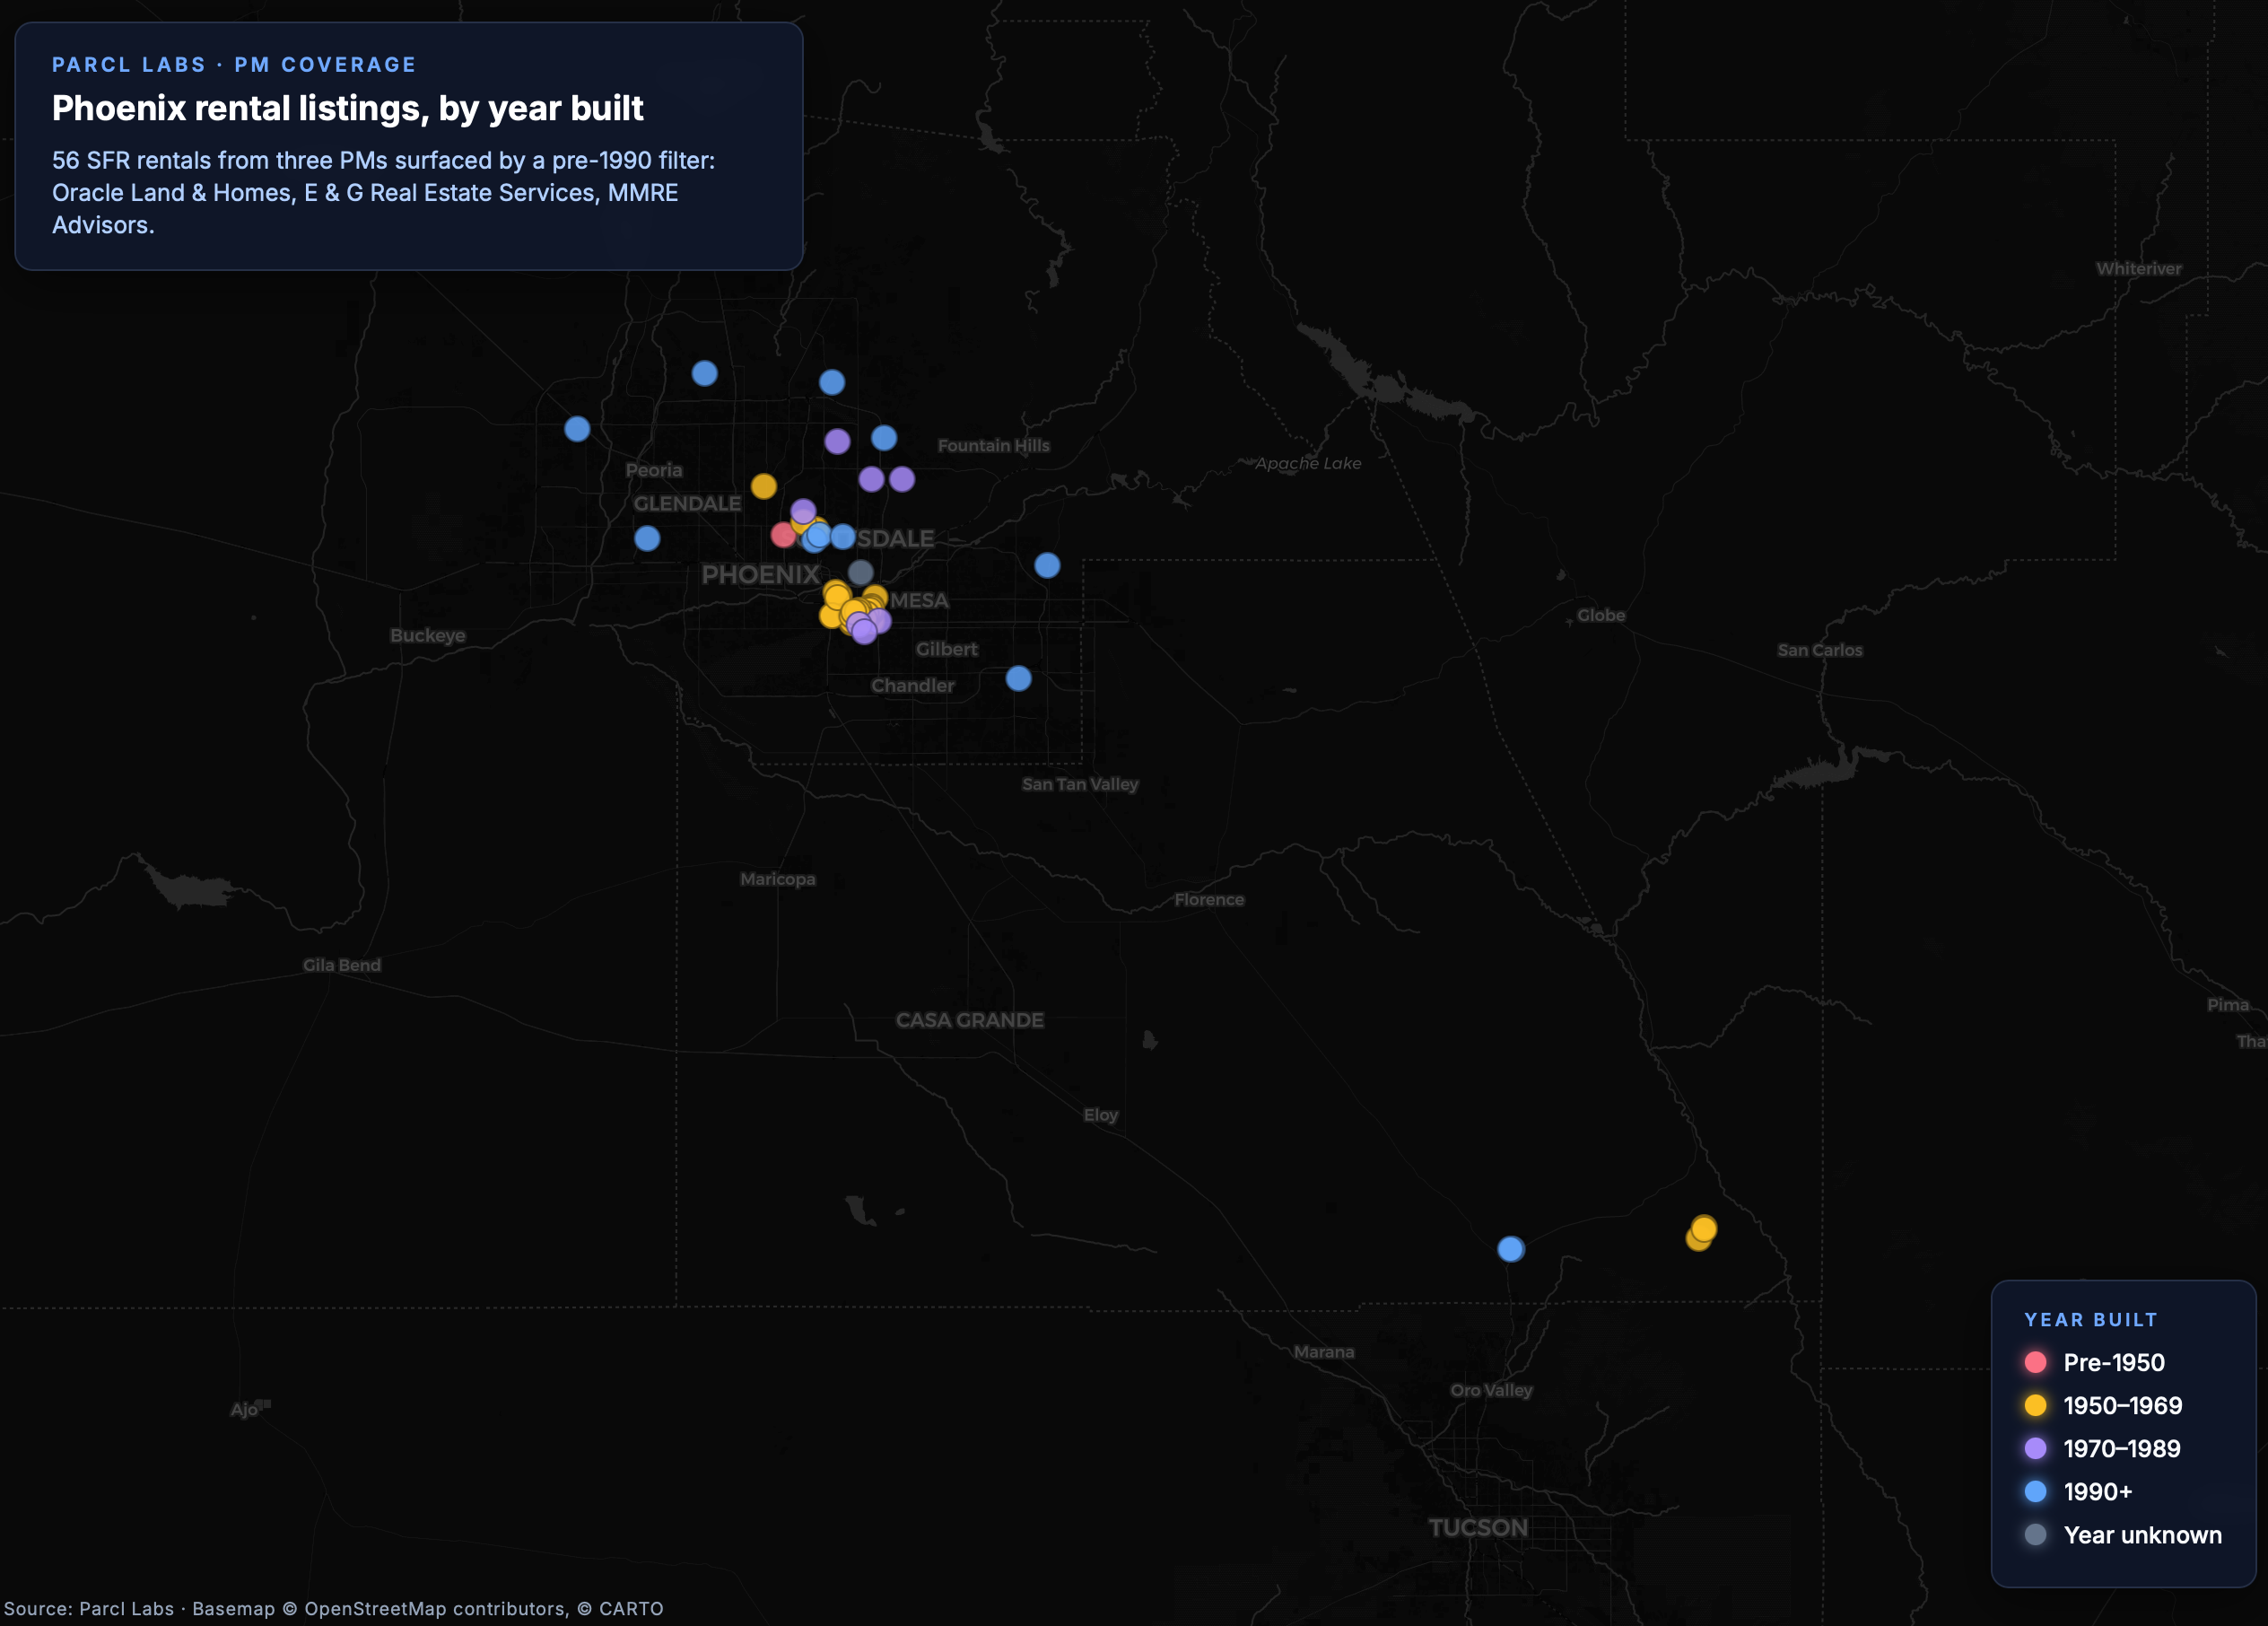
You can find these managers directly in Parcl, too. For example, we filtered to third-party managers in the Phoenix MSA overseeing single-family rentals built before 1990, and ranked them on portfolio specialization (share of pre-1990 stock × listing volume). The approach surfaced 45 managers, with firms like Oracle Land & Homes (60% pre-1990, $1,295 median rent), E & G Real Estate Services (89%, $3,200), and MMRE Advisors (50%, $7,370) rising to the top. These three span the full rent spectrum, from affordable rural to Scottsdale luxury.
Get Started with Property Management Coverage
If you're looking to sell to or analyze a property manager, you know your target best. Our goal is to deliver data granular enough to find them - and that data now spans both sides of the market. Investor ownership identifies who holds the asset. Management identifies who operates it. Institutional SFR analysis requires both, and Parcl Labs provides both in a single integrated dataset.
PM coverage is live in Parcl Labs AI Connect (MCP) under the motivated rental property tool.
Get started:
Connect to AI Connect (MCP): app.parcllabs.com/data-vault/ai-connect
Access our open-source Claude skills for PM analysis: github.com/ParclLabs/parcl-ai-connect
Questions, feedback, or want to walk through a specific use case? Email team@parcllabs.com.

Follow Us for More