4Q25 SFR Recap: Sales Pick Back Up in 4Q, Expect Sluggishness to Continue Amid Regulatory Uncertainty
Jan 22, 2026 · 6 min read
4Q25 SFR Operator Recap
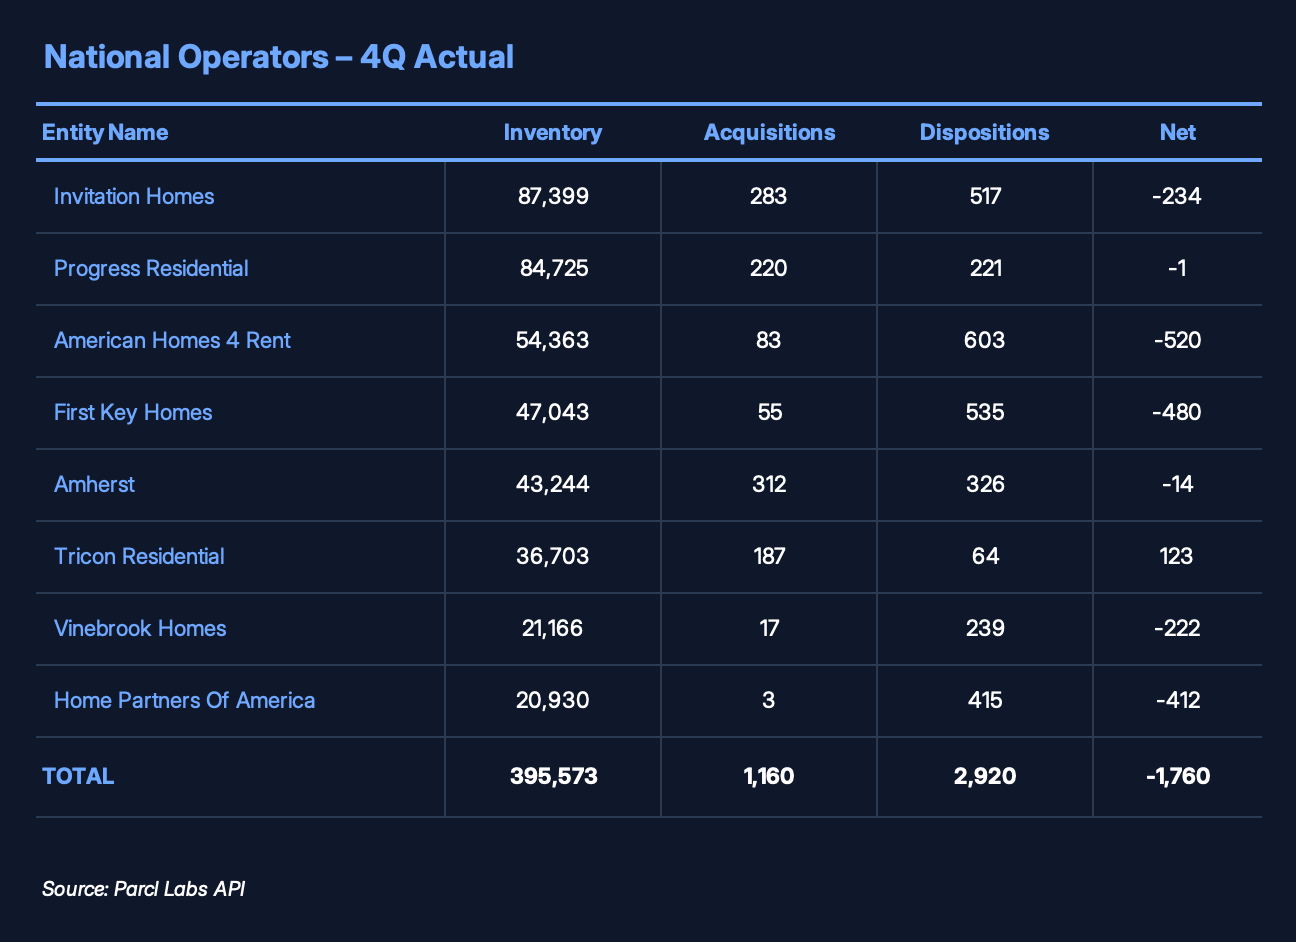
In this report we analyze trends from 8 major SFR (single family rental) operators nationally. The analysis provides an early look at 4Q25 activity (see Methodology). We will update this report quarterly and intra-quarter trends can be tracked via our API.
SFR ended the year with a whimper as selling re-accelerated in 4Q. The market remains sluggish, with operators largely on the sidelines - not acquiring and instead pruning around the edges of their portfolios amid continued uncertainty. We do not expect this behavior to change in the near term, particularly following recent comments from the White House suggesting potential executive action aimed at limiting institutional ownership in an effort to improve housing affordability. While large institutional operators own only about 1% of the U.S. housing stock, these proposals are likely more headline-driven than substantive. Still, the lack of clarity within the operating and regulatory environment is likely to keep capital from flowing into the sector and could induce further, more aggressive, net selling should any legislation ultimately be enacted.
The top 8 SFR operators were net sellers in every quarter of 2025. In 4Q25, net dispositions increased relative to each quarter of 2025, totaling 1,760 units versus 797 in 3Q25, 1,330 in 2Q25, and 1,708 in 1Q25.
Atlanta continued to see broad based selling across nearly all operators, with the exception of Tricon. The market accounted for nearly one third of total dispositions in 4Q, with 527 net units sold. Florida was also sold aggressively, with Miami and Ft. Lauderdale standing out as the most active disposition markets.
Texas weakened versus 3Q, with 313 net units sold in 4Q compared to roughly flat activity in the prior quarter. On the buy side, North Carolina continued to see net acquisitions, though purchasing was less broad based quarter over quarter. Several secondary markets, including Kansas City, Memphis, Birmingham, and Louisville, were net acquisition markets, with Amherst remaining particularly active in these cities.
Operator-Specific Insights
In the charts below we outline net acquisitions and dispositions within each operator's most active markets (>15 transactions). Counts reflect transaction data as of January 20, 2025 (see Methodology for more information).
AMH (American Homes 4 Rent)
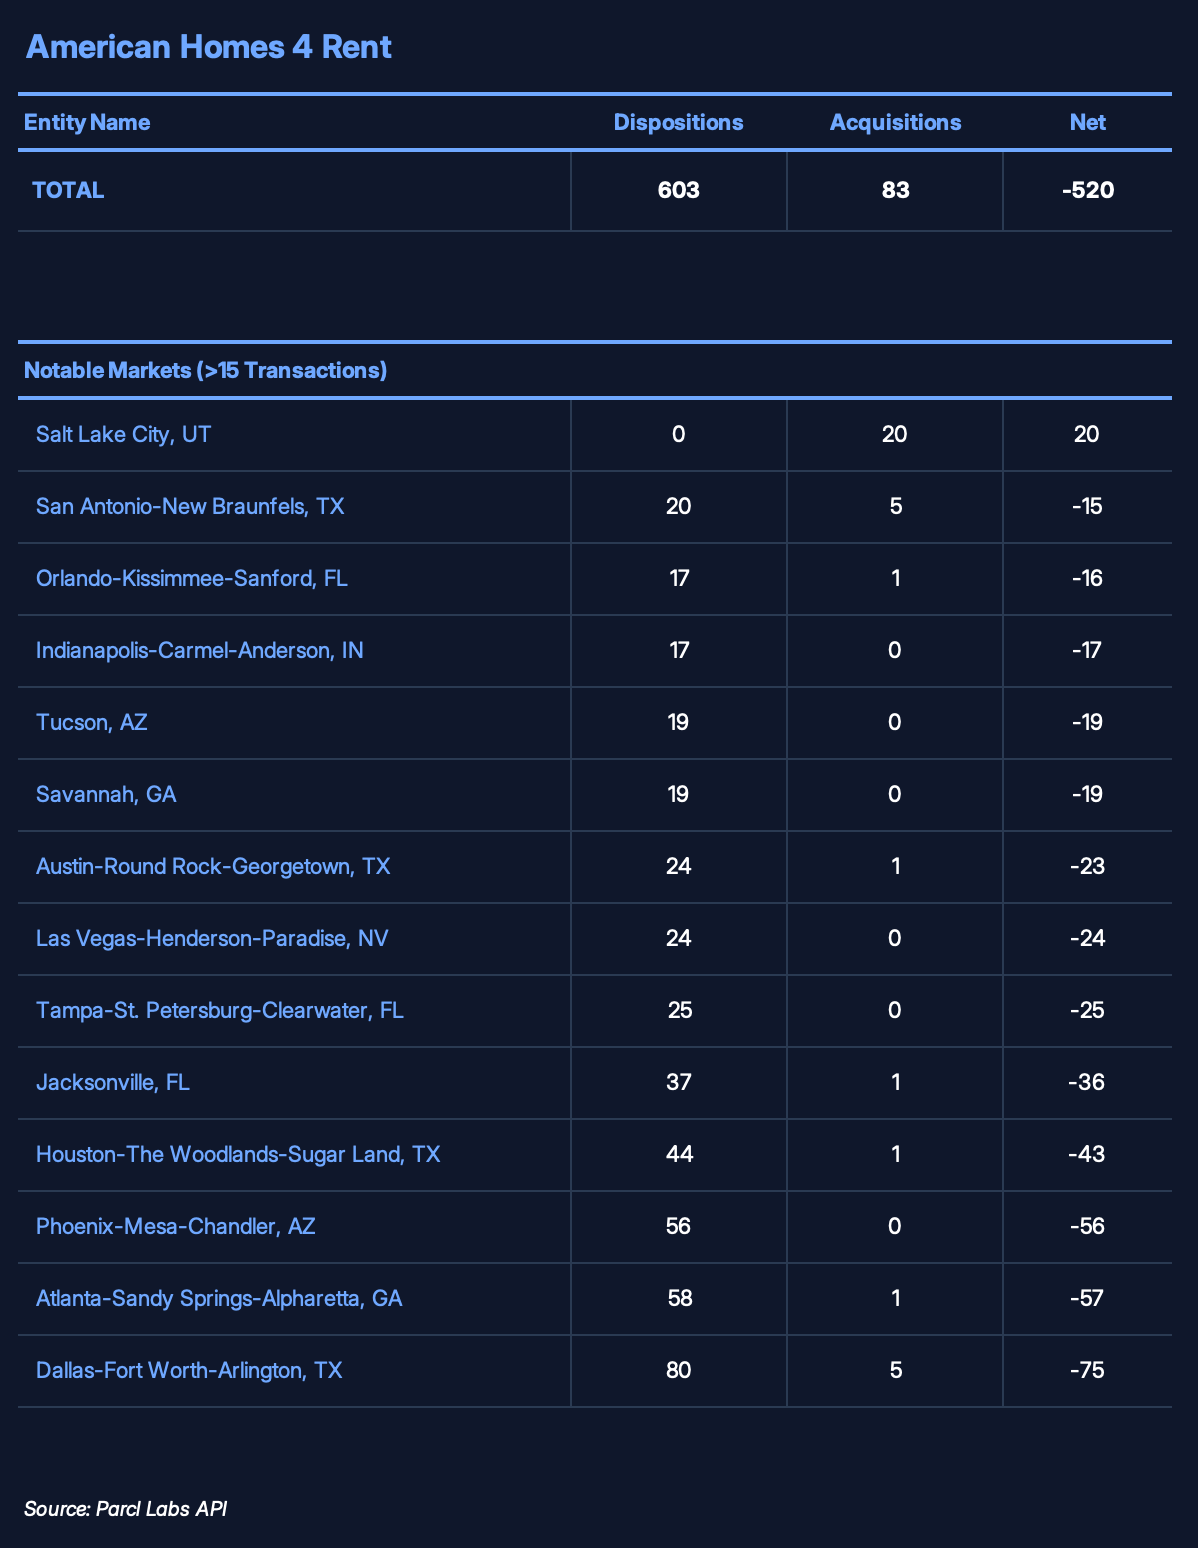
AMH was the most aggressive net seller in 4Q, shedding 520 net units. Dallas led dispositions (-75), followed by Atlanta (-57), Phoenix (-56), and Houston (-43). Salt Lake City was the lone acquisition market (+20).
Purchase activity remains muted, though acquisition counts don't fully capture deliveries from AMH's internal development program.
Amherst
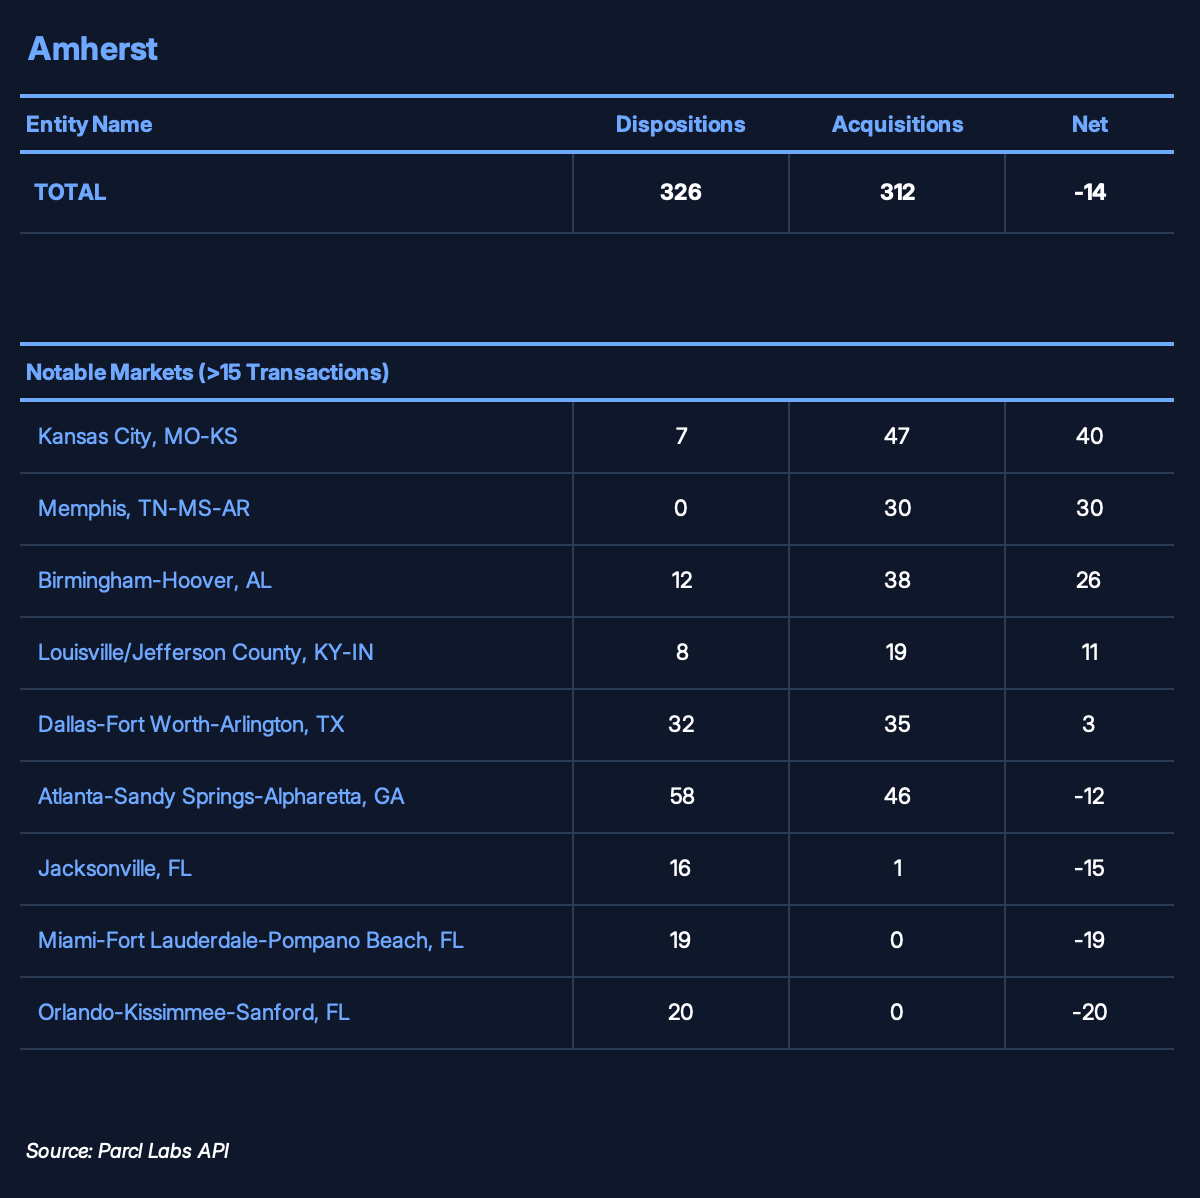
Amherst was roughly flat in 4Q. The operator continued building positions in secondary markets via scattered-site buys: Kansas City (+40), Memphis (+30), Birmingham (+26), and Louisville (+11).
Dallas was nearly balanced, with 35 acquisitions against 32 dispositions. The main disposition markets were Florida-focused: Orlando (-20), Miami (-19), and Jacksonville (-15). Atlanta also saw modest selling (-12).
First Key Homes
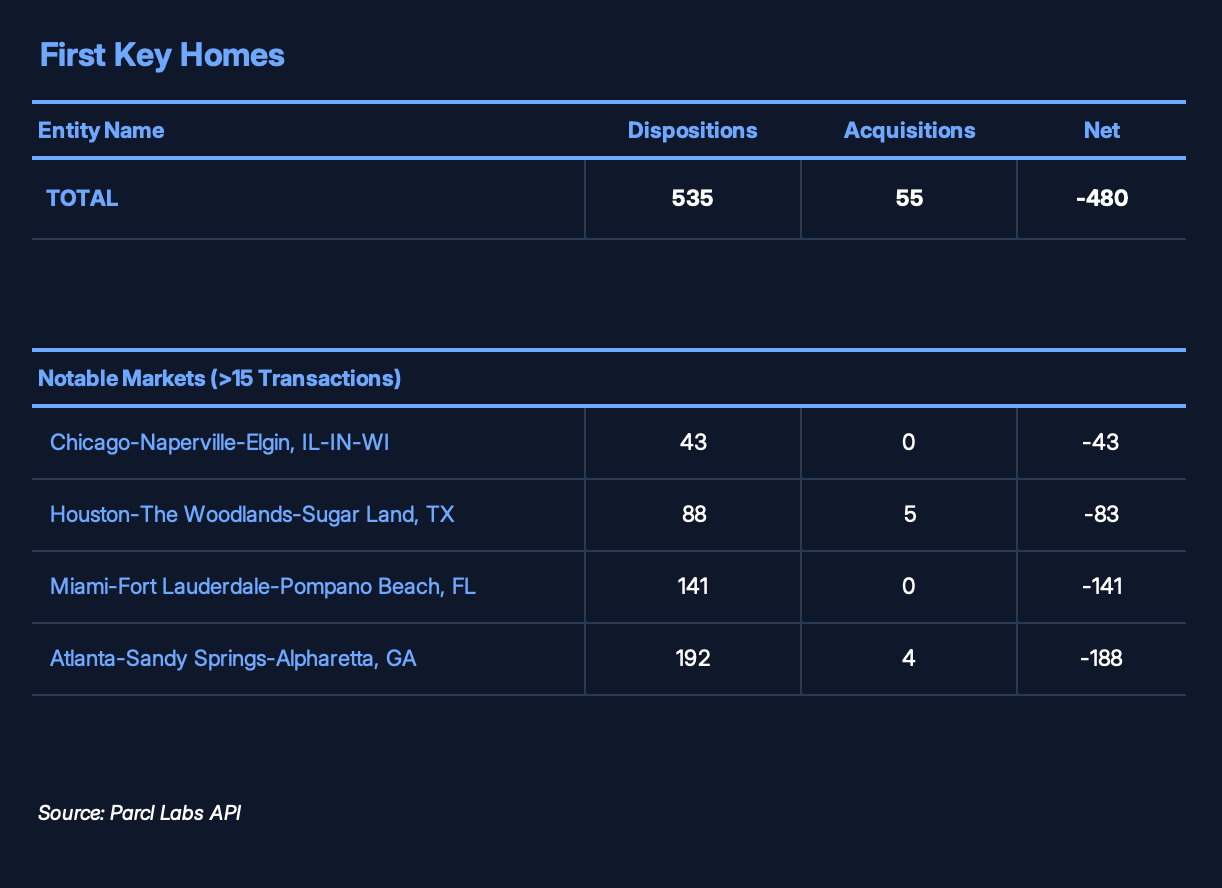
First Key was among the most active sellers in 4Q, with 480 net dispositions. Selling concentrated in Atlanta (-188), Miami (-141), Houston (-83), and Chicago (-43).
We flagged this in our July research "Inside Institutional Selling," which documented the operator's elevated motivated-seller behavior: more homes listed for sale and deeper, more frequent price cuts. That pattern continued through year-end.
Home Partners of America
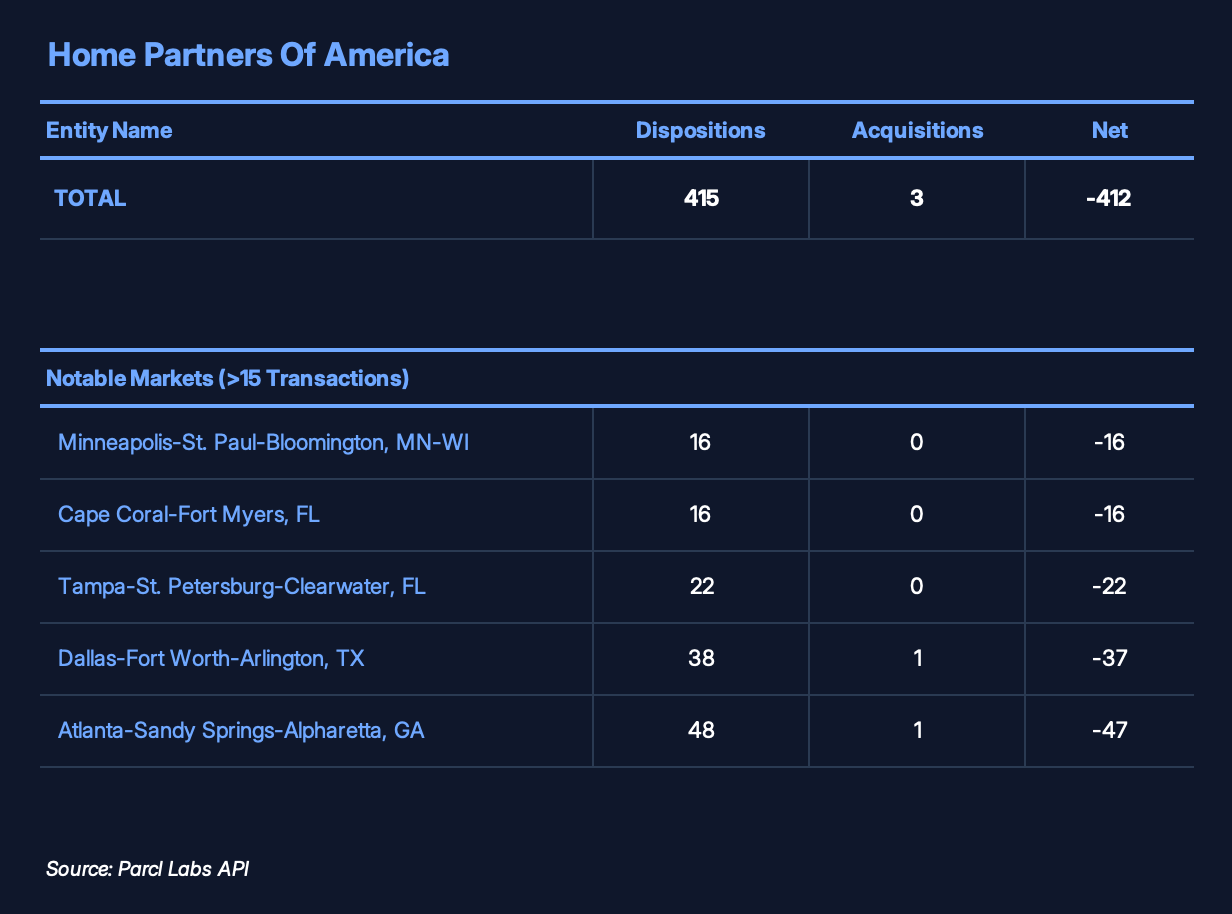
HPA was strictly a disposer in 4Q, shedding 412 units with only 3 acquisitions.
Blackstone owns both HPA and Tricon. Blackstone shut down HPA and transferred its operations under Tricon's management. The ongoing dispositions reflect continued shedding of underperforming assets from the HPA portfolio.
Invitation Homes
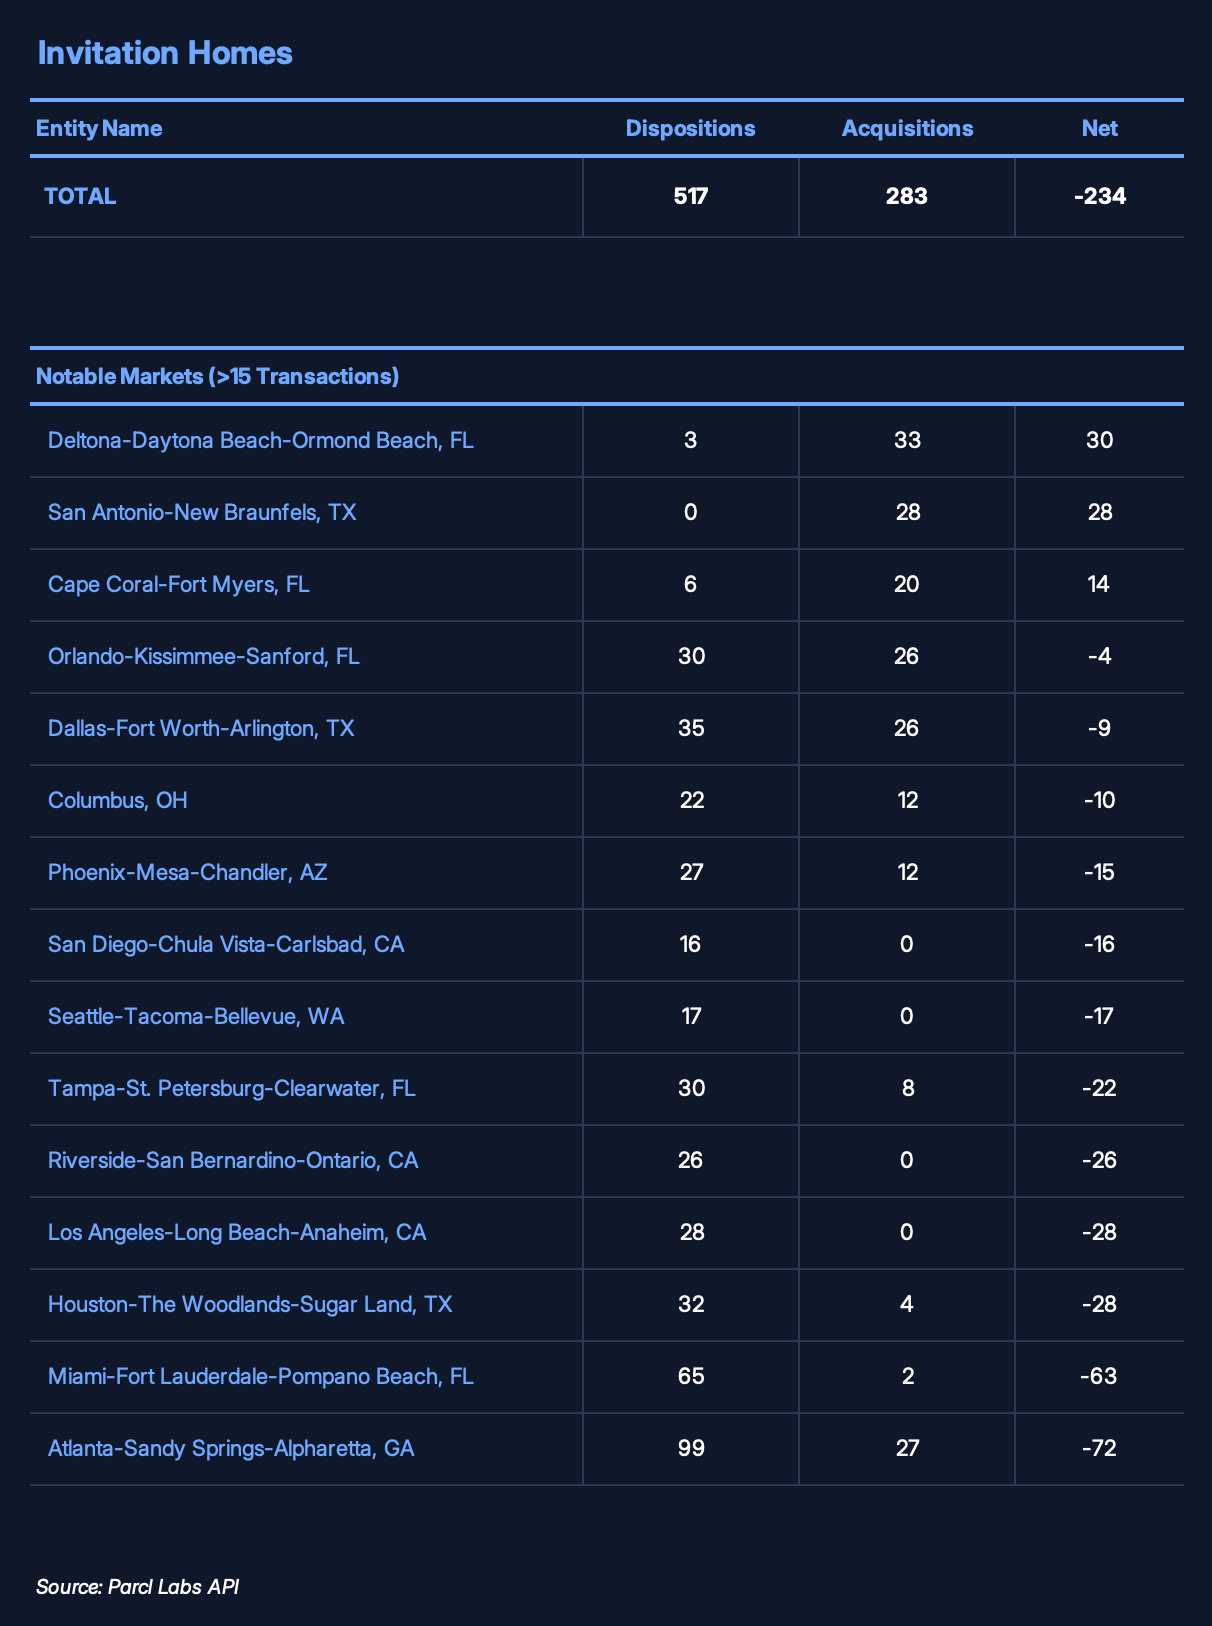
INVH was a net seller of 234 units in 4Q (based on transactions recorded through January 20). Atlanta led dispositions, followed by Miami, Houston, LA, Riverside, Tampa, and Seattle.
For acquisitions, INVH management has talked about buying from builders at discounts to market value. We dug into the 4Q transactions and found exactly that. INVH is sourcing largely from builders, both national (D.R. Horton, Meritage, Lennar, Pulte, LGI) and regional (Synergy Homes, A&R Meridian). The mix includes planned BTR deliveries and discounted new builds in softening Florida markets like Cape Coral and Palm Bay.
This strategy now has a regulatory tailwind. Trump's January 20 executive order targeting institutional buyers carves out BTR communities as an allowable purchase type. INVH's builder pipeline doubles as a hedge.
Progress Residential
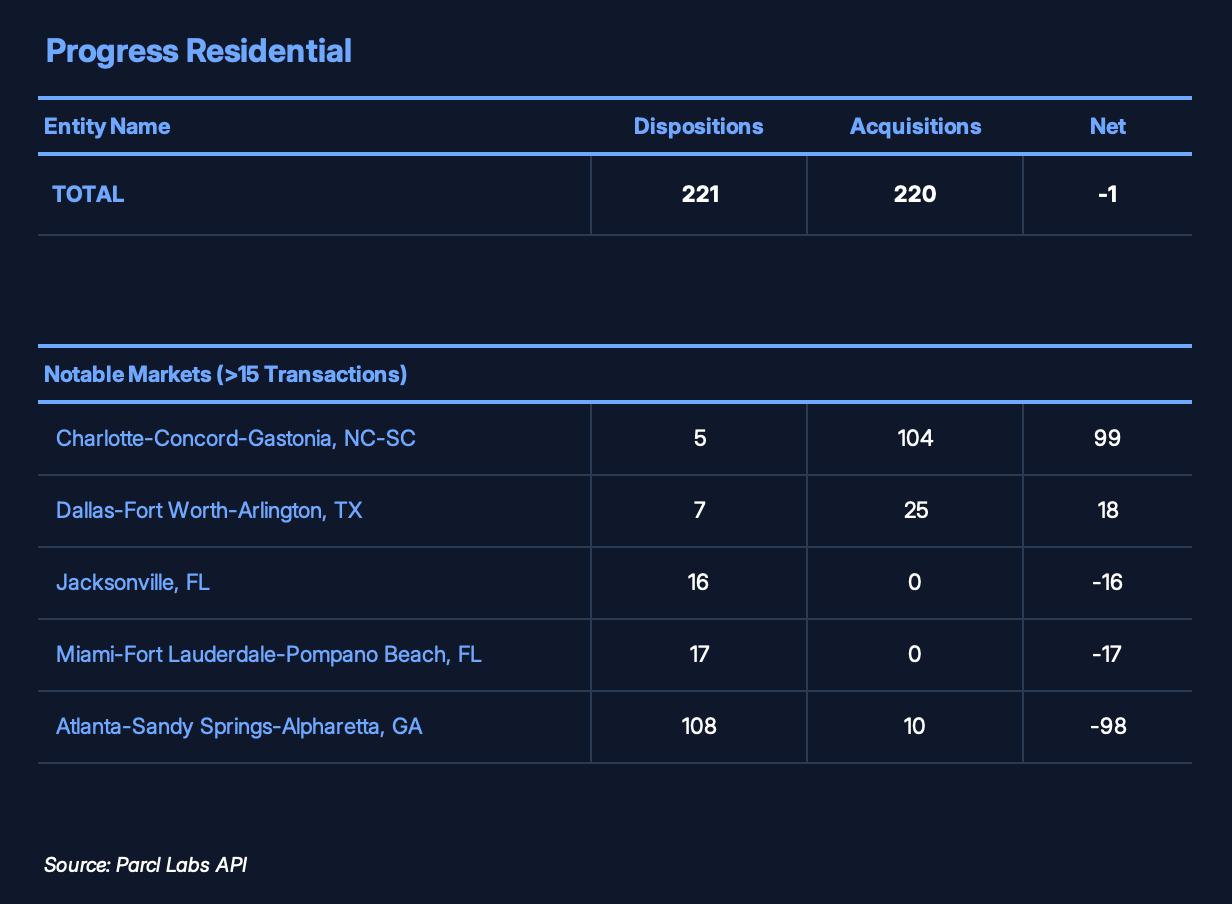
Progress was nearly flat in 4Q, with just 1 net disposition across 441 total transactions. A stabilization from earlier quarters.
Charlotte was the clear acquisition focus, with 99 net adds. The Charlotte activity includes Progress taking full ownership of a Harmon BTR community previously held in a joint venture with Crescent Communities.
Tricon Residential
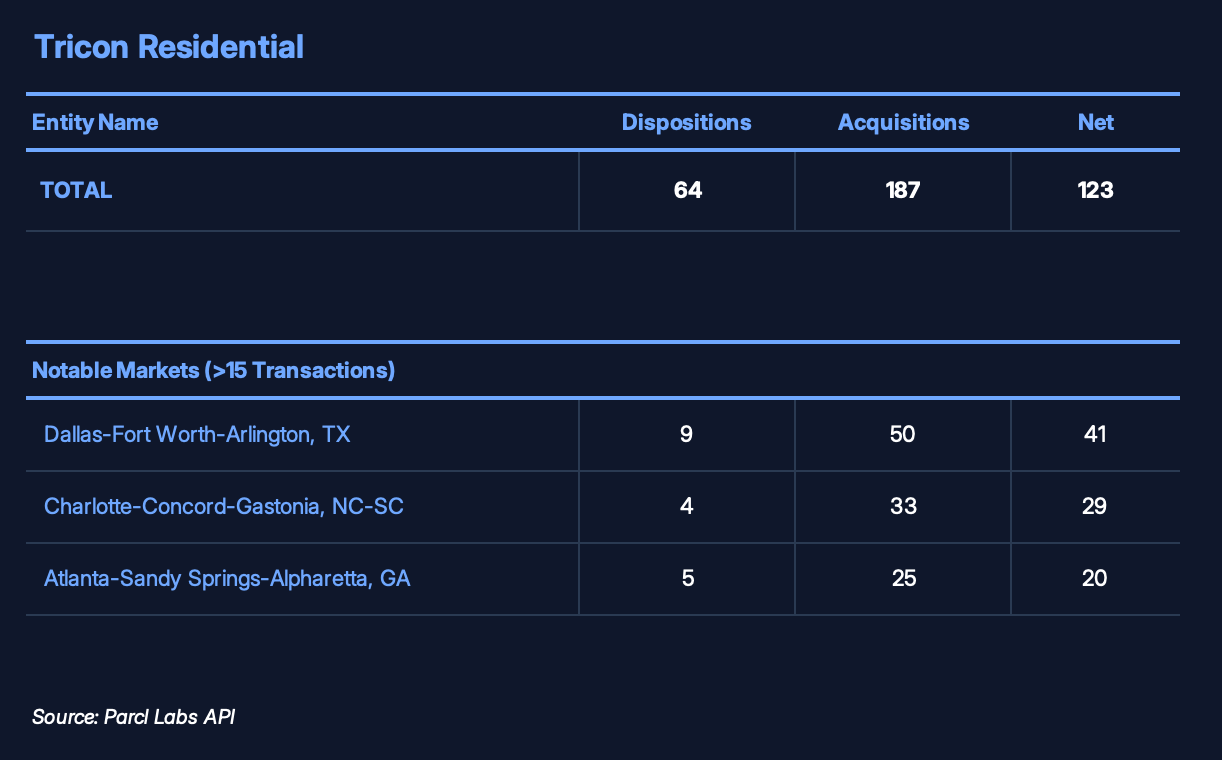
Tricon remains the most active acquirer among large operators. In 4Q, Tricon added 123 net units across 251 total transactions.
The 4Q acquisitions were primarily scattered-site purchases. Dallas led with 41 net acquisitions, followed by Charlotte (+29) and Atlanta (+20). Tricon's continued buying in Atlanta stands in contrast to virtually all peers who are selling there.
Vinebrook Homes
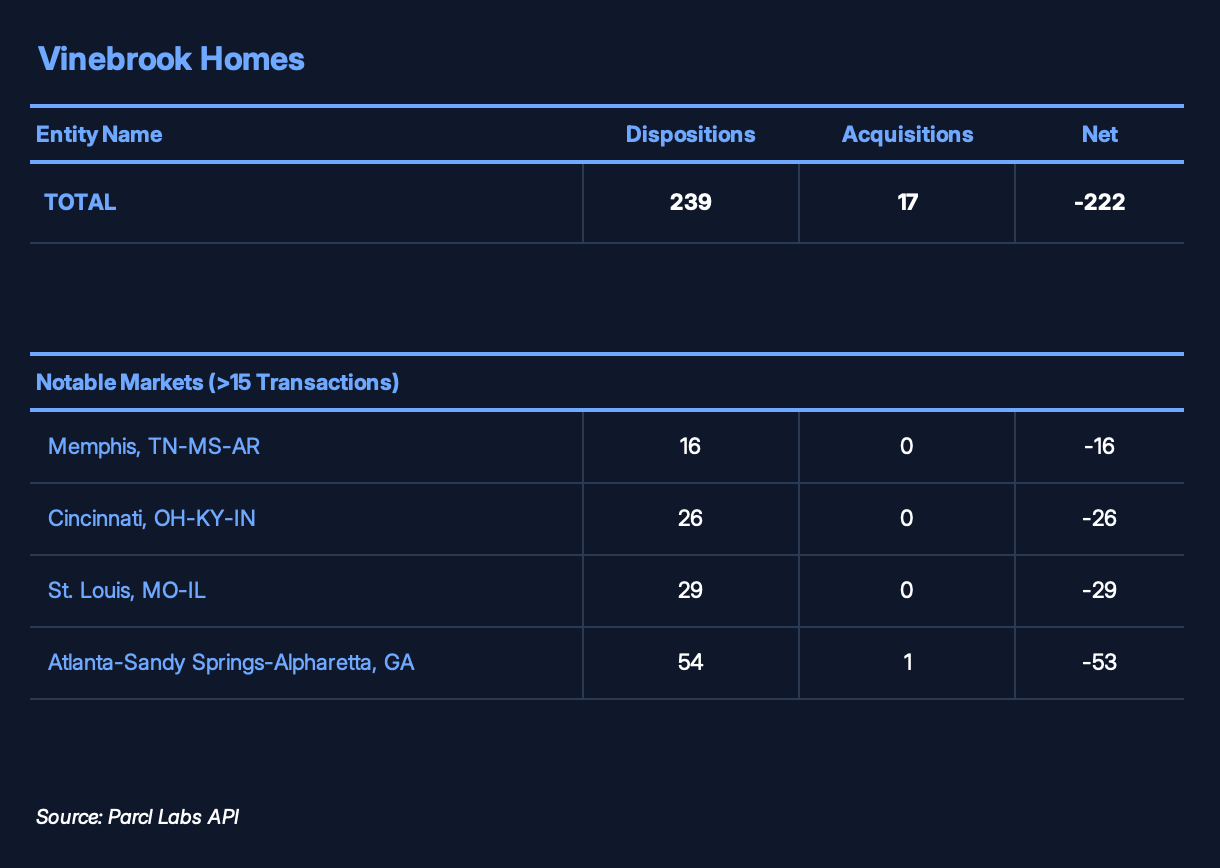
Vinebrook, which specializes in workforce housing, was a net seller in 4Q, shedding 222 units. Dispositions concentrated in Atlanta (-53), St. Louis (-29), Cincinnati (-26), and Memphis (-16).
Track SFR Portfolio Activity in Real Time
Want to stay up-to-date between quarters? Parcl Labs offers multiple solutions to track SFR activity in real time:
Access Parcl Labs API for daily-updated, property-level data mapped to true owner entities
Explore Parcl Labs SFR dashboard for live KPIs
Contact us at team@parcllabs.com for early access to portfolio analytics and monitoring for operators and investors of any size.
Methodology
This analysis reflects data pulled on January 20, 2026, representing transaction counts that occurred during 4Q 2025 captured as of that date. Acquisitions may experience a lag due to the recording process in official government sales data, particularly for off-market portfolio and bulk deals such as BTR transactions, which means acquisition figures may be slightly understated at the time of publishing.
As a result, this report provides an early look at 4Q market strategy and portfolio activity for these 8 major national SFR operators. Final 4Q figures may show modest upward revisions to acquisition counts as additional transactions are recorded.
Learn more about Parcl Labs investor data methodology in our documentation.
Continue Reading
Subscribe to access the full article and unlock exclusive insights.

Follow Us for More