Are Investors Heading for the Exits?
Feb 26, 2026 · 14 min read
Analyzing investor selling behavior as the White House moves to ban Wall Street homebuyers

Executive Summary
The White House is advancing a proposal to ban investors owning 100+ single-family homes from purchasing additional properties. While the policy works its way through Washington, investors aren't waiting. Parcl Labs' investor-mapping technology links true corporate owners to their for-sale listing activity, making it possible to track how they're responding in real time. We analyzed the data. Here's what we found.
Investor exits were underway before the Executive Order. In every major metro, investor share of new for-sale listings exceeds their share of the housing stock. Thirteen markets show a listing-to-ownership ratio above 1.5x, led by Dallas-Fort Worth (2.48x), Philadelphia (2.36x), and Houston (2.10x).
The investor retreat is accelerating. Investor listing share has surged since late 2024. Purchase-to-sale ratios confirm the shift: Atlanta investors now sell nearly two properties for every one they buy (0.58 ratio). Investor purchase activity has been declining since rates rose in 2022, well before the current administration took office.
The 100+ segment the ban would target is already moving. Parcl Labs tracks 11,221 active for-sale listings from 714 portfolios meeting the proposed 100+ ownership threshold. Of those, 4,142 properties (37%) are classified as fire sale on our Motivated Seller Index, concentrated in Dallas-Fort Worth, Houston, Atlanta, and Tampa.
The biggest institutional landlords are largely on the sidelines. One is not. Invitation Homes, AMH, and Progress Residential show small for-sale counts relative to their portfolios and moderate urgency scores. The outlier is FirstKey Homes (Cerberus): 301 active listings, 95% highly motivated, average price cut 19.8% from original ask.
Atlanta is the market to watch. It ranks as a top-three disposition market for every named operator in this analysis, and it's where institutional and overall investor ownership is most concentrated. When selling pressure spikes in markets where these players own a material share of housing stock, it has the potential to move local home prices for everyone.
The situation is evolving fast. Parcl Labs is the only way to track it in real time. Our Data Vault provides direct access to the ownership, listing, and transaction data behind this analysis. With Portfolio Hunter, you can analyze and track investor portfolios of any size across the country.
Investor Exits Started Before the Executive Order
On January 20, 2026, President Trump signed an executive order titled "Stopping Wall Street from Competing with Main Street Homebuyers," directing federal agencies to develop restrictions on large institutional investors purchasing single-family homes (exempt Build-to-Rent). A month later, the White House sent draft legislation to Congress proposing a specific threshold: investors owning more than 100 single-family homes would be banned from buying additional properties.
How are investors reacting? Parcl Labs is uniquely positioned to answer. Our investor-mapping technology identifies true corporate owners, cohorts them by portfolio size, and links ownership records to real-time for-sale listing activity. That linkage is critical because standard transaction data only captures completed sales, which reflect decisions made months ago. Listing data shows what investors are doing now.
Across investors as an overall cohort, the early signal is clear: in key markets, investors are putting homes up for sale at rates that far exceed their share of the housing stock.
The chart below shows two data points for each of the 20 largest U.S. metros: investor share of total housing stock (what they own) and investor share of new for-sale listings (what they're trying to sell). When the listing dot sits to the right of the ownership dot, investors are selling at a rate disproportionate to their footprint. The wider the gap, the more aggressive the exit.
In every top metro, the listing share exceeds the ownership share:
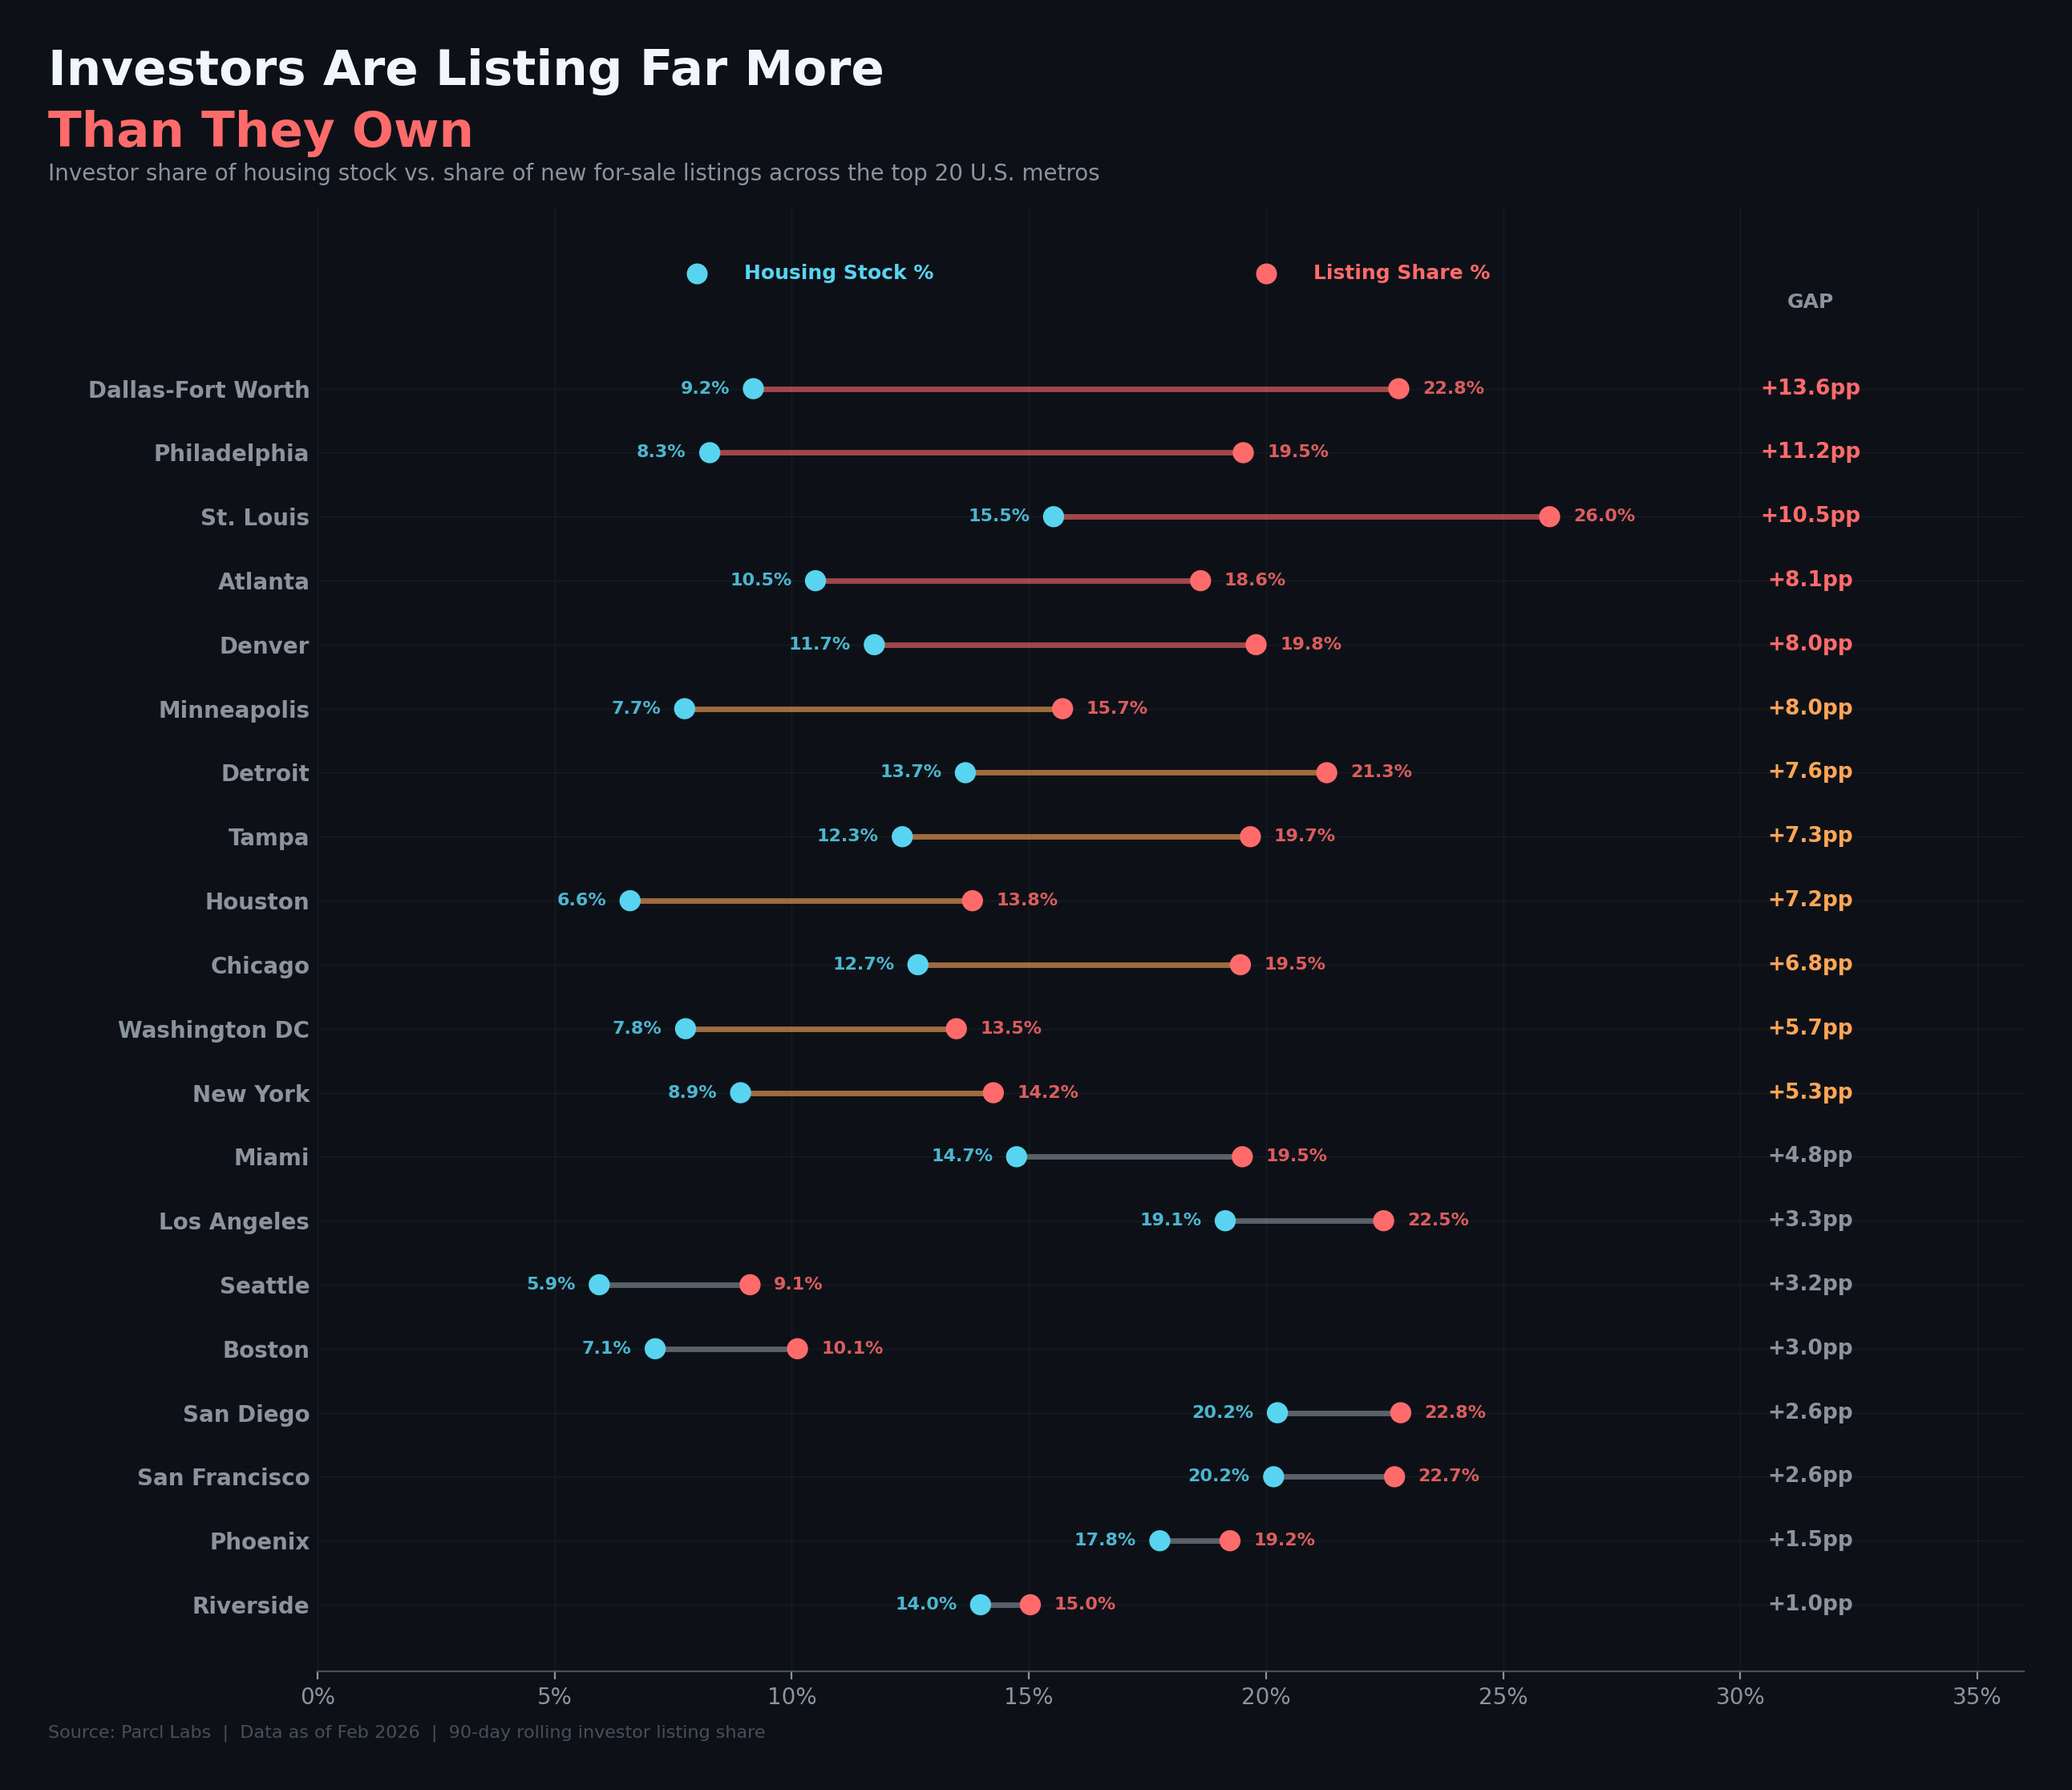
The gap is widest in the Sun Belt and Midwest metros where institutional portfolios are concentrated. Dallas investors own 9.2% of the housing stock but account for 22.8% of new for-sale listings, a 13.6 percentage point gap. St. Louis shows a 10.5 point gap. Atlanta, Denver, and Minneapolis all exceed 8 points.
Expressing that same gap as a ratio sharpens the picture. A listing-to-ownership ratio of 1.0x means investors are listing in exact proportion to what they own. At 2.0x, their listing share is double their ownership share.
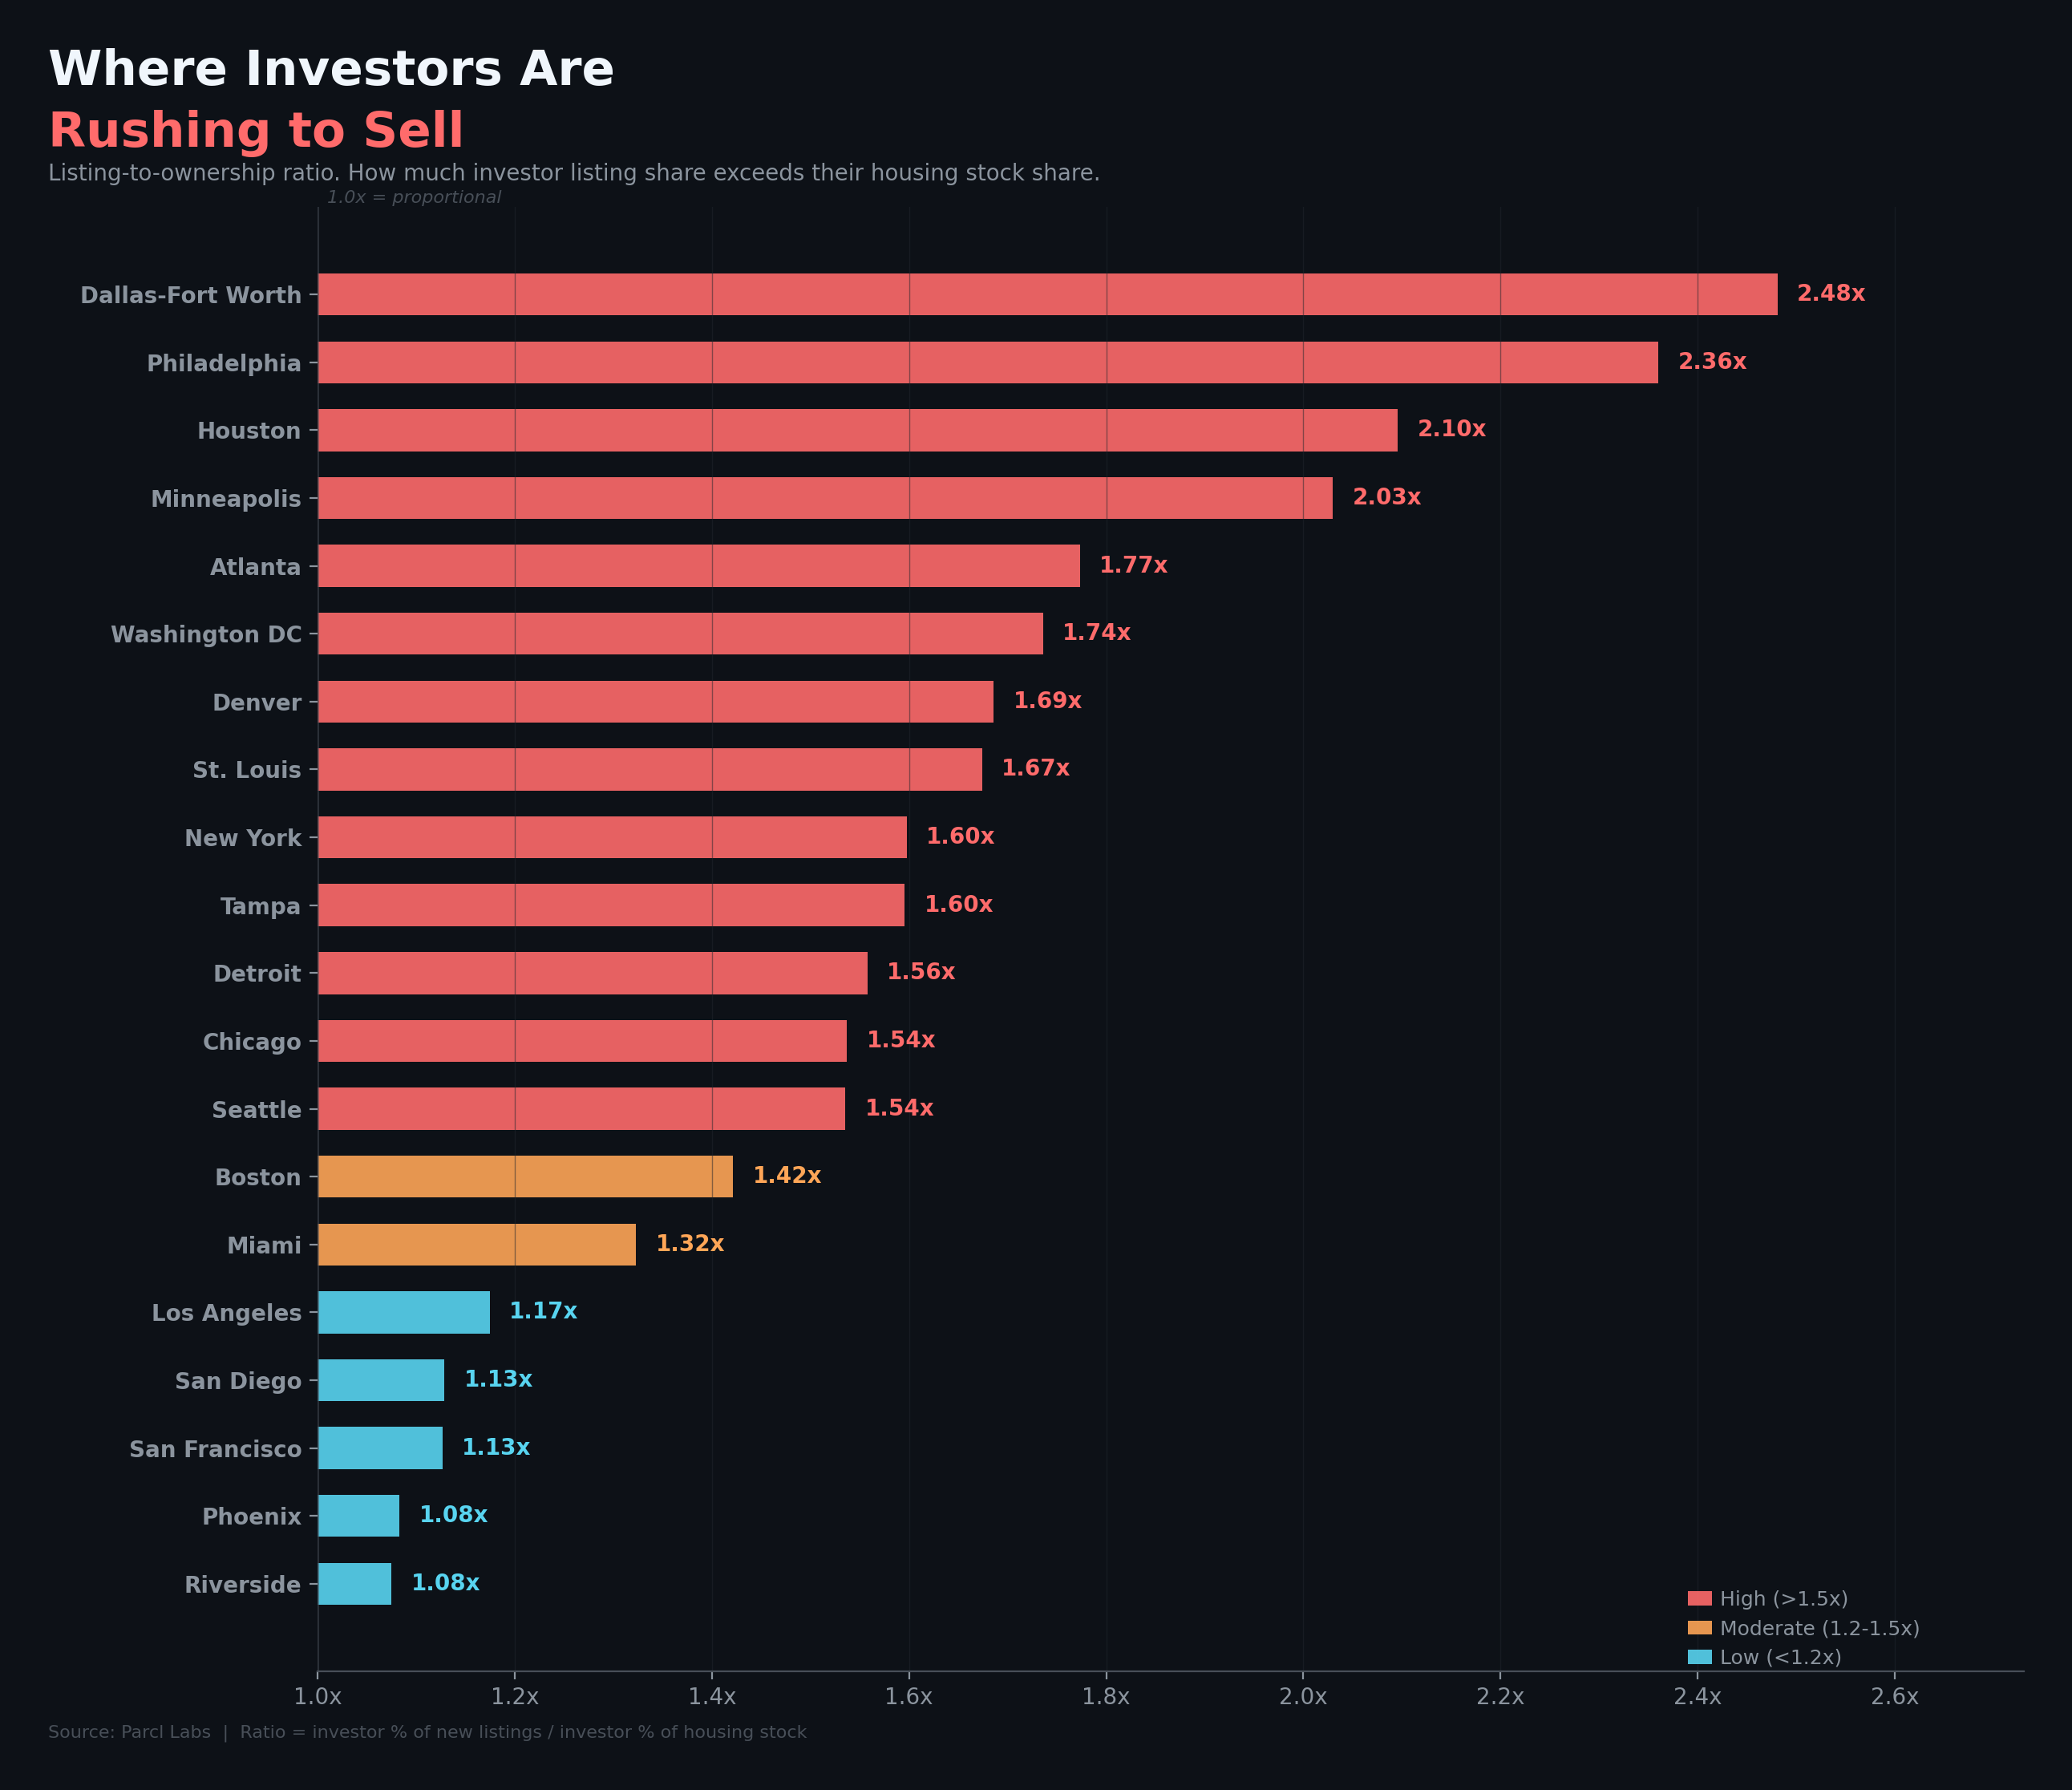
Dallas-Fort Worth leads at 2.48x: investors' share of new listings is nearly two-and-a-half times their share of the housing stock. Philadelphia follows at 2.36x, Houston at 2.10x, Minneapolis at 2.03x. Thirteen of 20 metros exceed 1.5x, meaning investors in those markets are listing at more than 50% above their ownership weight.
The Retreat Is Accelerating
The skew ratios above capture the current state. But this selling pressure didn't appear overnight. Investor listing share has been climbing for over a year, accelerating sharply into 2026.
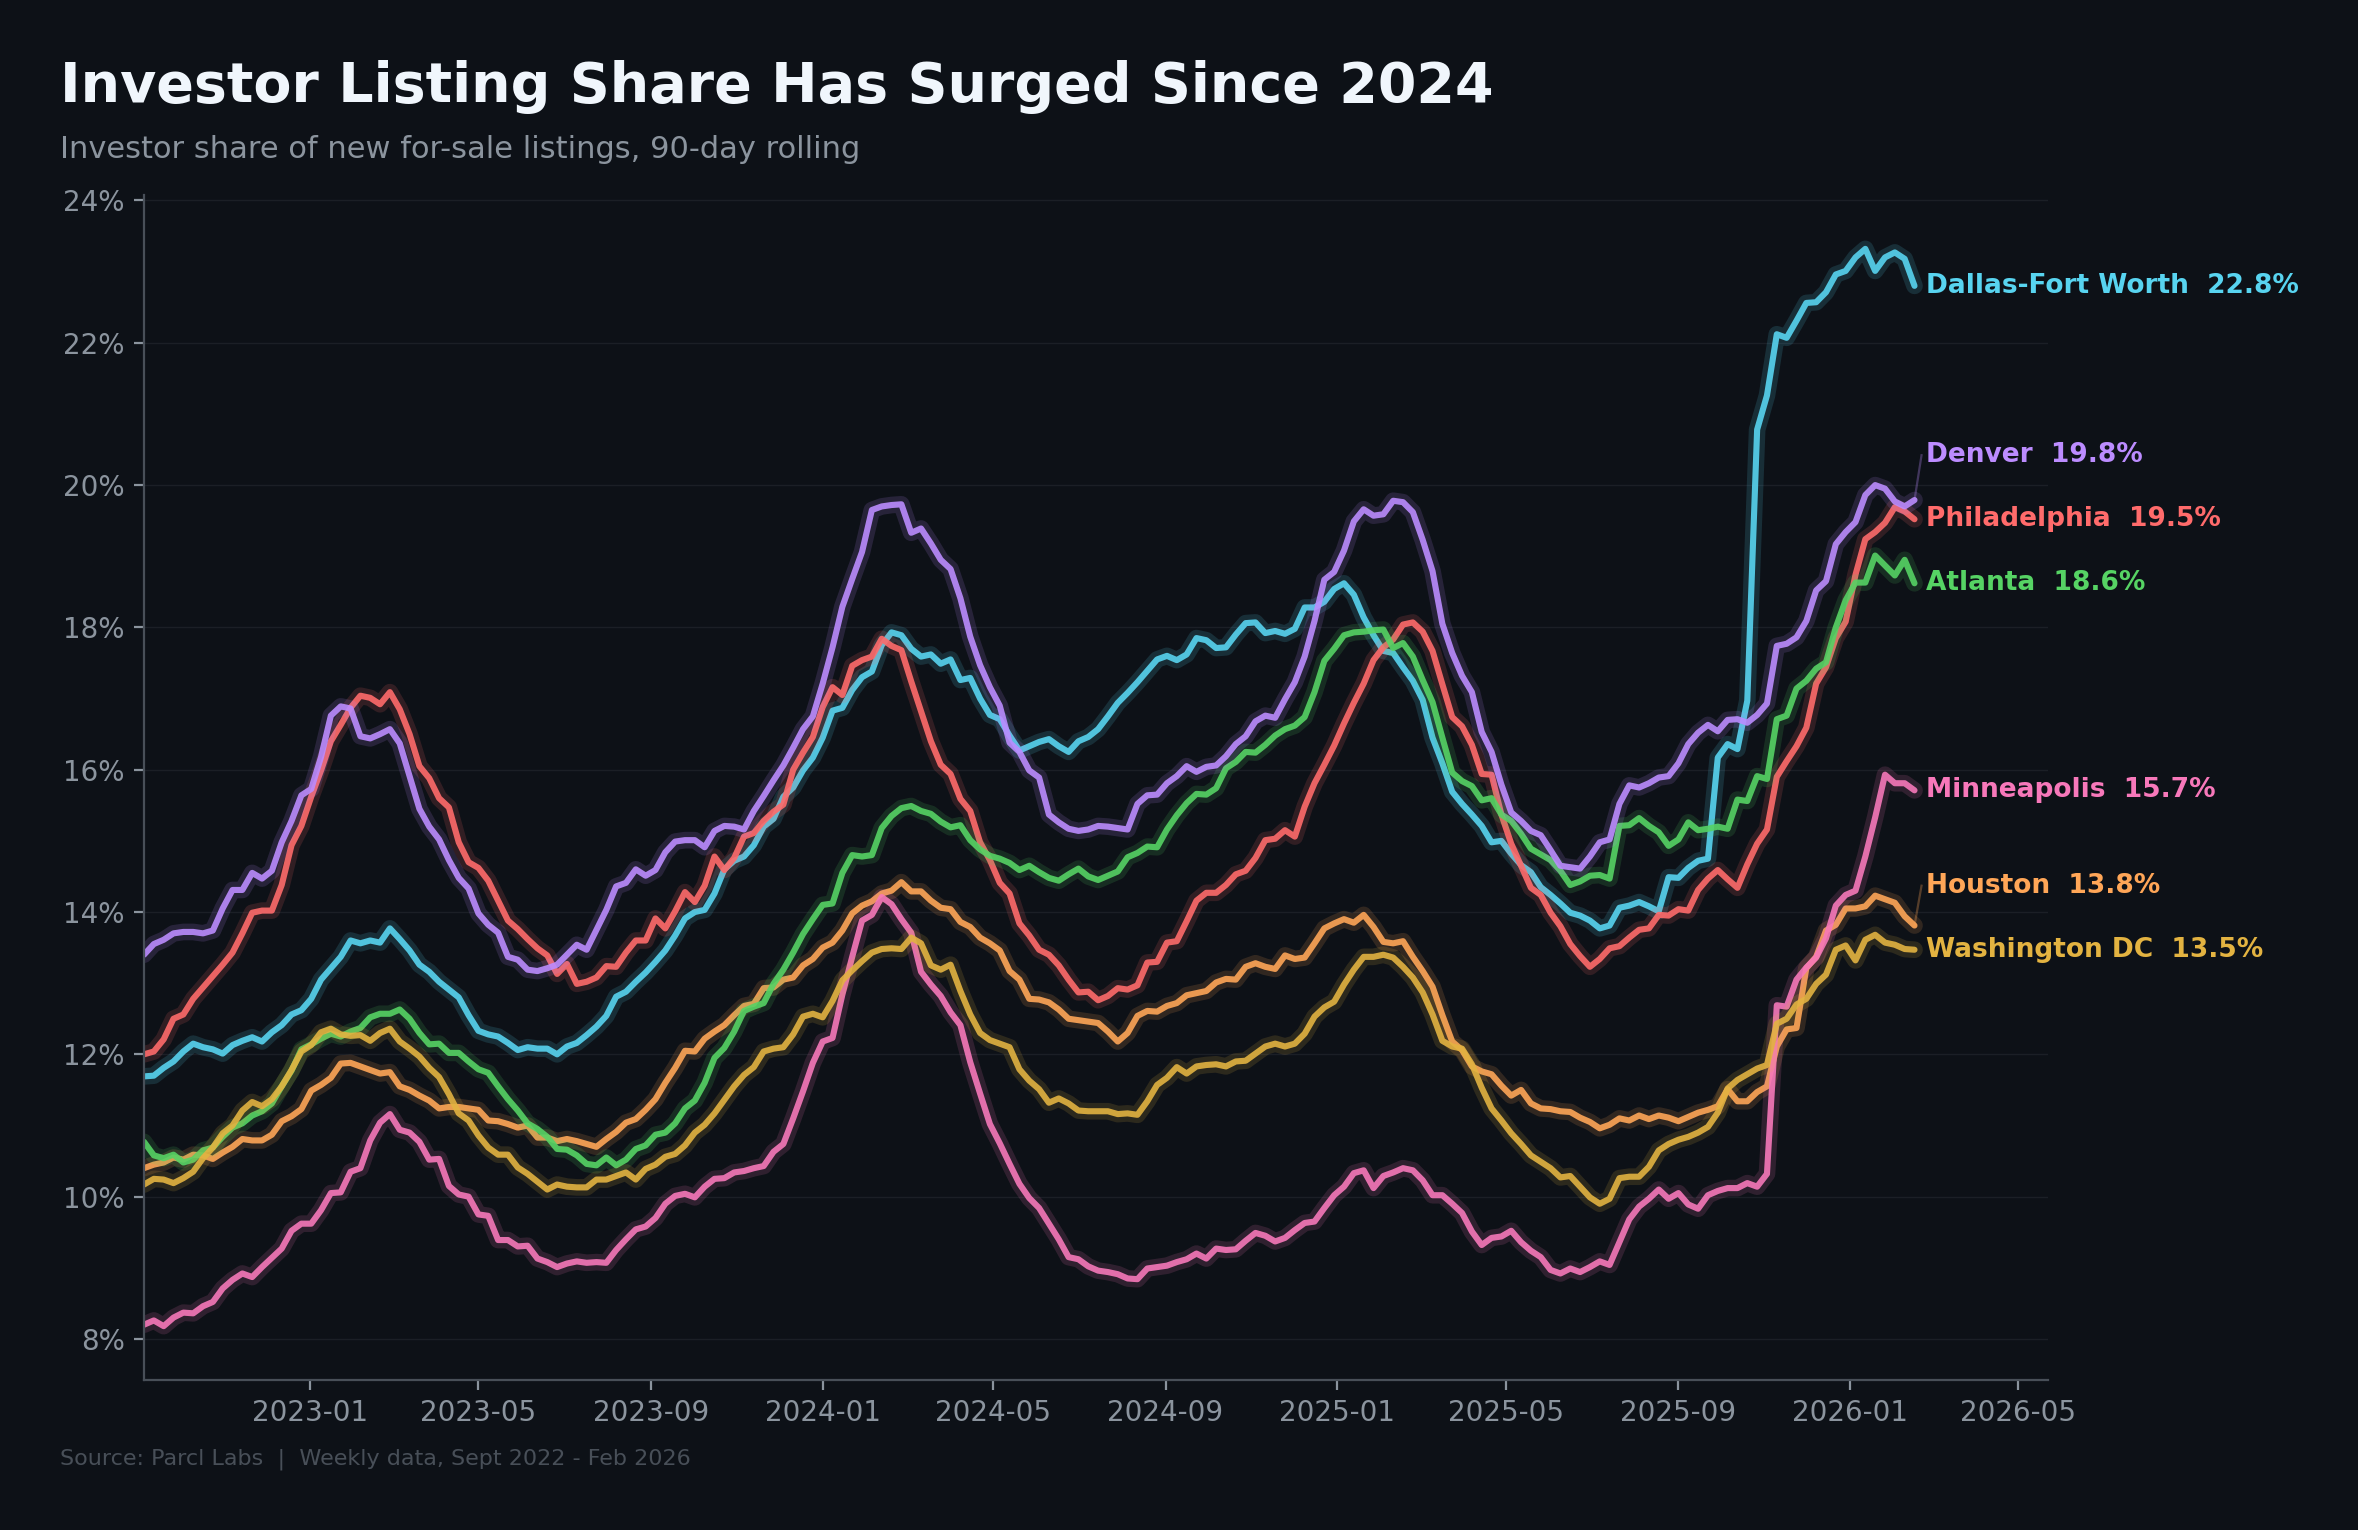
Dallas-Fort Worth's investor listing share rose from roughly 14% in mid-2024 to 22.8% by February 2026. Denver jumped from 12% to nearly 20%. Philadelphia and Atlanta both surged above 18%.
The natural counterargument: maybe investors are simply more active on both sides, buying and selling at higher volumes. Parcl Labs' purchase-to-sale ratio rules that out.
This metric tracks investor acquisitions against dispositions. Above 1.0, investors are net buyers. Below 1.0, they're net sellers. The chart below shows 3-month rolling averages for the key metros since 2019:
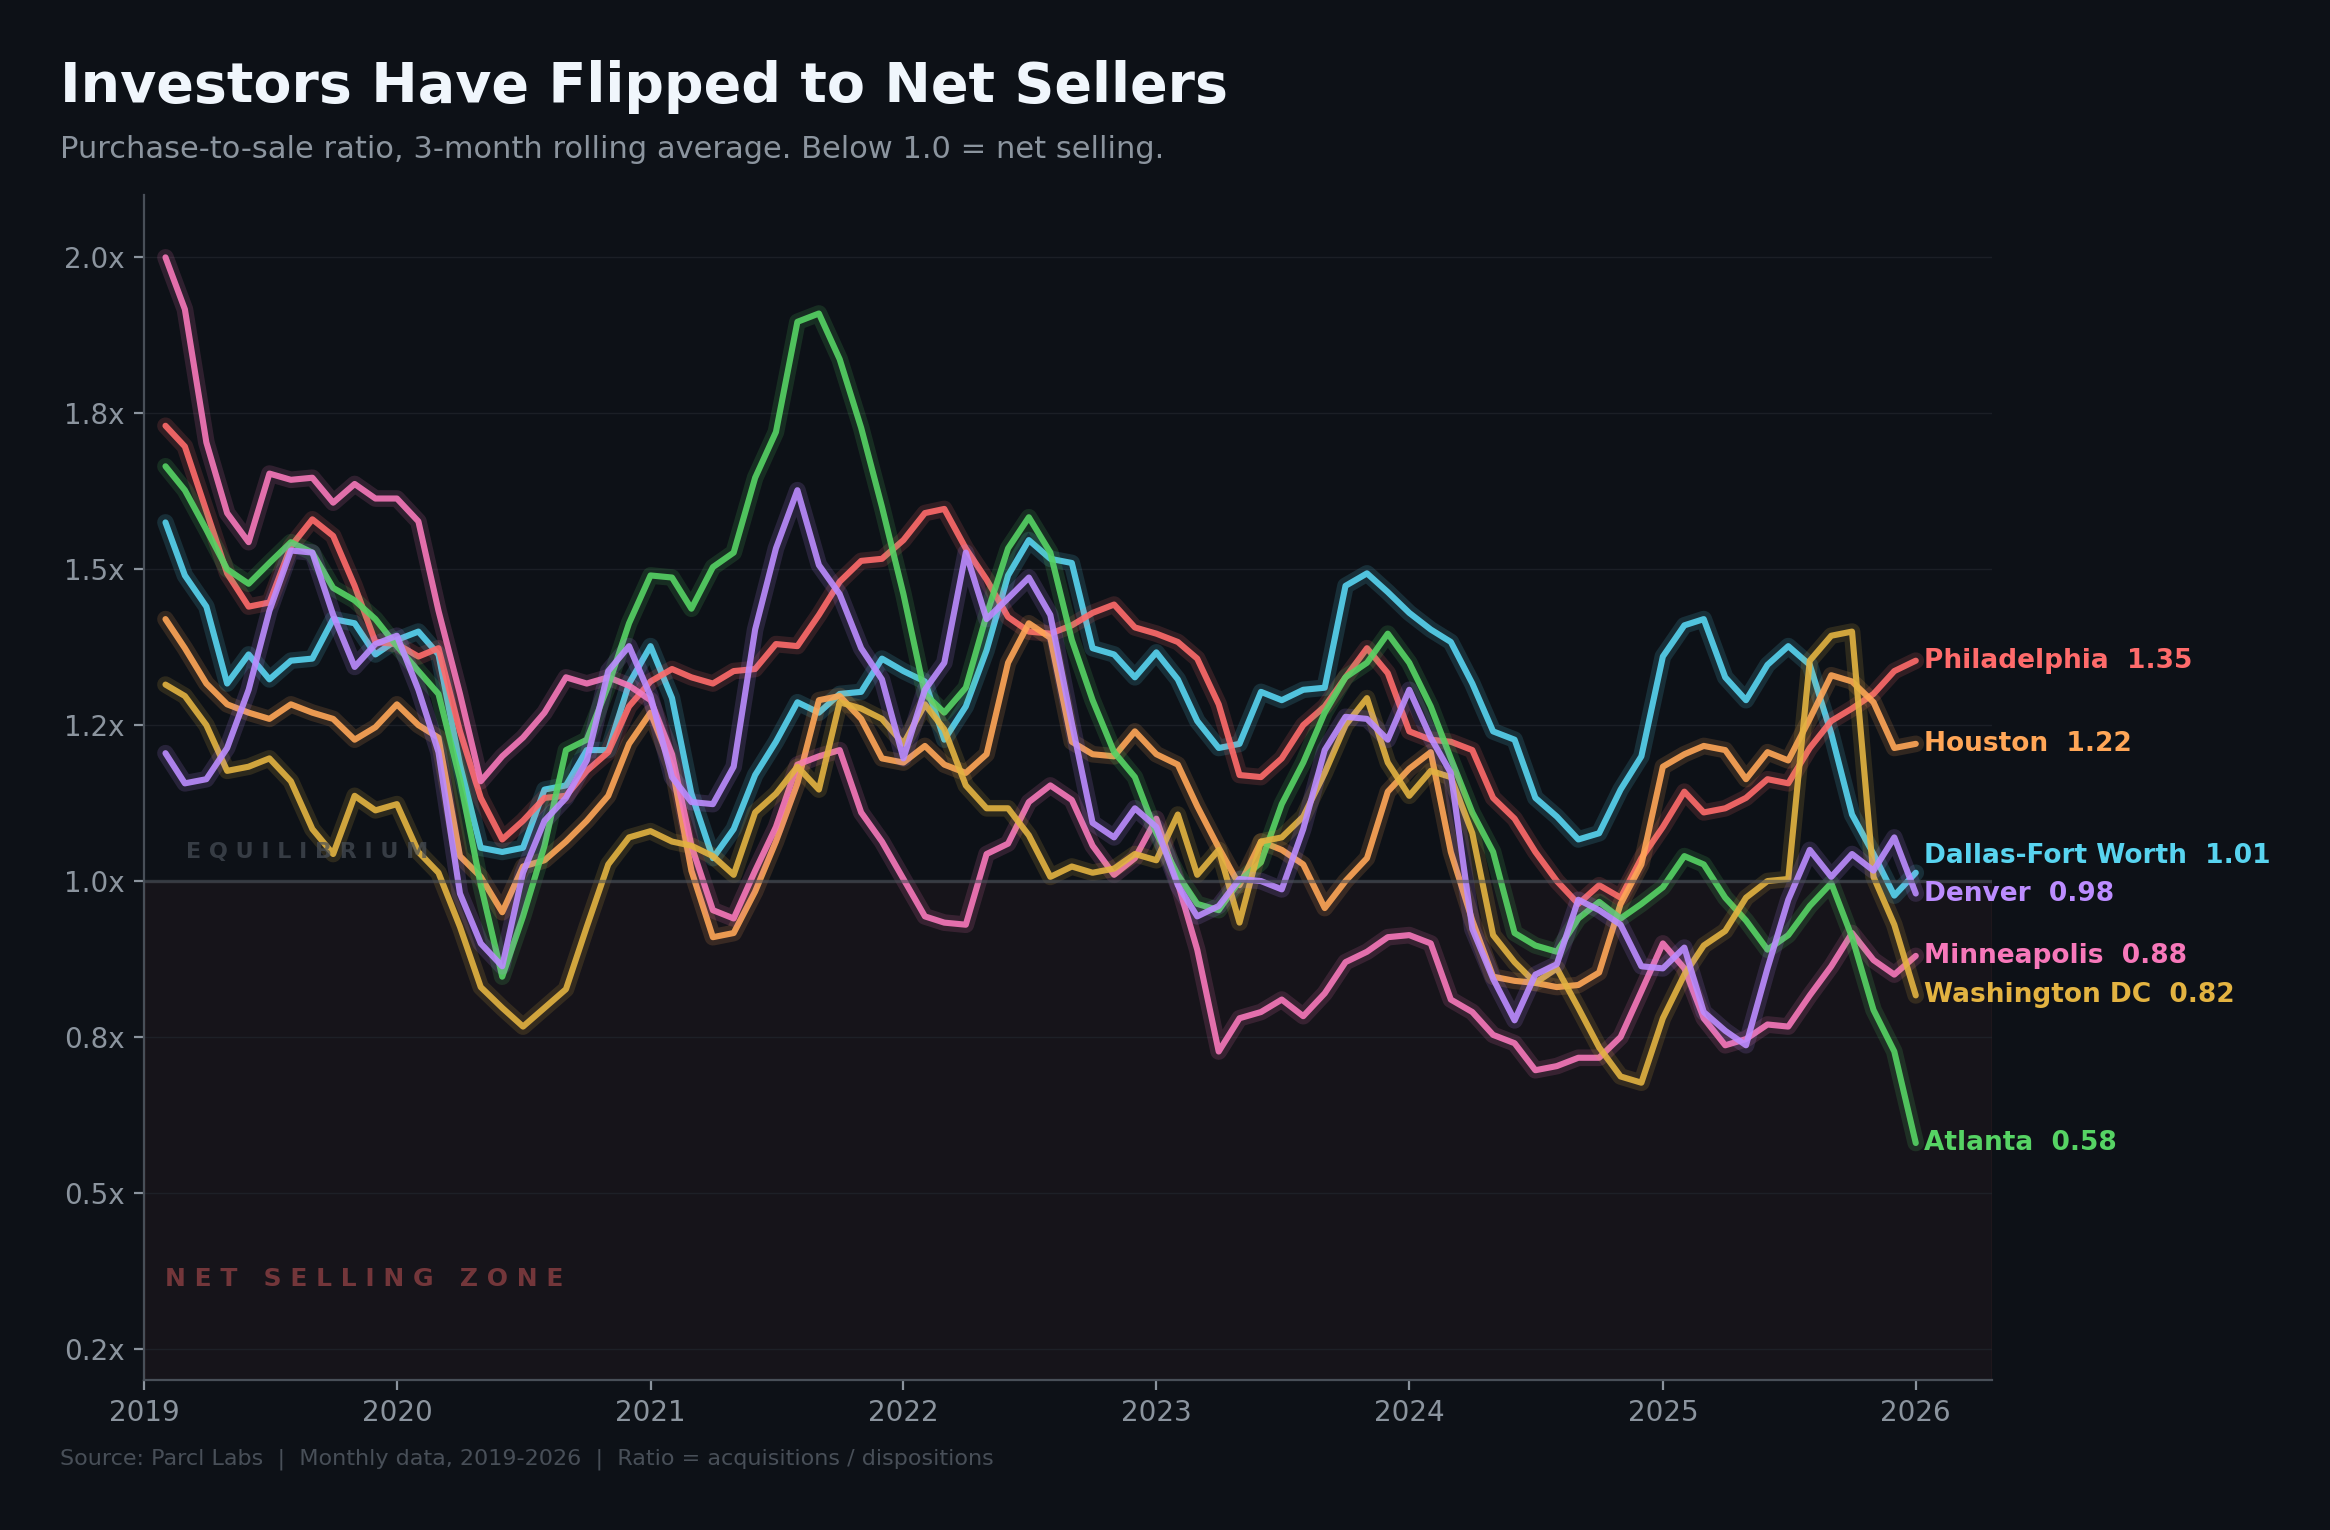
During the 2020-2021 accumulation years, ratios across these markets regularly exceeded 2.0x, meaning investors bought twice as many homes as they sold. That era is over. Atlanta has collapsed to 0.58: investors now sell nearly two properties for every one they acquire. That number carries extra weight because Atlanta is the single largest concentration of institutional SFR ownership in the country. Minneapolis (0.88), Washington DC (0.82), and Denver (0.98) have also crossed into net-selling territory.
The proposed ban targets investor purchases, not ownership. Investor purchase activity has already been falling since rates rose in 2022, before the current administration took office. The ban would restrict a behavior that the market has been curtailing on its own for years.
Investors Are Motivated Sellers
Listing volume tells one part of the story. The other part is pricing behavior. An investor listing a property at market rate and waiting patiently is managing a portfolio. An investor slashing price repeatedly over months is trying to get out of a position.
The Parcl Labs Motivated Seller Index captures this distinction. It scores every active listing on a continuous scale based on days on market, number of price cuts, magnitude of reductions, and velocity of those cuts. Properties are classified into four categories: fire sale, motivated, stubborn, or neutral. The chart below shows average MSI scores and the share of highly motivated listings (fire sale + motivated) across investor-owned properties in each metro.
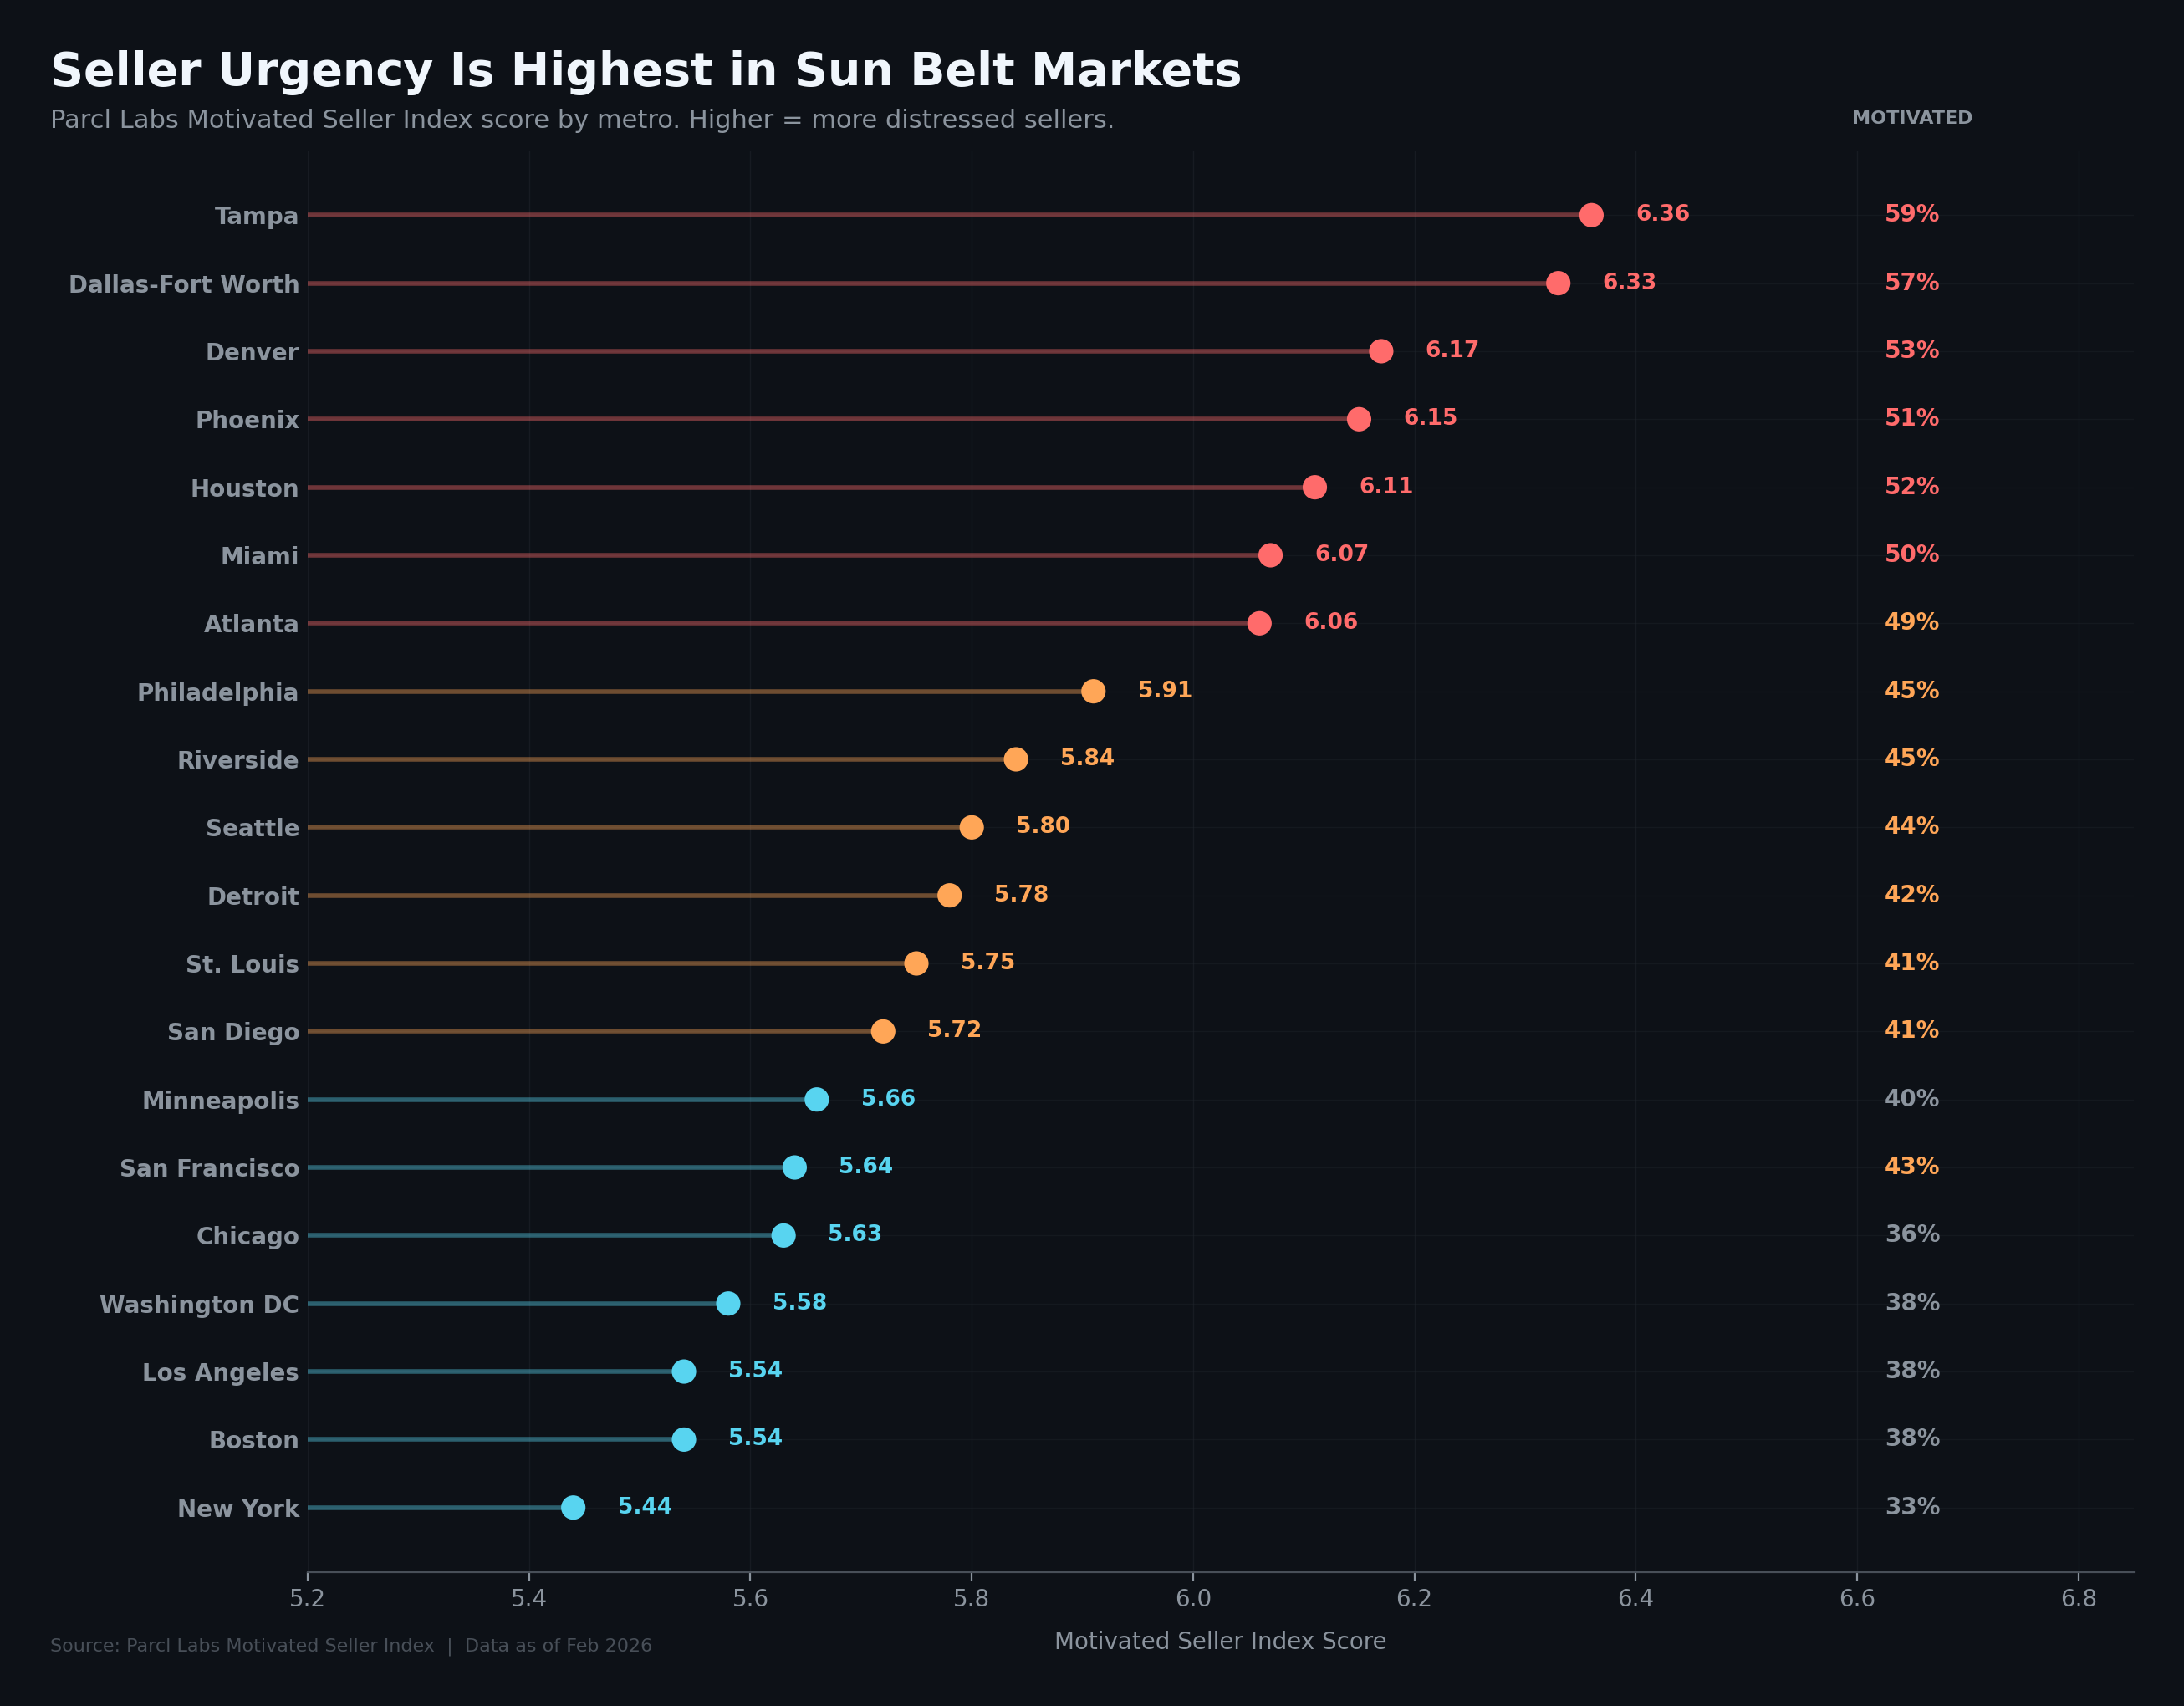
Tampa leads at 6.36, with 59% of all investor-listed properties classified as highly motivated. Dallas-Fort Worth is close behind at 6.33 (57%), followed by Denver at 6.17 (53%), Phoenix at 6.15 (51%), and Houston at 6.11 (52%).
The metros where investors are listing most aggressively are the same markets where that listing activity is most urgently priced. These are also predominantly Sun Belt markets where overall seller motivation already runs hot. Investors trying to exit aren't doing so into calm, balanced markets. They're competing for buyers alongside every other motivated seller cutting prices around them.
Inside the 100+ Home Segment the Ban Would Hit
The analysis above covers all investors. Now we narrow to the segment the White House is actually targeting: portfolios of 100 or more single-family homes. That 100-home threshold is a much wider aperture than the industry's typical definition of "institutional," which usually starts at 1,000+ homes. The proposed ban would reach far beyond the handful of household-name SFR operators and into hundreds of mid-size firms that rarely make headlines.
Parcl Labs mapped every active for-sale listing from portfolios meeting that 100+ threshold, color-coded by Motivated Seller Index score: 11,221 active listings from 714 distinct portfolios:
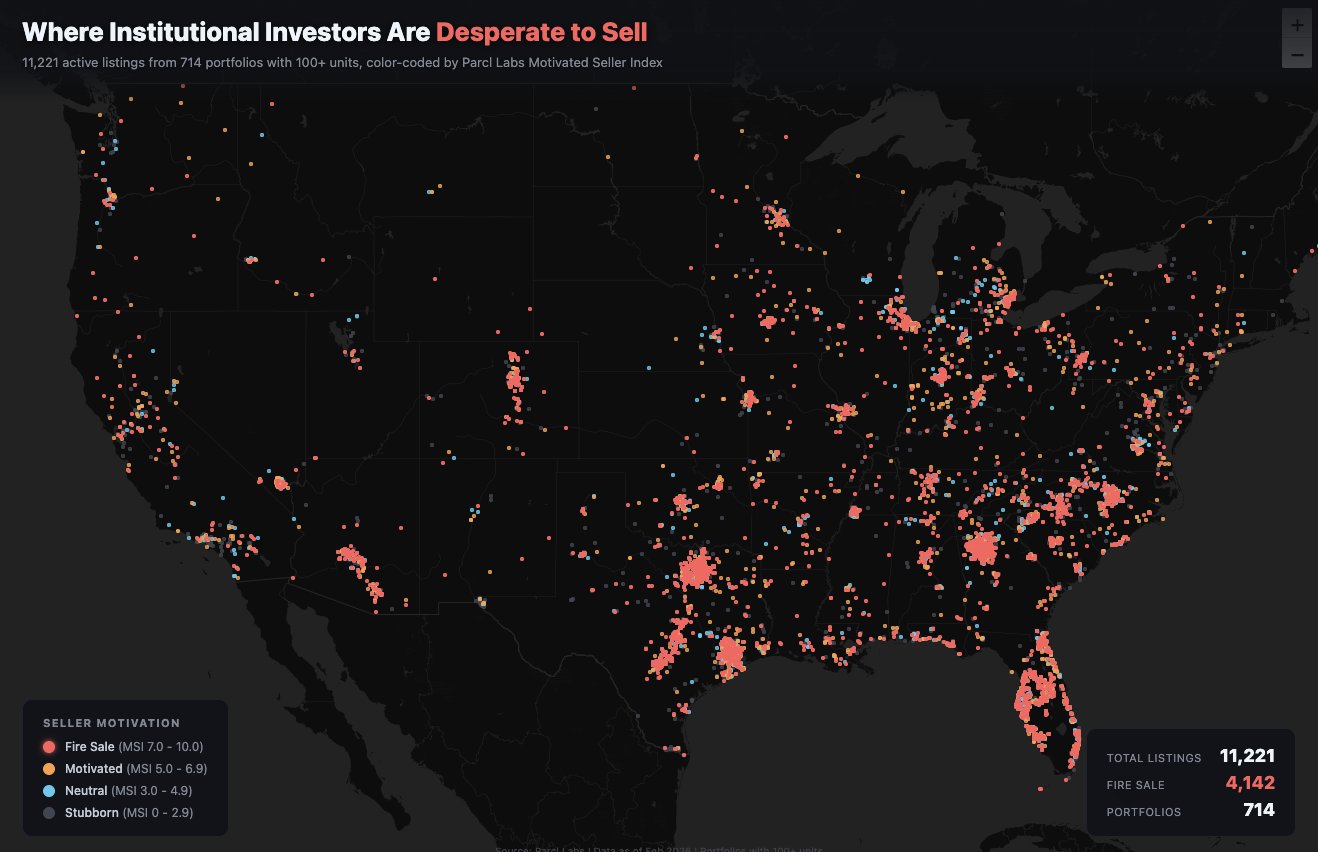
Fire-sale listings (red) cluster heavily across the Sun Belt corridor from Texas through the Southeast. Of the 11,221 listings, 4,142 (37%) are classified as fire sale, concentrated in Dallas-Fort Worth, Houston, Atlanta, and Tampa. The pattern mirrors the broad investor analysis above: the markets where all investors are most aggressively listing are the same markets where the 100+ segment is trying hardest to sell.
Wall Street's Biggest Landlords Are Mostly Waiting It Out
The 100+ segment captures a wide range of firms. But the names at the center of the political debate are a smaller group: household-name SFR operators whose portfolios collectively represent hundreds of thousands of single-family homes. Parcl Labs' True Owner technology tracks the full scope of these portfolios and their real-time listing activity, making it possible to compare their behavior side by side.
The table below shows active for-sale listings, seller motivation metrics, and top markets for six of the largest named operators: FirstKey Homes (Cerberus), Invitation Homes, AMH, Amherst, Progress Residential (Pretium), and Tricon Residential (Blackstone).
Entity | Listings | Avg MSI | Highly Motivated | Avg DOM | Avg Cuts | Avg Price Change | Top Markets |
|---|---|---|---|---|---|---|---|
FirstKey Homes | 301 | 7.49 | 95% | 255 | 8.4 | -19.8% | Atlanta (131), Chicago (61), Miami (55) |
American Homes 4 Rent | 13 | 6.92 | 92% | 184 | 3.6 | -15.6% | Houston (4), Dallas (3), Atlanta (3) |
Amherst | 119 | 6.86 | 88% | 287 | 5.1 | -10.1% | Atlanta (41), Dallas (31), Houston (13) |
Tricon Residential | 22 | 6.82 | 86% | 226 | 4.5 | -16.7% | Atlanta (9), Houston (5), Tampa (4) |
Progress Residential | 28 | 4.96 | 50% | 335 | 3.2 | -10.6% | Atlanta (12), New York (8), Houston (3) |
Invitation Homes | 61 | 3.30 | 23% | 228 | 1.2 | -2.8% | Atlanta (25), Tampa (10), Houston (7) |
Important to note: these for-sale counts are small relative to each firm's total portfolio. Most of these operators are largely holding pat, waiting for the regulatory picture to clarify before making bigger moves. But the variation in how they're handling the positions they are exiting is telling.
FirstKey Homes is liquidating the hardest. Its 301 active listings carry an average MSI of 7.49, with 95% classified as highly motivated. Those listings have been cut 8.4 times on average, sit on market for 255 days, and show an average price reduction of 19.8% from original ask. For the positions FirstKey is trying to exit, this is fire-sale behavior.
Invitation Homes sits at the opposite end. Despite managing a portfolio roughly twice the size of FirstKey's, it has just 61 active listings, an MSI of 3.30, just 23% highly motivated, 1.2 average price cuts, and a total price reduction of 2.8%.
The common thread across all six: Atlanta. It ranks as a top-three market for every single operator in the table. The metro's combination of a highly competitive investor market, rising property taxes, and intense political scrutiny around institutional landlords has made it the epicenter of SFR disposition activity.
FirstKey Homes is the Most Aggressive Institutional Seller
FirstKey Homes, Cerberus's single-family rental platform, is the sharpest case in the data. The map below plots all 301 of its active for-sale listings, color-coded by MSI score. Nearly every dot is red.
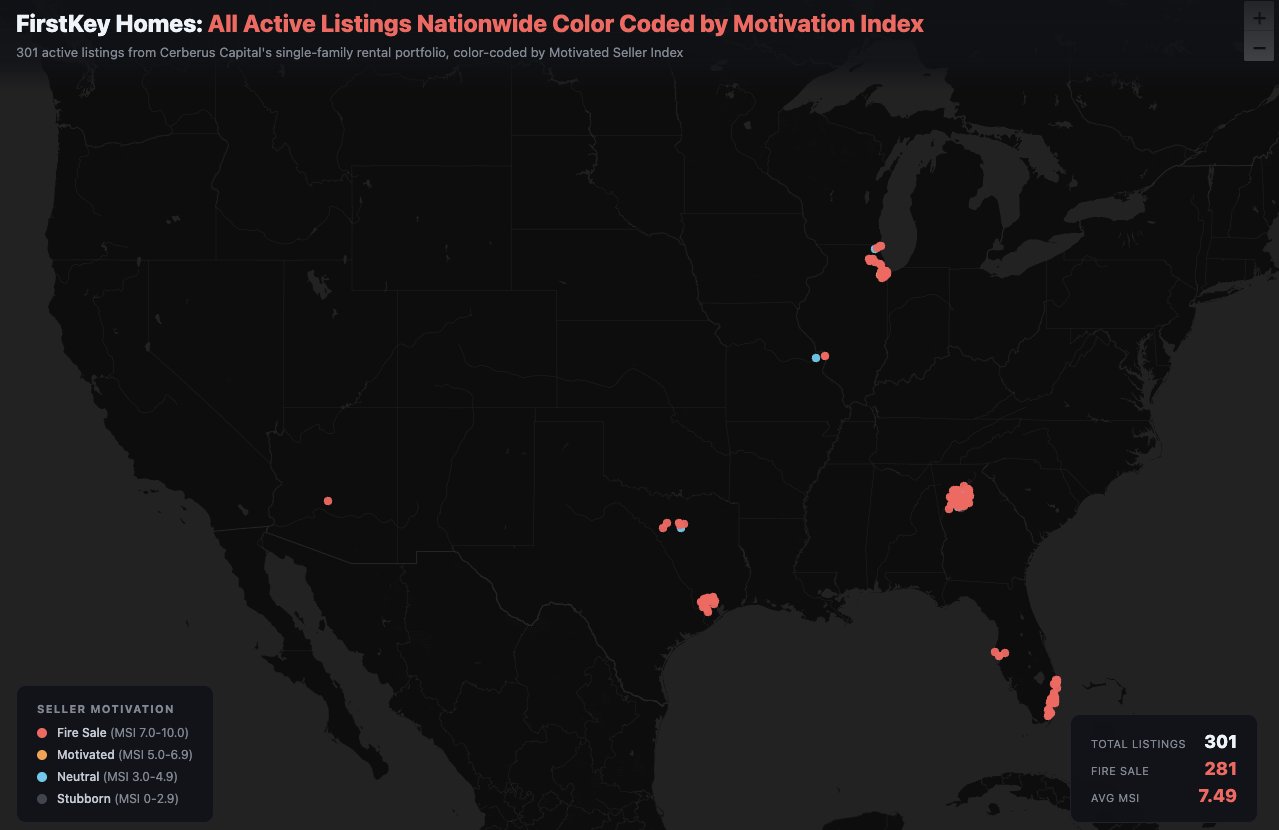
The headline metrics were covered in the table above. What the table doesn't show is the geographic concentration. Atlanta alone accounts for 131 of 301 listings (43.5%), with 97% classified as fire sale, averaging 262 days on market and 21.7% price reductions. Chicago follows with 61, Miami with 55, Houston with 34. Houston shows the deepest cuts: 21.8% average price reduction, 10.7 price cuts per listing.
FirstKey's property-level listing data makes the pattern concrete. 903 Blackhawk Drive, University Park, Illinois: listed at $329,000 in May 2025, now asking $210,000 after 15 price cuts over 292 days. Down 36%. 335 Oakwood Street, Park Forest: listed at $206,000, now $145,000 after 13 cuts. Down 30%. These are representative of FirstKey's for-sale strategy. The full scope of their listing activity, including the brokers handling each property, is available in Portfolio Hunter.
Takeaways
The analysis above captures how investors across the spectrum are reacting to the current regulatory climate. Here's what we're watching most closely.
The investor exit was underway before the executive order. Across 13 of the top 20 U.S. metros, investors are listing at more than 1.5 times their ownership share. Purchase activity has been declining since rates rose in 2022. The White House proposal targets a behavior the market has been pulling back on its own for years. Therefore, the policy may accelerate what’s already in motion.
The sell-off is concentrated where it could move local markets. Dallas, Atlanta, Houston, and Tampa show the highest listing skew, the deepest purchase-to-sale declines, and the most urgently priced inventory. These are also the metros where investors own the largest share of housing stock. When selling pressure concentrates in markets where investors hold a material share of supply, it has the potential to move local home prices for all sellers, not just institutional ones.
Most large operators are waiting it out. FirstKey is not. The biggest names in SFR (e.g., Invitation Homes, Progress Residential, AMH) are largely on the sidelines, with small for-sale counts relative to their portfolios and moderate urgency scores. The outlier is FirstKey Homes, whose 301 active listings, 95% highly motivated classification, and 19.8% average price reduction represent the most aggressive institutional selling activity in the data.
Motivated selling comes with real discounts. FirstKey’s average price reduction translates to tens of thousands of dollars per property. If the proposed ban or continued regulatory uncertainty pushes additional institutional inventory onto the market, those discounts could deepen - potentially benefiting individual homebuyers, which is the stated policy goal, while creating downward price pressure for existing homeowners and investors still holding.
Atlanta is the market to watch. Every metric in this analysis points there: highest investor ownership concentration, sharpest purchase-to-sale decline, top-three disposition market for every named operator. What plays out in Atlanta over the coming months will be an important signal for the rest of the country.
How to Track What Happens Next
The regulatory environment around institutional investors in housing is evolving quickly. The executive order is signed, draft legislation is circulating, and bipartisan support is building. Meanwhile, investor behavior is shifting in real time, and the gap between policy rhetoric and on-the-ground activity is only visible with the right data.
Parcl Labs is the infrastructure for tracking it. Our provide direct access to the ownership, transaction, and listing data behind this analysis. Our Institutional SFR Research tracks the largest players and their portfolio-level activity. And is the most powerful way to analyze, track, and connect with investor portfolios of any size across the country, with detailed analytics on performance, strategy, and the brokers executing each disposition.
The situation is moving fast. The data to follow it is here.
Methodology
Parcl Labs generated all data, analysis, and research cited in this article. Explore more at https://app.parcllabs.com/ or search institutional portfolios directly with Portfolio Hunter.
Listing-to-Ownership Ratio (Skew): Investor share of new for-sale listings (90-day rolling) divided by investor share of total housing stock. Values above 1.0x indicate investors are listing disproportionately more than their ownership share.
Purchase-to-Sale Ratio: 3-month rolling average of investor acquisitions divided by dispositions. Values below 1.0 indicate net selling.
Motivated Seller Index: Incorporates days on market, price cut frequency, price cut magnitude, and velocity of cuts to classify seller urgency on a continuous scale (0-10) and into four categories: fire sale (7.5-10), motivated (5-7.5), stubborn (2.5-5), and neutral (0-2.5). "Highly motivated" combines fire sale and motivated classifications.
Institutional Portfolio Map: All active for-sale listings from investor entities owning 100+ residential units, plotted at the property level and color-coded by individual MSI score. Covers 11,221 listings from 714 distinct portfolios across the top 20 U.S. metros.
Named SFR Operator Analysis: Six operators (FirstKey Homes, Invitation Homes, American Homes 4 Rent, Amherst, Progress Residential, Tricon Residential).
Markets Analyzed: The 20 largest U.S. metropolitan statistical areas by population: New York, Los Angeles, Chicago, Dallas-Fort Worth, Houston, Washington DC, Philadelphia, Atlanta, Miami, Phoenix, Boston, San Francisco, Riverside, Detroit, Seattle, Minneapolis, San Diego, Tampa, Denver, and St. Louis.

Follow Us for More