End of The Year 2025 Review: Too Much Supply and Not Enough Buyers
Dec 19, 2025 · 19 min read
End of The Year 2025 Review: Too Much Supply and Not Enough Buyers
Executive Summary
The defining feature of the U.S. housing market in 2025 was the broadening and intensification of supply-demand imbalances alongside an increasingly visible price correction, particularly toward the end of the year.
National home prices stalled over the course of the year, marking a relatively sharp deceleration versus 2024. Specifically, on a December-to-December basis, prices rose just 0.39% in 2025, down materially from 2.58% in 2024. This muted annual growth obscures a more notable deterioration beneath the surface. From September through November, national prices declined by 0.1%, signaling sustained monthly weakness. From peak levels, the market is now down 2.84%. Is is important to note that prices remain elevated at 42.79% above March 2020 levels, leaving more room to fall if market fundamentals don’t come into balance.
Supply-demand dynamics continued to deteriorate throughout the year. For-sale inventory increased 17% year over year while home sales fell 6%, producing a supply-demand gap of 23%. This imbalance is nearly triple the 8.5% gap observed one year earlier. Sellers responded accordingly, with price reductions becoming widespread. As of November 2025, 41% of active listings had experienced at least one price cut, up sharply from 26% the prior year, suggesting sellers are finally becoming more flexible to reach a clearing price.
Beneath these national aggregates, regional outcomes diverged meaningfully, with some markets absorbing the adjustment far more rapidly than others. We provide further regional detail below:
Florida’s Reversal: Florida experienced a clear about face in 2025 though the market started to stabilize in 2H. Eight of the state’s ten major metros recorded year-over-year price declines, with weakness concentrated in its largest and most supply-heavy markets. Earlier in the year, supply-demand gaps exceeded 40% in metros such as Tampa and Orlando, but conditions steadily improved into year end. Tampa’s gap compressed from 28% to 18%, while Miami and Jacksonville tightened to single-digit imbalances. Despite this moderation, sellers continued to face pressure. Price cuts remained elevated across the state, hovering between 48% and 50% of active listings as accumulated inventory worked through the system. Some positive exceptions emerged in the Florida panhandle, where Crestview posted 7.02% year-over-year price growth and Tallahassee rose 5.10%, bucking the broader statewide trend.
Texas Situation Worsens: All four major Texas metros posted negative year-over-year price performance in 2025, with Austin leading the nation in declines at -9.35% YoY. Price pressure intensified as supply-demand fundamentals deteriorated sharply throughout the year. Austin experienced one of the most severe shifts nationally, with its gap swinging from -22% to +51%, a 73 percentage point reversal. Dallas, Houston, and San Antonio followed similar paths, with all four major metros ending the year with gaps above +29%. Sellers responded with aggressive pricing adjustments, as price cuts reached 50% in both Austin and San Antonio, among the highest rates in the country.
Midwest Resilience Despite Supply Boom: The Midwest stood out for its pricing resilience even amid dramatic supply expansion. Eight of the nine largest Midwest markets maintained positive year-over-year price appreciation, led by Cleveland at +7.35% YoY, the strongest performance nationally. Minneapolis was the lone exception, posting a modest -0.1% decline. This price stability persisted despite a sharp reversal in supply-demand dynamics. Markets that were tightly constrained in 2024 saw rapid loosening in 2025. Detroit’s gap swung from -30% to +53%, while Chicago and Milwaukee shifted from negative to positive territory, signaling a meaningful but absorbed increase in supply.
Northeast Corridor Defies National Trends: The Northeast Corridor continued to outperform the national market. Four of five major metros posted year-over-year price appreciation above the national average of +0.39%. New York led the region at +5.72% YoY, followed by Philadelphia (+2.67%), Providence (+2.36%), and Boston (+1.07%). Washington DC was the sole exception, declining -0.58%. Supply-demand conditions remained comparatively tight, with gaps ranging from just +1% in Hartford to +17% in Boston, all well below the national benchmark of +23%. While gaps expanded modestly from 2024, averaging a 9 percentage point increase across the region, markets like New York (+14%) and Philadelphia (+13%) retained relative balance. Price cuts reinforced this strength, with Hartford (24%) and New York (27%) recording the lowest rates nationally, 15 to 17 percentage points below the national average of 41%.
West Coast Stability Persists: West Coast markets showed mixed price trends in 2025, with modest appreciation across California’s core metros and declines in parts of the Pacific Northwest. Supply-demand conditions remained relatively stable across the region. Major West Coast markets avoided the severe imbalances seen elsewhere, even as gaps expanded modestly. San Francisco (+7%) and Los Angeles (+14%) maintained gaps well below the national level, while price cuts in these metros ran 9 to 11 percentage points below the national average. Structural supply constraints across coastal California continued to support pricing power even as inventory levels increased.
Growth Slows Nationally With Pockets of Resilience
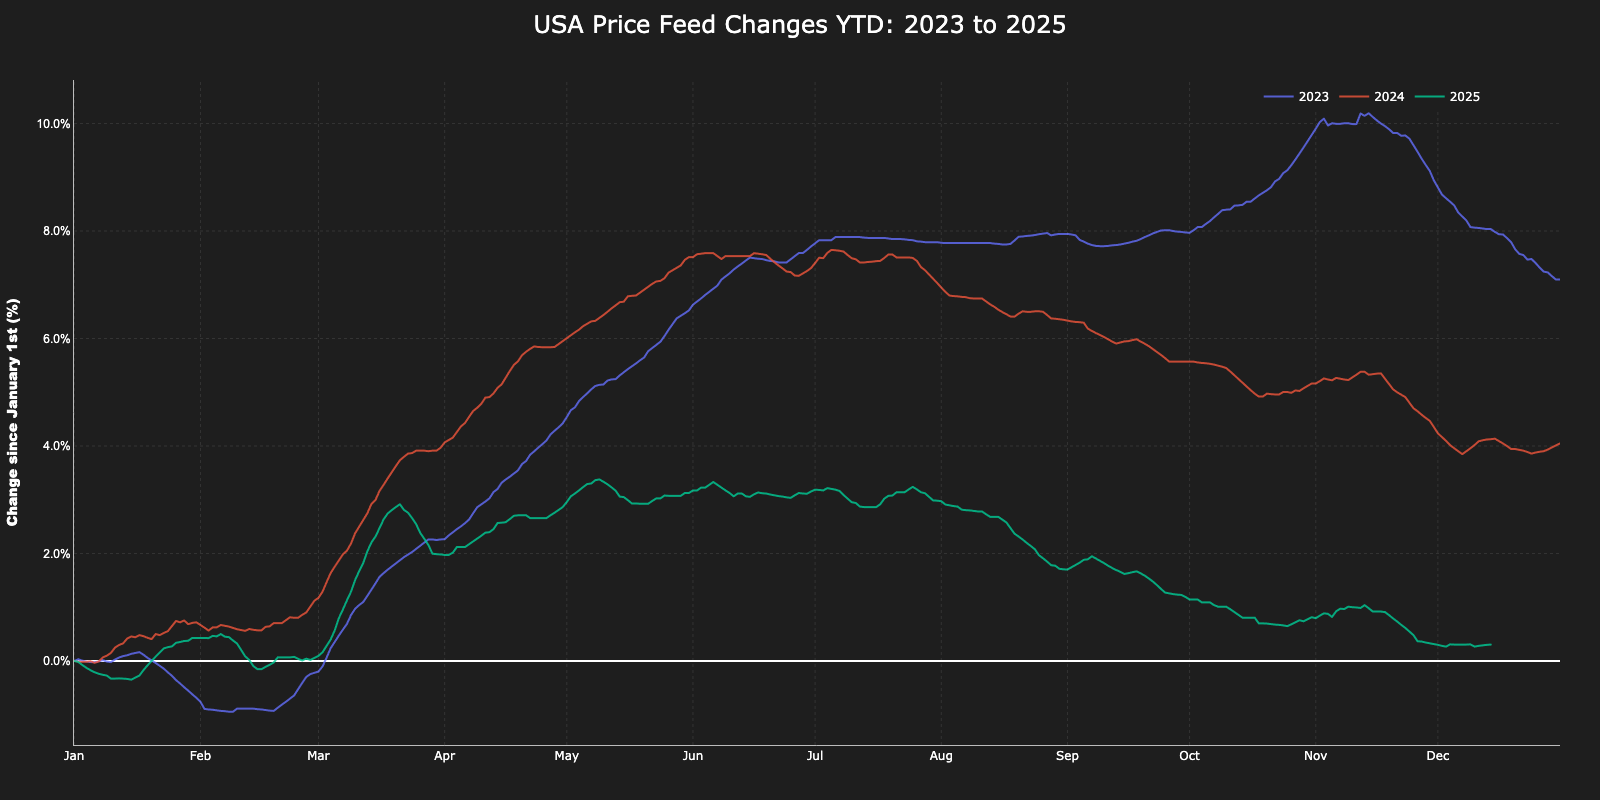
U.S. home prices effectively hovered near flat in 2025, reflecting a sharp deceleration from the prior year. On a December-to-December basis, national prices rose a modest 0.39%, down materially from 2024’s 2.58% pace, with year-to-date growth similarly muted at 0.32%.
This subdued annual performance masks increasing volatility late in the year. Prices fell 0.47% from November to December alone, following two consecutive monthly declines from September through November that collectively erased 0.1% in value. From its historical peak, the national market has now retreated 2.84%, though prices remain elevated at 42.79% above March 2020 levels.
Together, this stagnation and recent downturn mark a potential inflection point. After years of rapid appreciation, the housing market is increasingly constrained by affordability pressures and, in select regions, accumulating oversupply that is beginning to assert downward pressure on prices.
Figure 1. Parcl USA Aggregate Price Feed
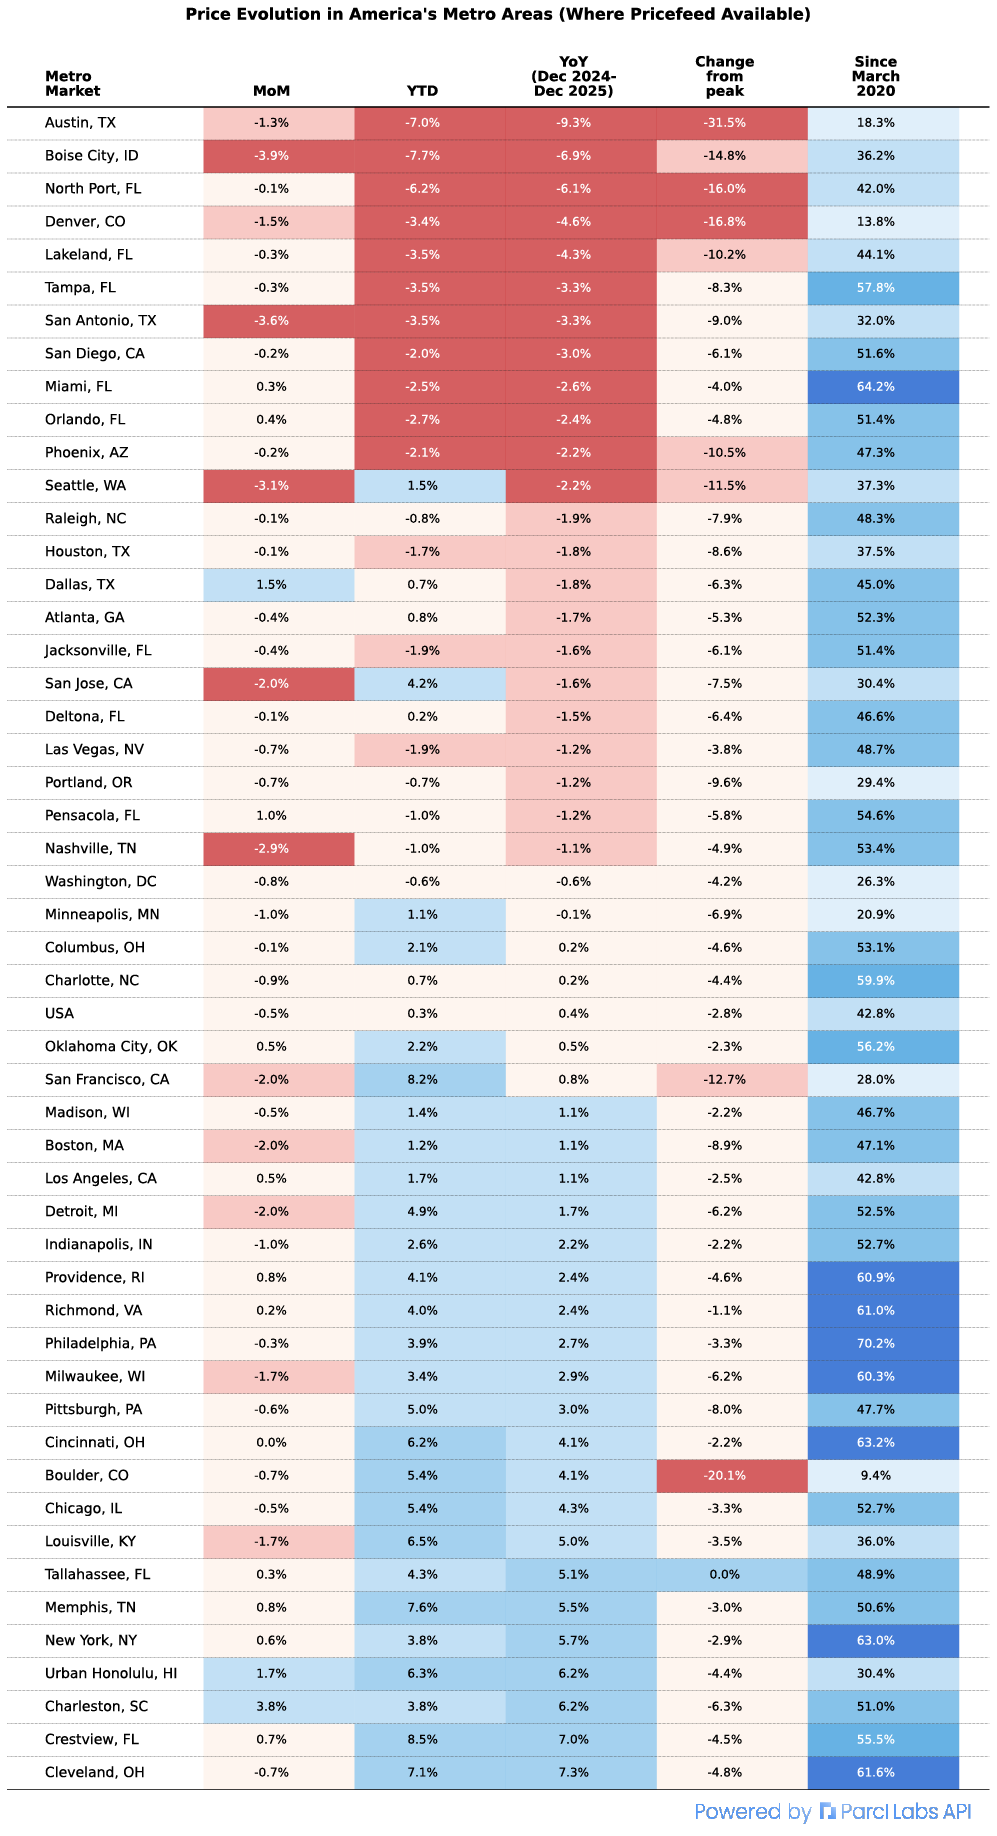
Northeast and Midwest markets emerged as the nation’s strongest price performers in 2025. New York led major Northeast metros with robust 5.72% year-over-year growth, while the Midwest demonstrated exceptional breadth of strength. Cleveland topped all markets nationally at +7.35% YoY, joined by Chicago (+4.26%), Cincinnati (+4.12%), Milwaukee (+2.92%), Indianapolis (+2.20%), and Detroit (+1.65%), all posting gains well above the national average.
The Northeast showed consistent outperformance across its core hubs. New York (+5.72% YoY), Philadelphia (+2.67%), and Providence (+2.36%) all significantly exceeded the national benchmark. Washington DC and Minneapolis were the primary exceptions, posting modest price declines of -0.5% and -0.1%, respectively.
Select markets outside the major regions also delivered strong results. Florida (despite severe turmoil in 2024 and 2025) still produced two standouts in 2025: Crestview (+7.02%) and Tallahassee (+5.10%) in annual growth. Elsewhere, Urban Honolulu recorded 6.19% year-over-year appreciation. Across the South, Charleston (+6.20%), Memphis (+5.54%), and Louisville (+4.98%) also posted solid gains.
In contrast, former pandemic-era boomtowns experienced the sharpest price corrections in 2025. Austin led the nation in declines, falling 9.35% year over year and 31.49% from its historical peak. Even after this correction, Austin home prices remain approximately 18% above pre-pandemic levels, well below the national average cumulative gain since early 2020 of 43%.
Other markets that saw outsized pandemic appreciation also faced significant pullbacks. Boise declined 6.85% year over year and 14.78% from peak levels, North Port fell 6.14% YoY and 16.04% from peak, and Denver dropped 4.59% YoY and 16.76% from peak. While these markets retain some appreciation since March 2020, they continue to undergo prolonged adjustments as supply-demand imbalances unwind and speculative demand fades.
Weakness in 2025 was concentrated in the West and in parts of the Sun Belt. Nine of the ten weakest year-over-year performers were in Florida, Texas, or the Mountain West (with San Diego the lone exception), and together they averaged a 4.6% decline.
California’s big metros were mixed. Los Angeles (+1.12% YoY) and San Francisco (+0.79% YoY) posted modest gains, while San Diego fell 3.01%. The Pacific Northwest also softened, with Seattle (-2.2% YoY) and Portland (-1.2% YoY) recording small contractions. Texas, by contrast, was uniformly weak: all four major metros posted negative annual price changes.
Regional divergence reached historically wide levels in 2025. The spread between the strongest market, Cleveland at +7.35% YoY, and the weakest, Austin at -9.35% YoY, exceeded 16 percentage points, underscoring how localized housing market dynamics have become.
Figure 2.
Supply Growth Intensifies Nationwide as Demand Softens
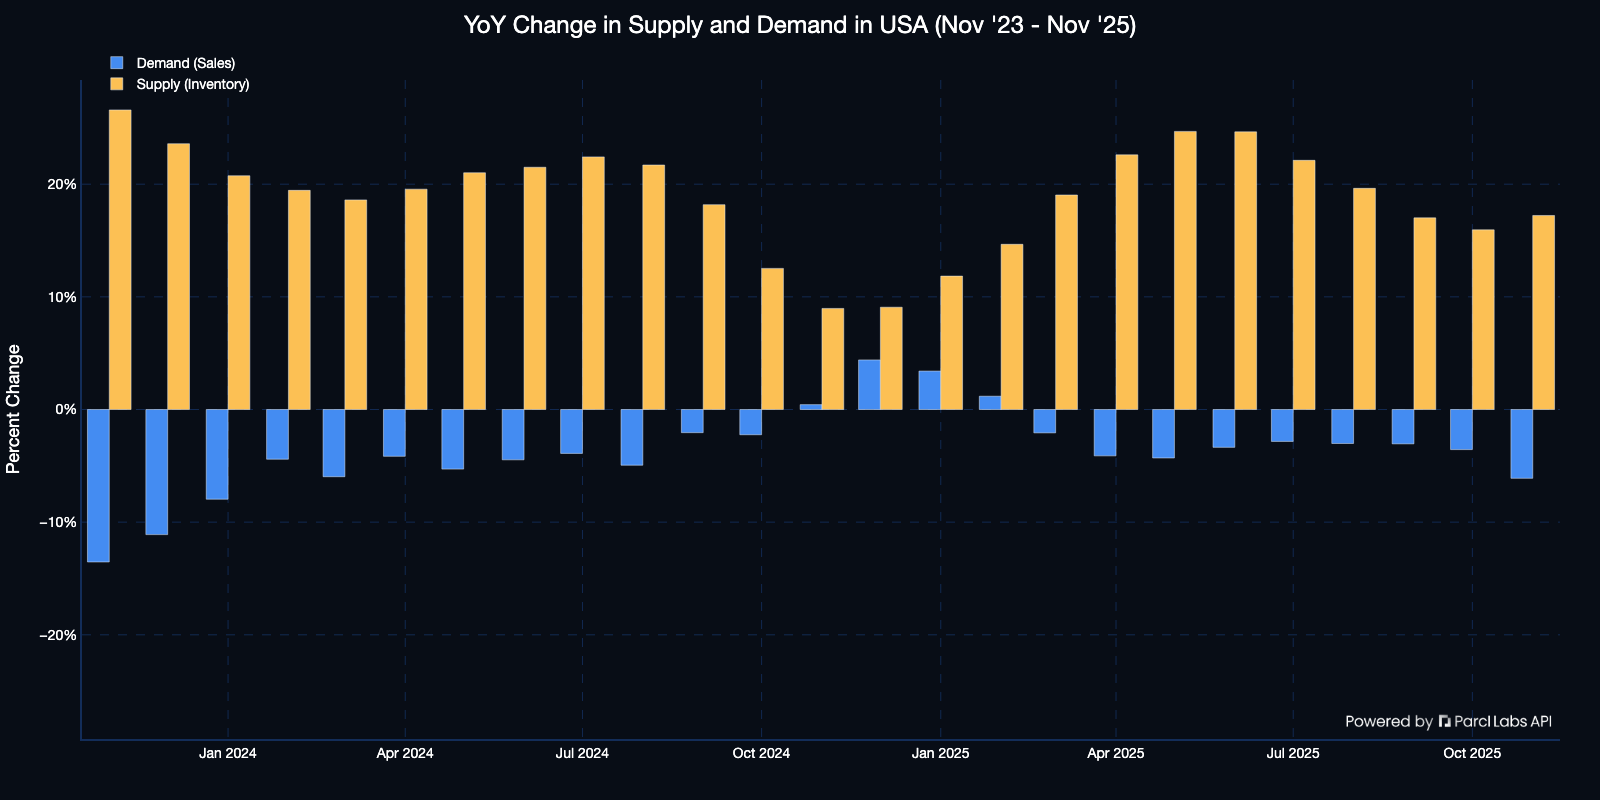
Price corrections in 2025 were accompanied by a pronounced increase in for-sale housing supply. By year end, listings across the U.S. rose 17% year over year, nearly double the pace recorded one year earlier. Demand moved in the opposite direction, with home sales declining 6% over the same period. These two dynamics working in opposite direction is the fundamental driver behind aggregate market weakness.
This divergence produced a national supply-demand gap of approximately 23%, up sharply from 8.5% the prior year and representing a nearly threefold expansion with respect to the imbalance. In practical terms, far more sellers were competing for a smaller pool of buyers than in 2024.
The progression of the gap over the course of 2025 underscores this shift. Supply-demand imbalances peaked near 29% in May before gradually moderating to roughly 23% by November. Even with this late-year easing, conditions remained meaningfully looser than historical norms, reinforcing the broader cooling trend across the housing market.
Figure 3: National Supply / Demand Dynamics
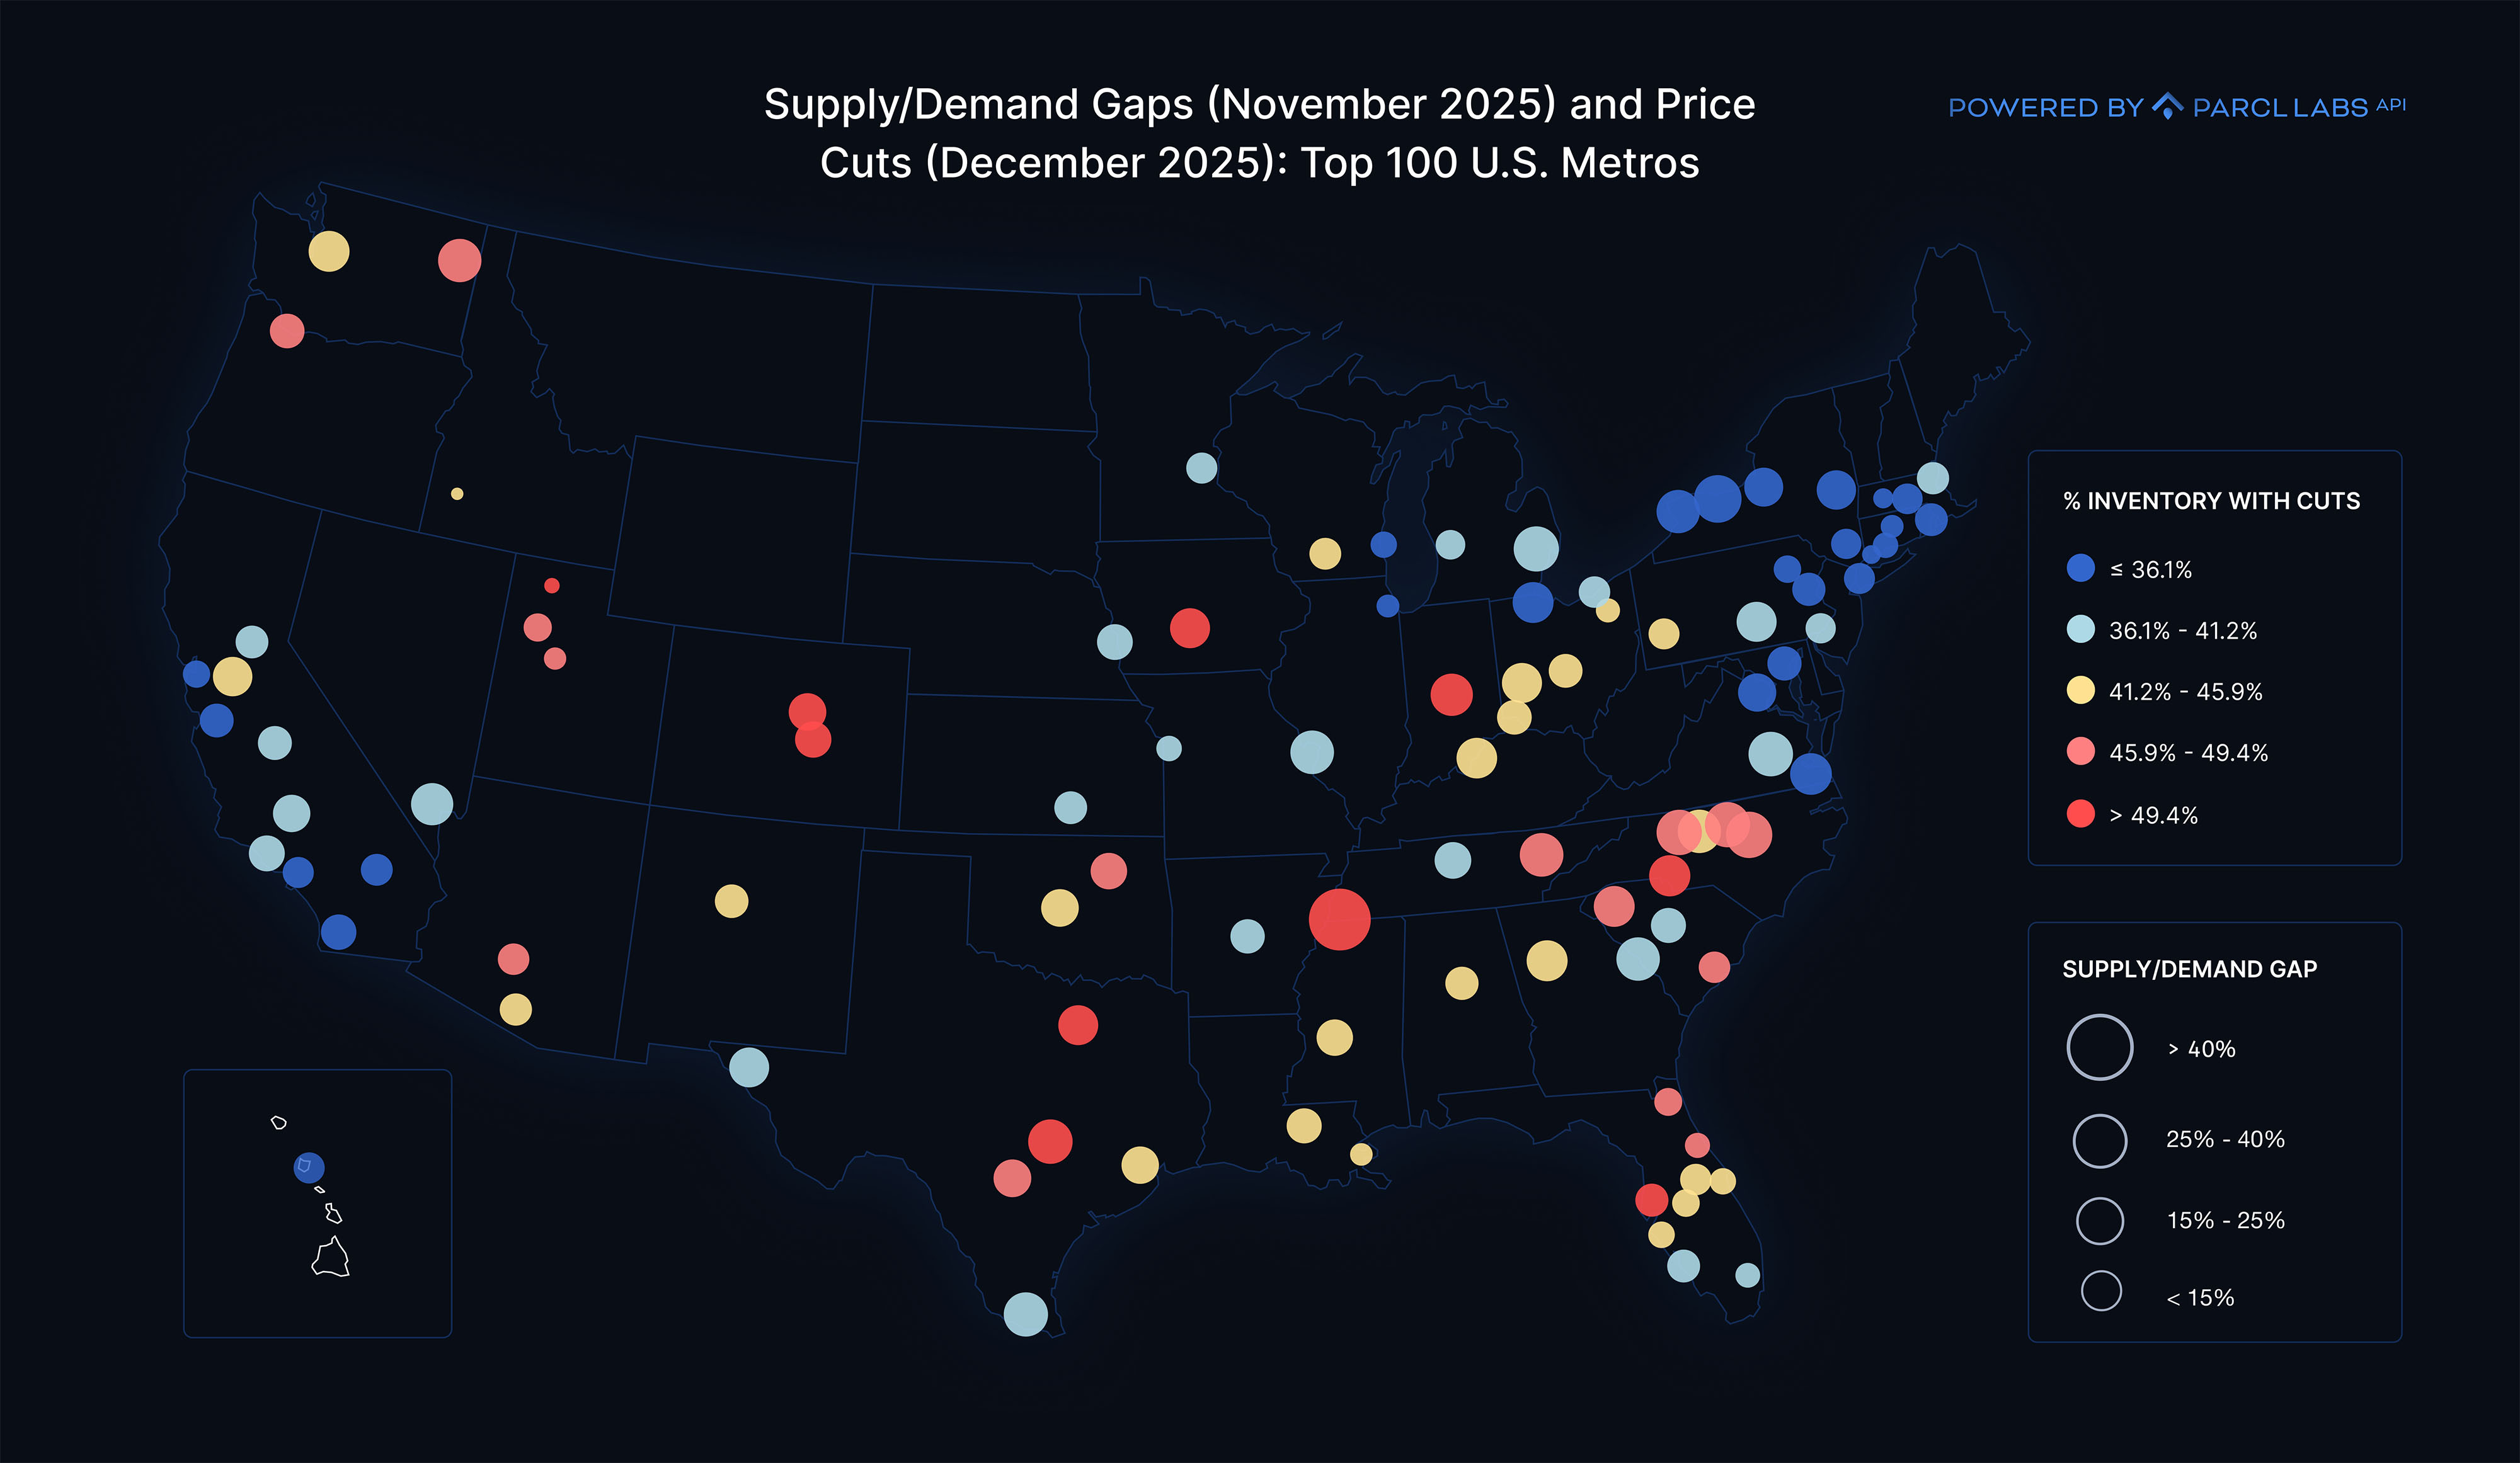
Market-level supply-demand data reinforces this narrative. Among the top 100 U.S. housing markets, 96 registered positive supply-demand gaps in November 2025, with 45 markets exceeding the national benchmark of +23%. Only four markets, Boise, Ogden, Bridgeport, and Springfield, recorded negative gaps consistent with seller-favorable conditions. The median market gap stood at +21%, closely tracking the national figure and signaling that imbalances are broad-based rather than isolated to a handful of metros.
Seller behavior further confirms these conditions. Price cut activity has accelerated materially as supply has outpaced demand. As of November 2025, 41% of active for-sale inventory nationally had experienced at least one price reduction, up from 26% at the same time last year. This represents a 59% increase in the prevalence of price cuts. The breadth of these adjustments mirrors the supply-demand landscape, with 44 of the top 100 markets exceeding the national average.
Taken together, the combination of widespread supply-demand gaps and rising price reductions suggests sellers are increasingly recalibrating expectations to align with current market realities - finally. While these national figures describe the overall direction of the market, they mask meaningful regional variation in both imbalances and seller responses.
In the sections that follow, we examine how these dynamics are playing out across regions as the market moves into 2026.
Figure 4. Supply / Demand Heat Map
Southeast’s Mixed Picture: Florida Moderates While Interior Markets Expand
The Southeast followed two divergent paths in 2025. Florida’s major metros, which dominated distress headlines earlier in the year, showed meaningful stabilization by year end. In contrast, interior growth markets such as Atlanta and Charlotte experienced rapid supply-demand deterioration, placing them among the most challenged markets nationally. Note that Atlanta is the largest institutional SFR market.
After severe mid-year stress, Florida’s largest metros demonstrated clear rebalancing. Tampa’s supply-demand gap compressed from +28% in November 2024 to +18% by November 2025, after peaking near +40% in May. Orlando followed an even sharper arc, expanding from +31% a year ago to +46% in April before moderating to +15% by year end. Jacksonville showed the most pronounced improvement, narrowing from +30% to just +8%. Miami reached the tightest conditions in the state at +4%, near balanced territory and a roughly 30 percentage point improvement year over year.
The mechanics behind Florida’s rebalancing point to improving demand alongside still-elevated supply. In Tampa, demand turned positive by November at +5% YoY, while supply growth remained strong at +23%, suggesting renewed buyer activity absorbing accumulated inventory.
Despite these improvements, seller behavior in Florida remains defensive. Price cuts averaged 48% across the state’s three major metros, running 7 to 9 percentage points above the national benchmark. Nearly half of all listings in Jacksonville (48%), Orlando (48%), and Tampa (51%) carried price reductions. This persistence of elevated price cuts, even as supply-demand gaps compress, suggests sellers are prioritizing inventory clearance before conditions potentially soften again.
Outside Florida, the Southeast’s interior markets moved in the opposite direction. Atlanta’s gap nearly doubled from +20% to +39%, driven primarily by a sharp demand reversal from +2% to -23% YoY that overwhelmed steady inventory growth. Charlotte followed a similar trajectory, expanding from +19% to +40% as demand fell 16%. Nashville’s gap more than doubled to +27%, though it remained less severe than Atlanta and Charlotte.
Seller behavior reflects mounting pressure in these markets. Charlotte leads the region with 50% of inventory showing price reductions, placing it alongside Austin and Denver among the highest nationally and roughly 8 percentage points above the U.S. average. Atlanta shows more moderate adjustment, with 41% of listings discounted, while Nashville sits slightly below the national benchmark at 38%.
Overall, the Southeast shows a clear bifurcation. Florida’s coastal markets are finding equilibrium through price discovery and demand stabilization, while interior high-growth metros are now absorbing the affordability constraints and inventory surpluses Florida faced a year earlier. The key question heading into 2026 is whether Atlanta and Charlotte follow Florida’s moderating path, or whether weakening demand signals a deeper correction ahead.
Texas Experiences Severe Market Deterioration
Texas emerged as the most severe negative outlier of 2025. All four major metros experienced sharp supply-demand deterioration, placing the state among the nation’s most imbalanced housing markets.
Austin exemplified this reversal. Entering 2025 with a -22% gap, indicating a strong sellers market, Austin unraveled rapidly over the year, reaching a +51% gap by November. This represents a staggering 73 percentage point swing. The deterioration was driven by a collapse in demand of -33% YoY alongside continued supply growth of +18% as new construction deliveries came online. The result was one of the most pronounced buyers markets in the country.
Dallas and Houston followed similar but less extreme paths. Dallas’s gap expanded from +17% to +36%, as demand fell 19% against 17% supply growth. Houston’s shift was notable given its relatively balanced starting point. From a +5% gap in November 2024, Houston widened to +29% by year end, with supply rising 24% while demand declined 5%. San Antonio rounded out the picture, expanding from +7% to +30%.
Seller behavior confirms the severity of these imbalances. Price cuts across Texas are running roughly 9 percentage points above the national average. San Antonio (50%), Austin (51%), and Dallas (50%) all rank among the top ten markets nationally for price reductions, while Houston also shows elevated discounting at 43%.
What distinguishes Texas from other challenged regions is the persistence of pressure. Unlike Florida, where supply growth has begun to moderate and demand has stabilized, Texas markets continue to add inventory into weakening demand and falling prices. This combination of widening gaps, elevated price cuts, ongoing supply growth, and price depreciation makes Texas the most concerning regional market heading into 2026.
West and Mountain West: Interior Volatility Gives Way to Coastal Stability
The West and Mountain West displayed a familiar split in 2025. Interior markets experienced sharp volatility and rapid reversals, while coastal metros transitioned more gradually into modest oversupply.
Denver exemplified the interior market pattern. After surging to a +69% supply-demand gap in April, one of the highest nationally, conditions moderated by year end, with the gap compressing to +30%. Despite this improvement, seller behavior remains strained. Denver leads the nation in price reductions, with 52% of inventory discounted, 11 percentage points above the national average, signaling persistent seller urgency.
Boise’s trajectory was even more striking. Entering 2025 with a -16% gap, indicating a strong sellers market, Boise expanded to +9% by May before reversing sharply to -5% by November, returning to sellers market conditions. This rebalancing was driven by demand accelerating 19% year over year while supply growth slowed to 14%, allowing the market to absorb excess inventory. Even so, 40% of listings still carry price cuts, suggesting caution among sellers despite favorable fundamentals.
Phoenix and Las Vegas (two large institutional SFR markets) showed more sustained stress. Phoenix’s gap fluctuated between +10% and +36% before settling at +15% by year end. Las Vegas deteriorated further, expanding from +17% to +43%. The imbalance in Las Vegas was driven by a dual shock, with demand falling 11% while supply surged 32%, creating one of the most severe buyer-favored conditions in the West.
Along the coast, adjustments were more measured. San Francisco’s gap widened from -5% to +7% as demand slipped 3% and supply rose 4%. Los Angeles expanded modestly from +11% to +14%, with demand down 5% and supply up 9%. San Diego remained relatively stable at +24%, maintaining a moderate oversupply position.
The Pacific Northwest diverged from California’s stability. Seattle experienced one of the sharpest deteriorations on the coast, shifting from a -9% sellers market to a +39% buyers market as supply surged 32% and demand fell 7%. Portland followed a similar path, reversing from -3% to +22% with supply rising 18% against a 4% demand decline.
Price cutting behavior reinforces this divide. California’s major metros maintained price cut rates 9 to 11 percentage points below the national average throughout 2025, indicating more disciplined seller responses. San Francisco (31%) and Los Angeles (32%) rank among the lowest nationally. In contrast, Seattle’s price cut rate rose to 44%, exceeding the U.S. benchmark and reflecting growing seller pressure.
Northeast Shows Resilience
The Northeast emerged as one of the most stable regions in 2025, even as supply-demand gaps widened modestly. While supply growth outpaced demand across the region, major metros maintained some of the tightest conditions nationally.
Boston and New York demonstrated their characteristic resilience. Boston’s gap widened from +6% to +17%, never exceeding that level throughout the year and remaining well below national stress thresholds. New York followed a similar pattern, expanding from +5% to +14% after a brief mid-year peak at +24% that quickly moderated. Both markets benefited from relatively modest demand declines, Boston at -6% and New York at -2%, combined with supply growth in the low teens.
Washington DC diverged somewhat from its regional peers. Near-flat demand growth of 0.1% alongside a 31% surge in supply produced a +31% gap, exceeding the national benchmark by 8 percentage points. Despite this imbalance, price cuts remained restrained at 34%, suggesting sellers maintained greater pricing discipline than the gap alone would imply.
Philadelphia traced a more dynamic adjustment path. The market shifted from a -3% sellers market to a mid-year peak of +18%, before settling at +13% by year end. Hartford stood out for its stability, expanding just three percentage points from -1% to +1%, maintaining near-perfect equilibrium throughout the year.
Rochester represented the region’s primary outlier. Its gap exploded from -15% to +62%, driven by a 54% surge in supply against an 8% decline in demand. This extreme move appears tied to market-specific factors rather than broader regional dynamics.
Seller behavior across the Northeast confirms this relative stability. Hartford (24%) and New York (27%) posted among the lowest price cut rates nationally, running 14 to 17 percentage points below the U.S. average. Boston (33%) and Philadelphia (35%) also showed limited discounting compared to the national rate of 41%.
Despite persistent affordability challenges, the Northeast continues to operate closer to historical norms. Structural supply constraints, regulatory friction, and stable employment bases have limited volatility and insulated the region from the sharper swings seen in high-growth Sun Belt markets. Absent a major economic shock, this relative stability appears likely to persist into 2026.
Midwest Experiences Supply Boom
One of the report’s most surprising findings came from the Midwest. After defying national trends in 2024 by maintaining some of the tightest sellers market conditions in the country, the region underwent a dramatic shift in 2025. Most major Midwest markets moved from supply deficits to pronounced surpluses, marking a broad-based rebalancing.
Detroit exemplified this reversal. Entering November 2024 with a -30% supply-demand gap, the tightest market nationally, Detroit expanded to +53% by November 2025, an 83 percentage point swing. The mechanics reflect a sharp demand reversal alongside a surge in new supply. Demand shifted from +3% growth to a -23% decline, while supply moved from a -27% contraction to a +31% expansion. This combination produced one of the most severe market deteriorations observed nationwide in 2025.
Chicago and Cleveland followed similar, though less extreme, paths. Chicago transitioned from a -8% gap to +1%, moving from a sellers market to near balance. Cleveland widened from -13% to +15%, a 28 percentage point expansion driven by moderating demand and normalized supply growth. Milwaukee and Minneapolis traced comparable arcs, with Milwaukee moving from -4% to +6% and Minneapolis from -7% to +14%. Columbus remained comparatively stable, expanding from -2% to roughly +20%, a notable shift but less severe than many regional peers.
Seller behavior reflects this changing landscape. Chicago (30%) and Milwaukee (33%) maintained price cut rates below the national average, consistent with their more modest gap expansions. In contrast, Detroit (36%) and Columbus (44%) showed elevated discounting as sellers responded to growing imbalances. Minneapolis, at 37%, sits near the national benchmark, indicating moderate pressure.
Overall, the Midwest’s 2025 experience appears to be a case of mean reversion. Markets that were exceptionally tight in 2024 normalized rapidly, with some overshooting into buyers market territory. The key question heading into 2026 is whether this shift represents a one-time adjustment back toward equilibrium, or the early stages of a more sustained correction as the region’s industrial base navigates broader economic uncertainty. Unlike 2024, when tight conditions supported price appreciation, the expanded gaps of 2025 point toward slower price growth ahead and, in Detroit’s case, the potential for continued price pressure if current imbalances persist.
For ongoing analysis throughout the year, these metrics are available in real-time through the Parcl Labs API.


Follow Us for More