Mid-Size SFR Portfolios Are Most Active in New Construction
Nov 17, 2025 · 3 min read
An Analysis of New Construction Within SFR Portfolios

New construction continues to be a hot topic within the SFR community; as such, we used our advanced Portfolio Ownership Mapping to analyze the dispersion of new construction across the SFR landscape.
Parcl tracks over 1.2 million SFR Portfolios - including entity ownership mapping, current holdings and daily updates on all transaction activity.
Our data shows that only 1 in 5 SFR operators (of all sizes) own a single new construction property.
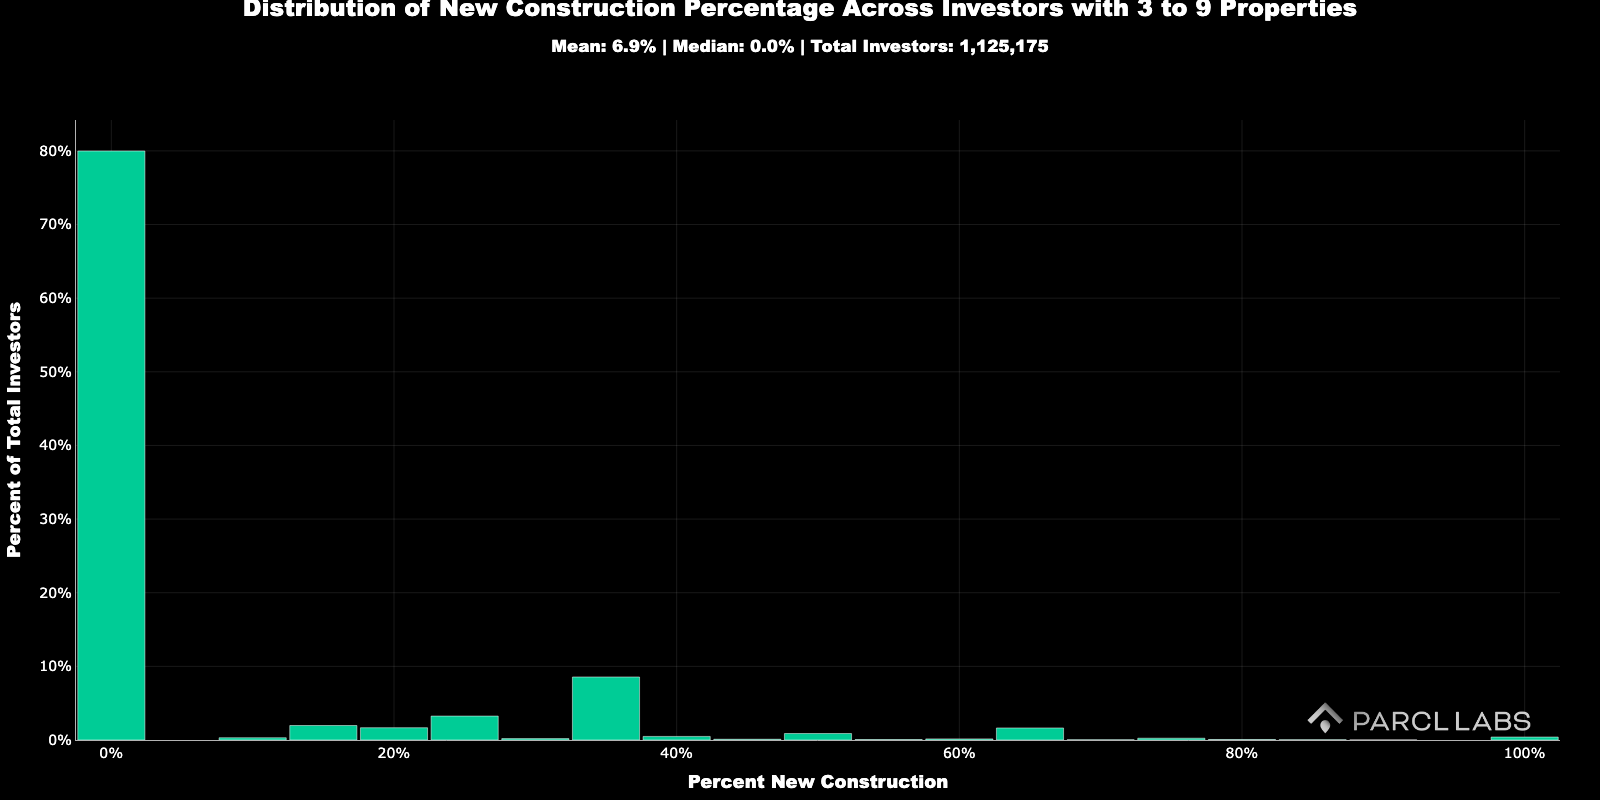
Mom-and-pop owners (3–9 homes): 20% have new-construction properties - the vast majority are playing exclusively in older stock.
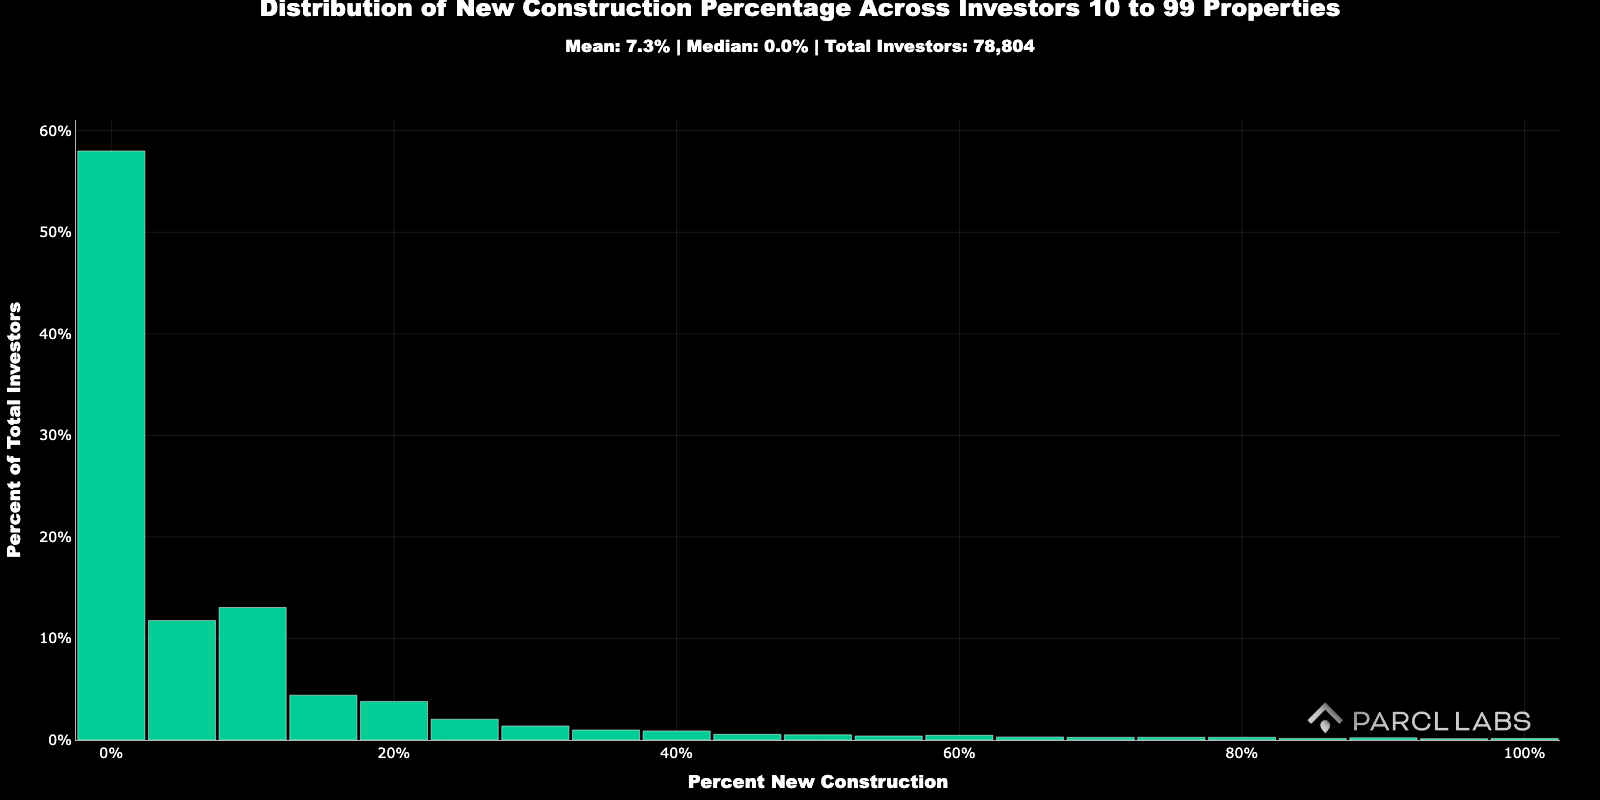
Mid-size regional operators (10–99 homes):
Across all portfolios in this band, new construction is 7.3% of properties. 56% have none.
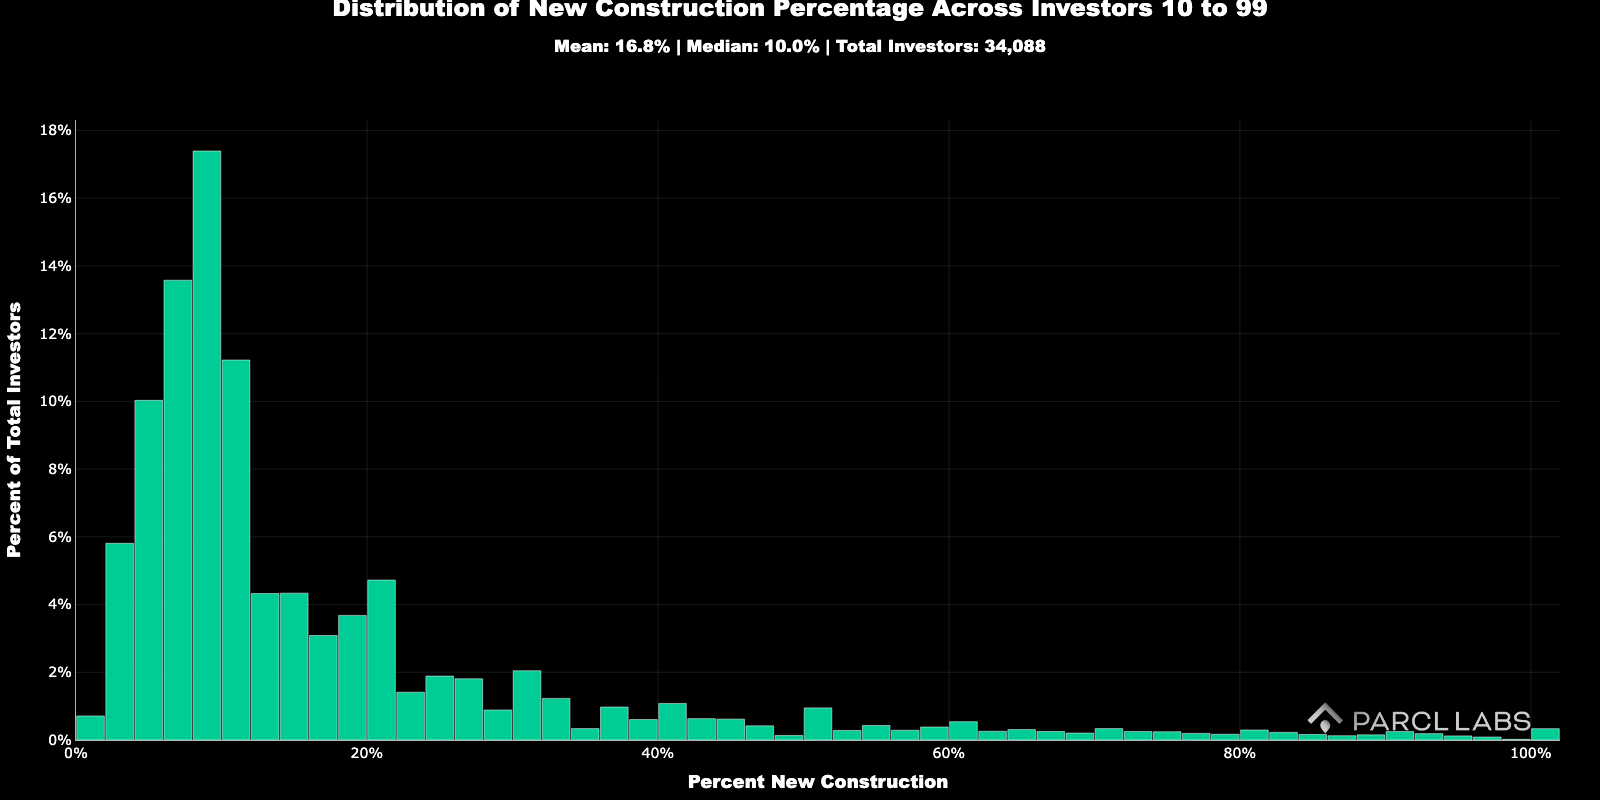
However, for the portfolios that do own at least one new build, roughly 16% of their homes are new construction.
Large operators (100–999 homes): More than half of these portfolios include at least one new build, yet new construction averages just 10% of holdings. Among large portfolios that do have new builds, they still only represent about 4% of the properties—a nominal allocation.
The most aggressive new-construction bet isn’t coming from the biggest players—it’s coming from mid-size operators. Smaller portfolios appear to have the flexibility and capacity to specialize in this segment.
Despite higher upfront costs, rental rates for new construction can command a premium. Given the housing affordability crisis, we are seeing an increased appetite to rent and believe new construction is very well positioned to capture this trend versus older stock as they typically are higher quality, require less maintenance, and provide better exit liquidity.
Using Parcl's proprietary Portfolio Ownership Mapping, you can target portfolios with or without new construction to serve your acquisition or lead generation needs. The waitlist goes live December 1, 2025.
Below, we visualize the new construction distribution in aggregate and by portfolio size brackets.
Of the 1.2M SFR Portfolios, 79% do not hold new construction within their portfolios, meaning only 1 in 5 portfolios have at least one new construction property.
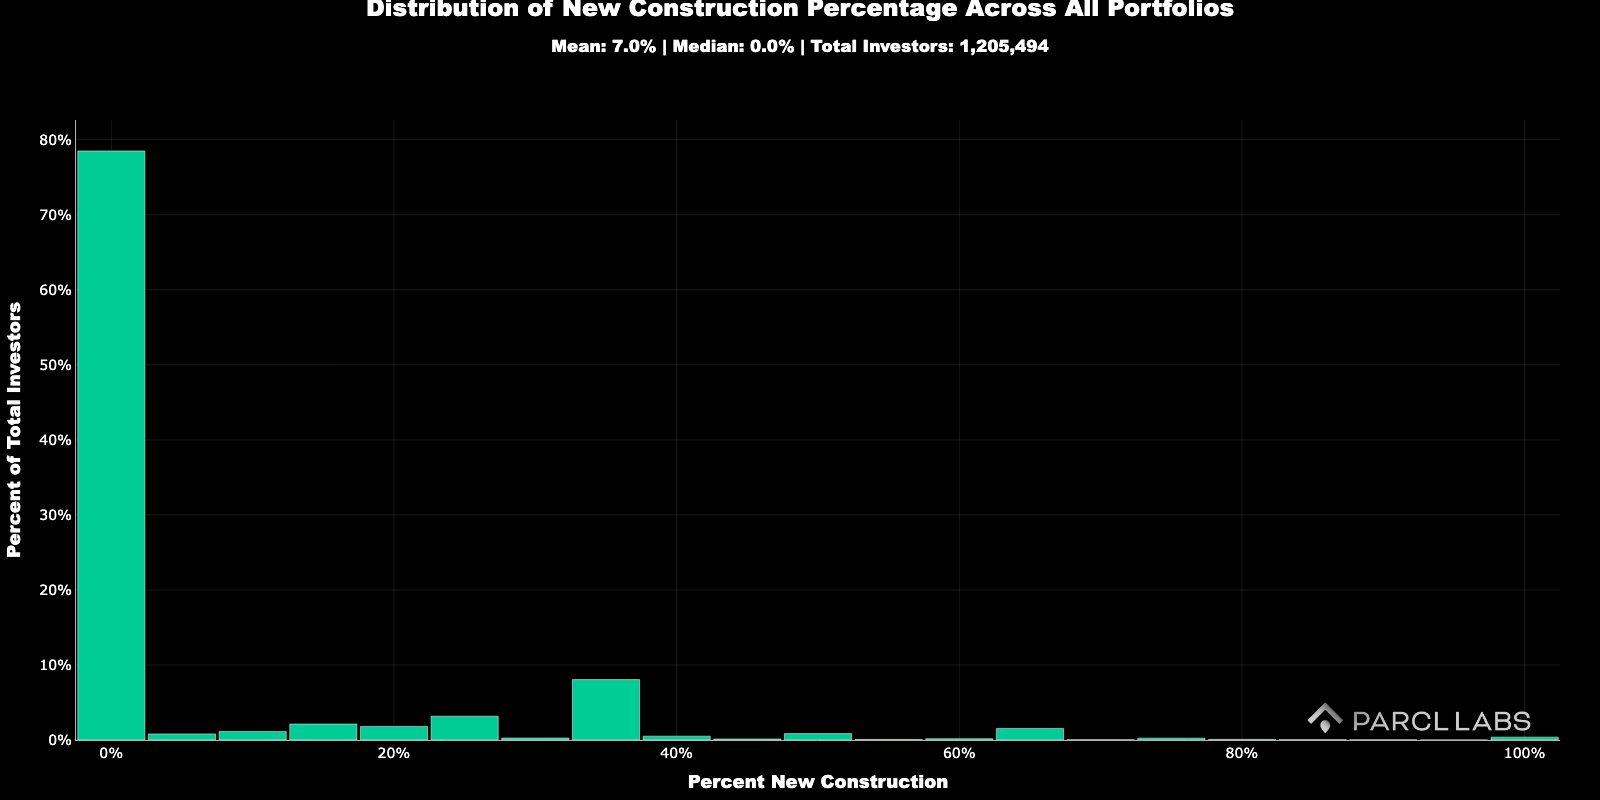
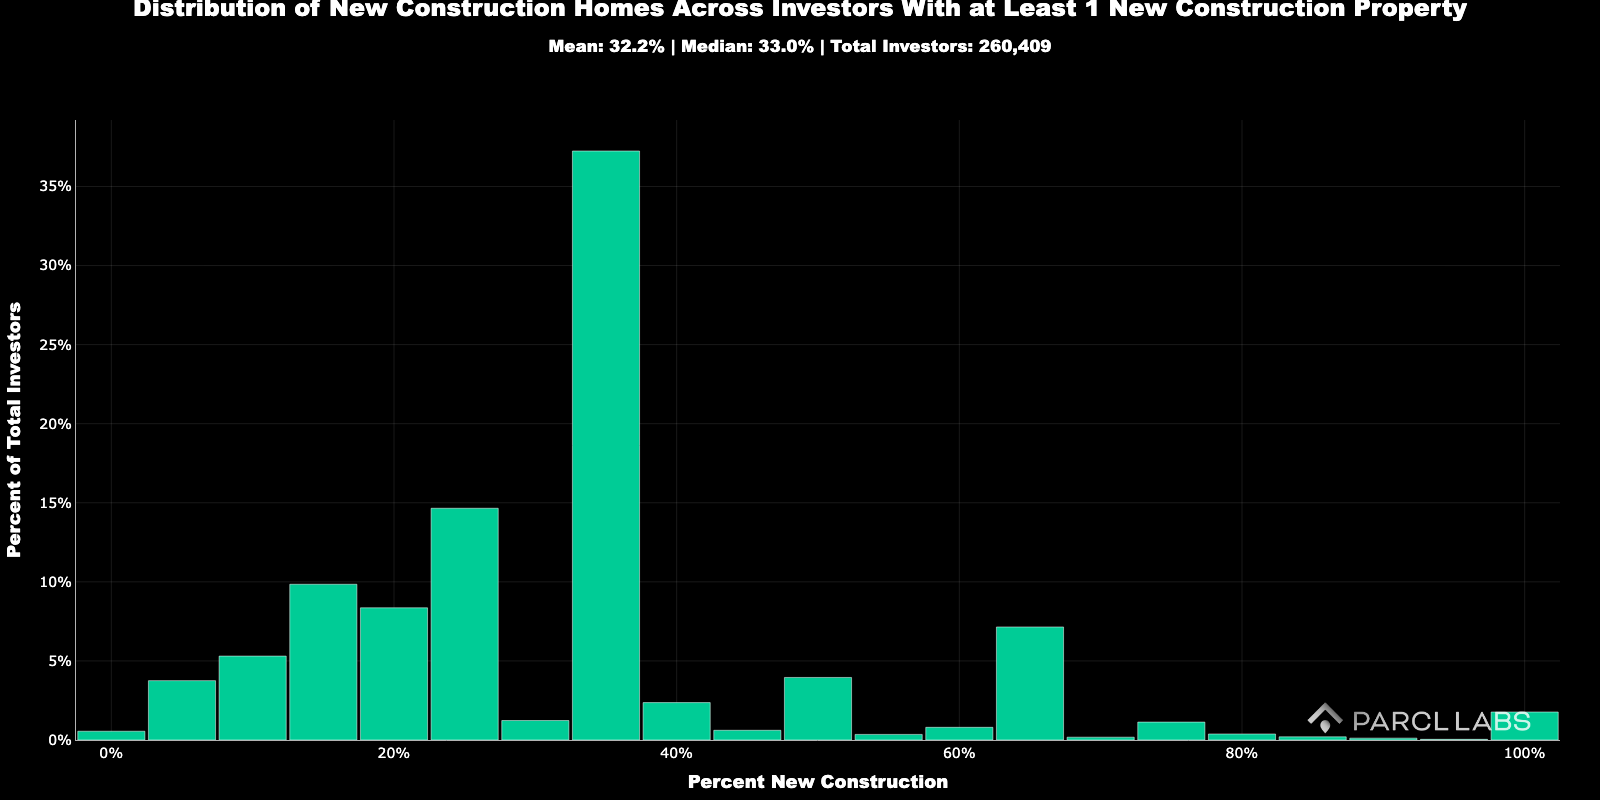
Looking at the universe of portfolios where at least one property is labeled as new construction we see that about 1/3 of the properties in those portfolios are new construction. 260k of all portfolios fall in this definition.
Controlling for size, we see that only 1 in 5 mom and pop operators (defined as 3 to 9 properties in their portfolios) hold at least one new construction single family home.
Looking at medium size operators, 10 to 99, the mean goes up to 7.3%, but 56% of these portfolios don’t have any new construction in their portfolios.
For larger operators, 100 to 999 properties, more than half of all portfolios have at least 1 property that is new construction, with 10% being the average.
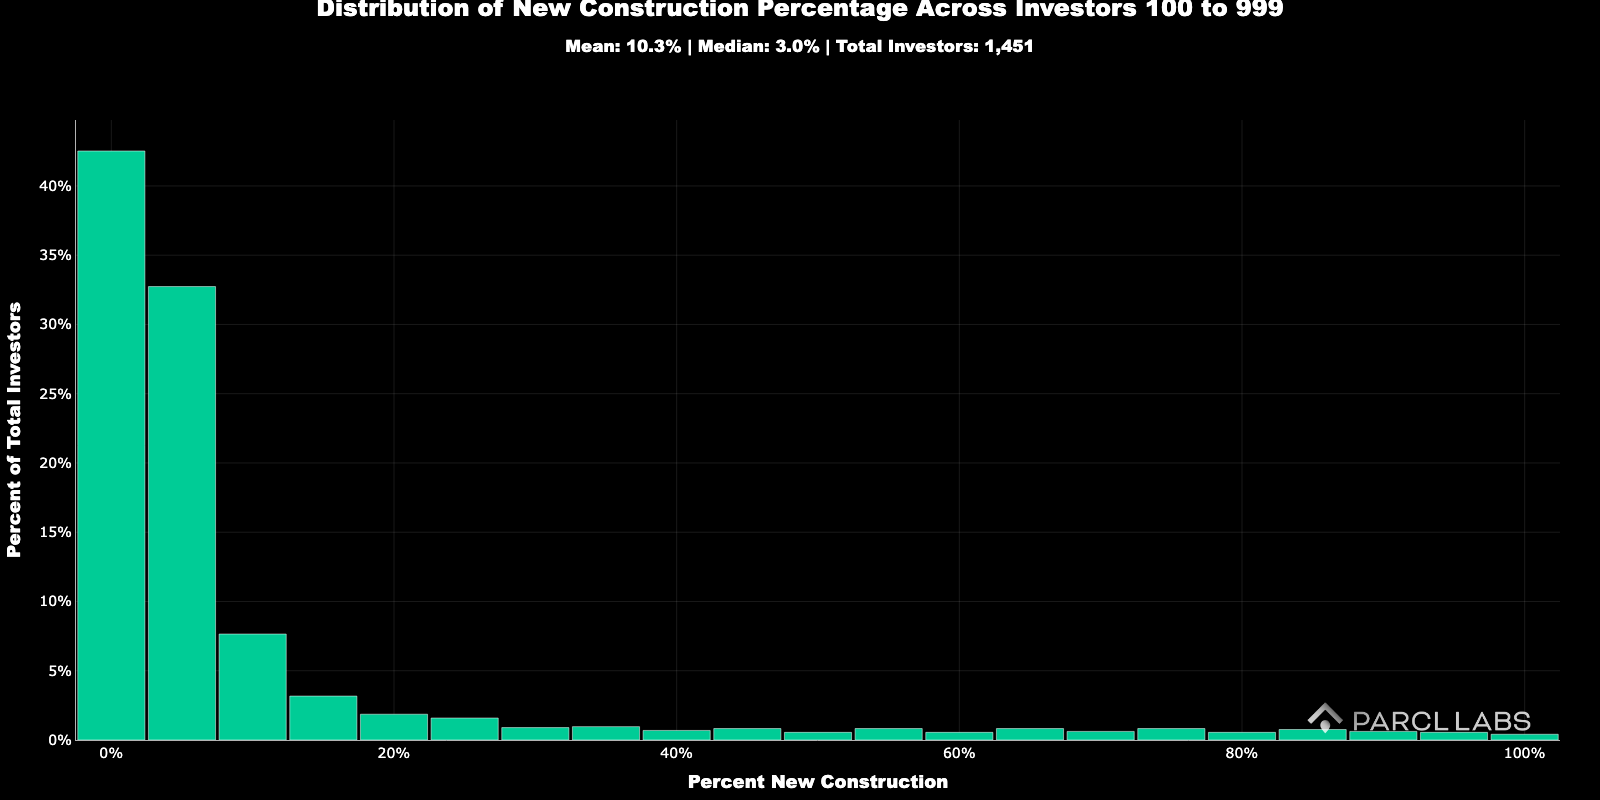
If you have portfolios of 10 to 99 and at least 1 new construction home, about 16% of all the properties are new construction, compared to only 4% for larger investors. This indicates a different strategy for mid-size regional investors.


Follow Us for More