Trouble in the Tri-Cities? Why Kingsport, Tennessee, Leads the Motivated Seller Index
Sep 18, 2026 · 13 min read
Kingsport, Tennessee leads the nation in seller motivation. What's driving the price cuts, and who's most exposed if prices fall?

Executive Summary
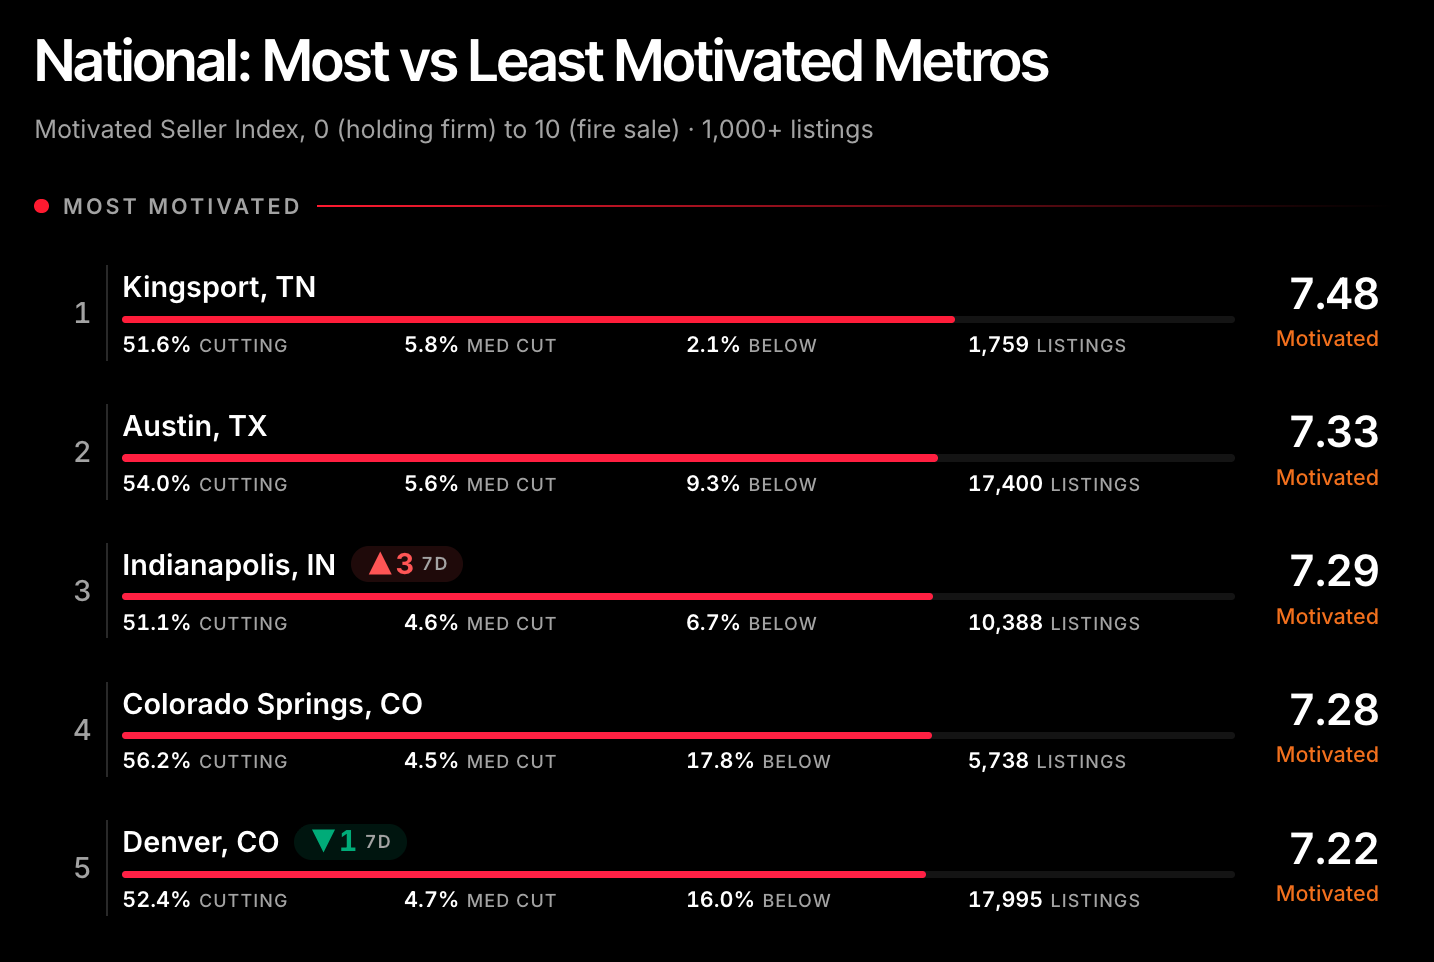
Kingsport-Bristol, Tennessee is the most motivated major housing market in the country. Its Motivated Seller Index of 7.48 ranks #1 of 234 metros with at least 1,000 active listings. Neighboring Johnson City reads 7.27 on 984 listings. 52% of listings in both metros have cut price; the US figure is 42%.
The cutting looks like a pullback after outsized price appreciation, not acute financial distress. 2% of Kingsport listings ask less than the owner paid, against 7% of listings nationally. Only nine listings in the metro are underwater.
Prices rose 83% from a low base. The Kingsport sale price index is up 83% since January 2020, against 47% for the US, starting from $88 per square foot versus $141 nationally. A Kingsport owner who bought in 2018 holds a 95% index gain. A 2024 buyer holds 7%.
Supply moved up the price ladder faster than buyers. 51% of Kingsport sales still close under $250,000; 35% of listings are priced there. In January 2020, 85% of sales closed under $250,000.
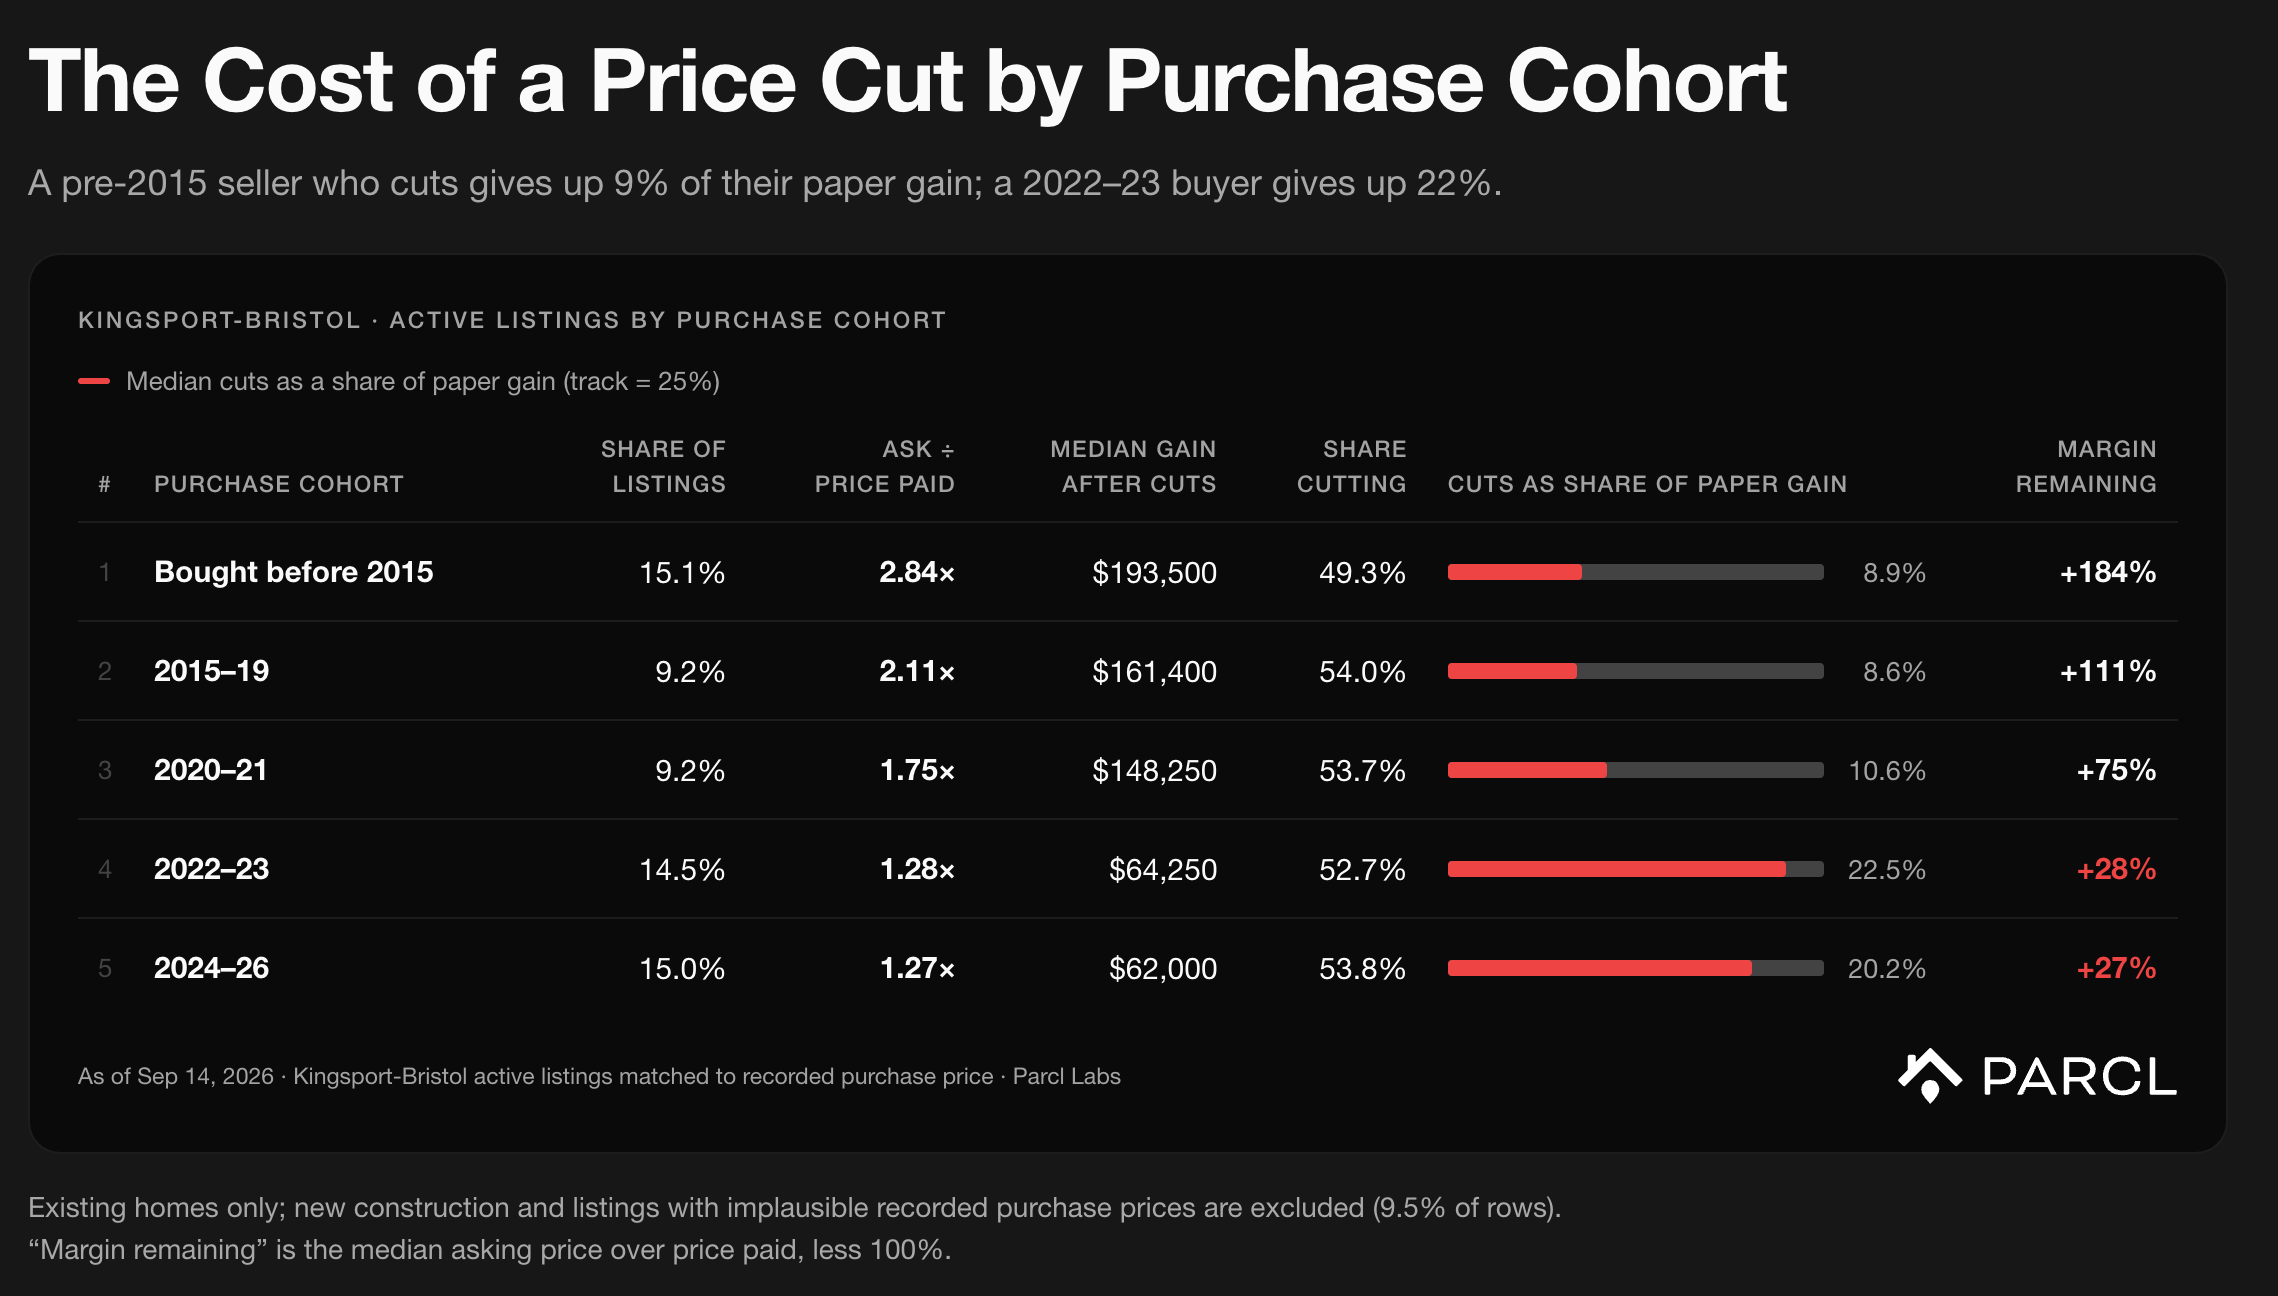
No single cohort is driving Kingsport's seller motivation. Several are, with different reasons to sell and different margin to cut, all competing for the same buyers. Owners who bought before 2015 ask 2.84x what they paid and give up 9% of their paper gain when they cut. Buyers from 2022–23 give up 22%. Builders have cut on 59% of new-construction listings, the highest of any Kingsport seller cohort.
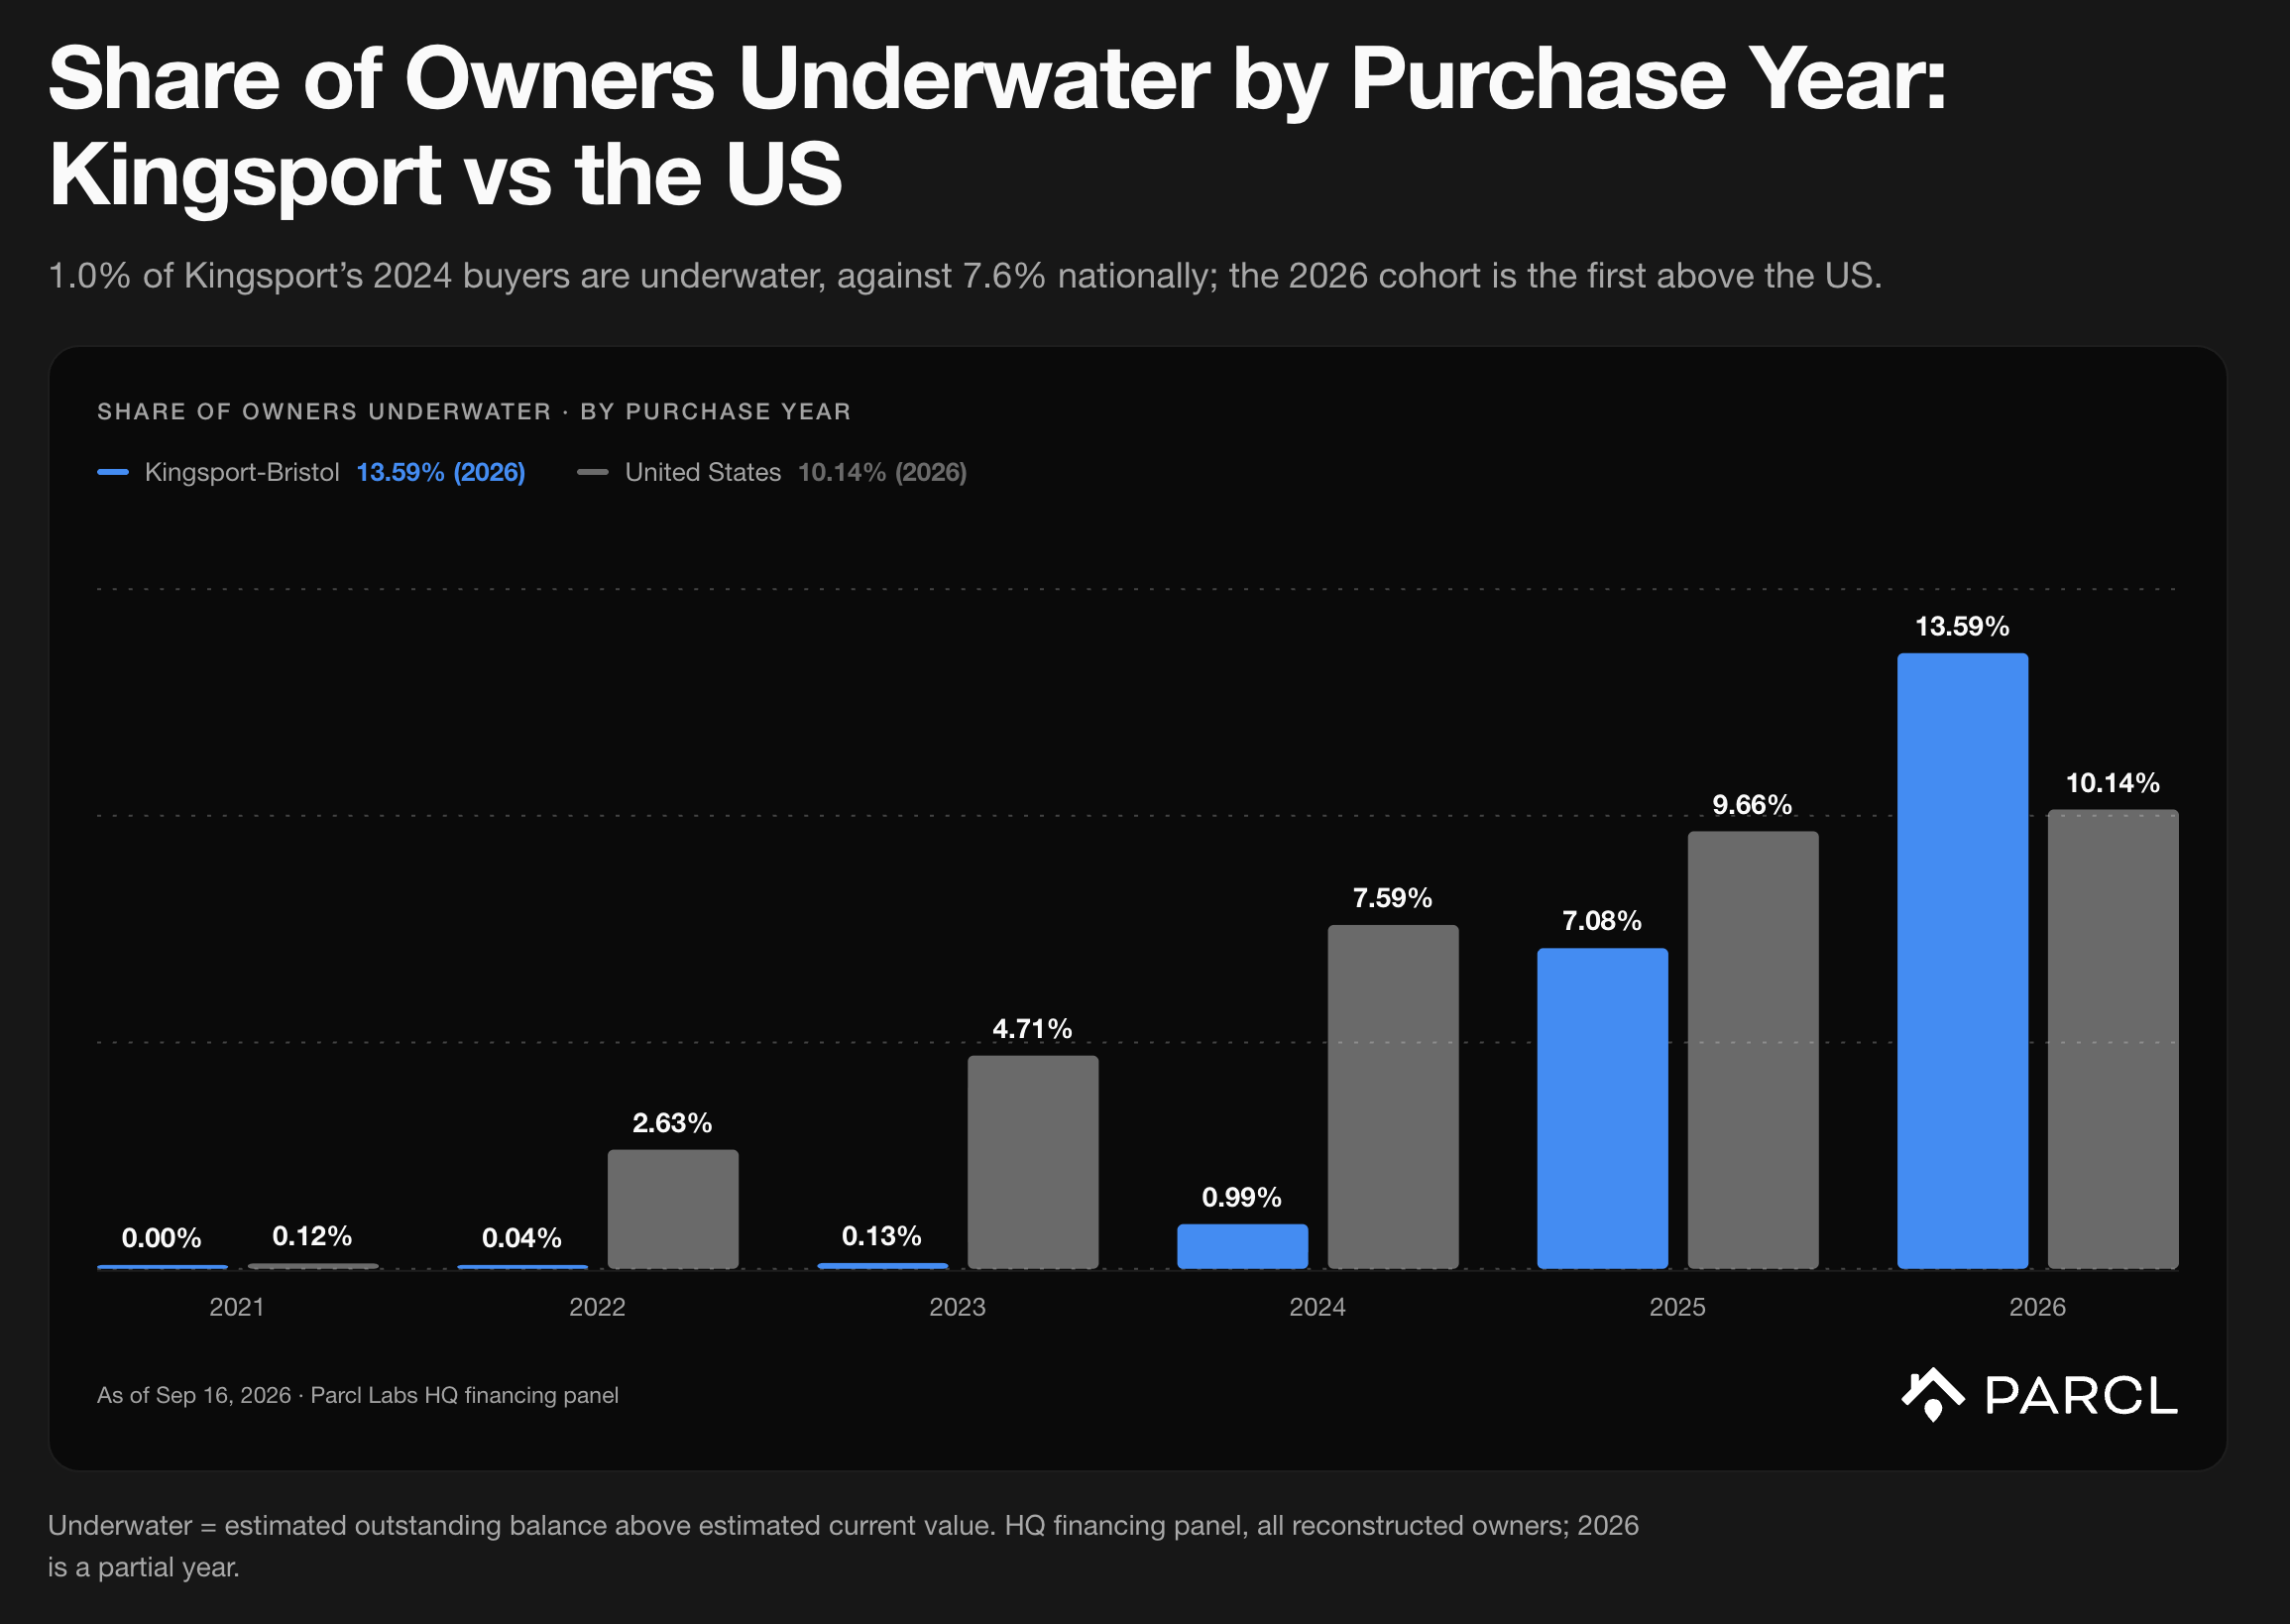
What we're watching in : Kingsport's price index is 1.8% below its June 2026 peak. The 2025 and 2026 purchase cohorts are the first with a meaningful share of owners with a mortgage underwater: 7.1% and 13.6% of those owners, listed or not, owe more than their home is worth.
What MSI Measures
The Motivated Seller Index (MSI) scores seller urgency through the breadth, depth and pace of price cutting: how many listings have cut, how far, and how fast. Parcl designed MSI to separate markets where sellers list at aspirational prices and hold firm (i.e. unmotivated) from markets where they are actively cutting to find a buyer (i.e. motivated).
Large, growing for-sale inventory does not necessarily mean sellers are willing to accept less. Even when supply exceeds demand, lower sale prices require sellers to meet buyers where they are. A high MSI signals that sellers are making that adjustment.
What drives that kind of active selling? One possibility is financial pressure: the owner owes more than the home is worth, or can no longer afford the payment, and cuts because the sale has to happen. Another is an expectation reset: the owner listed high after a period of rapid appreciation, found buyers would not pay it, and is cutting to bring the price back to the market. MSI captures both. Parcl's underlying listing, owner, and financing analytics can help distinguish between these motivation drivers, and that is what this piece does for Kingsport.
Kingsport Ranks #1 on MSI
Kingsport-Bristol has topped the Motivated Seller Index among metros with at least 1,000 active listings since August. Its MSI is 7.48 on the September 17 ranking, against 5.64 for the US.
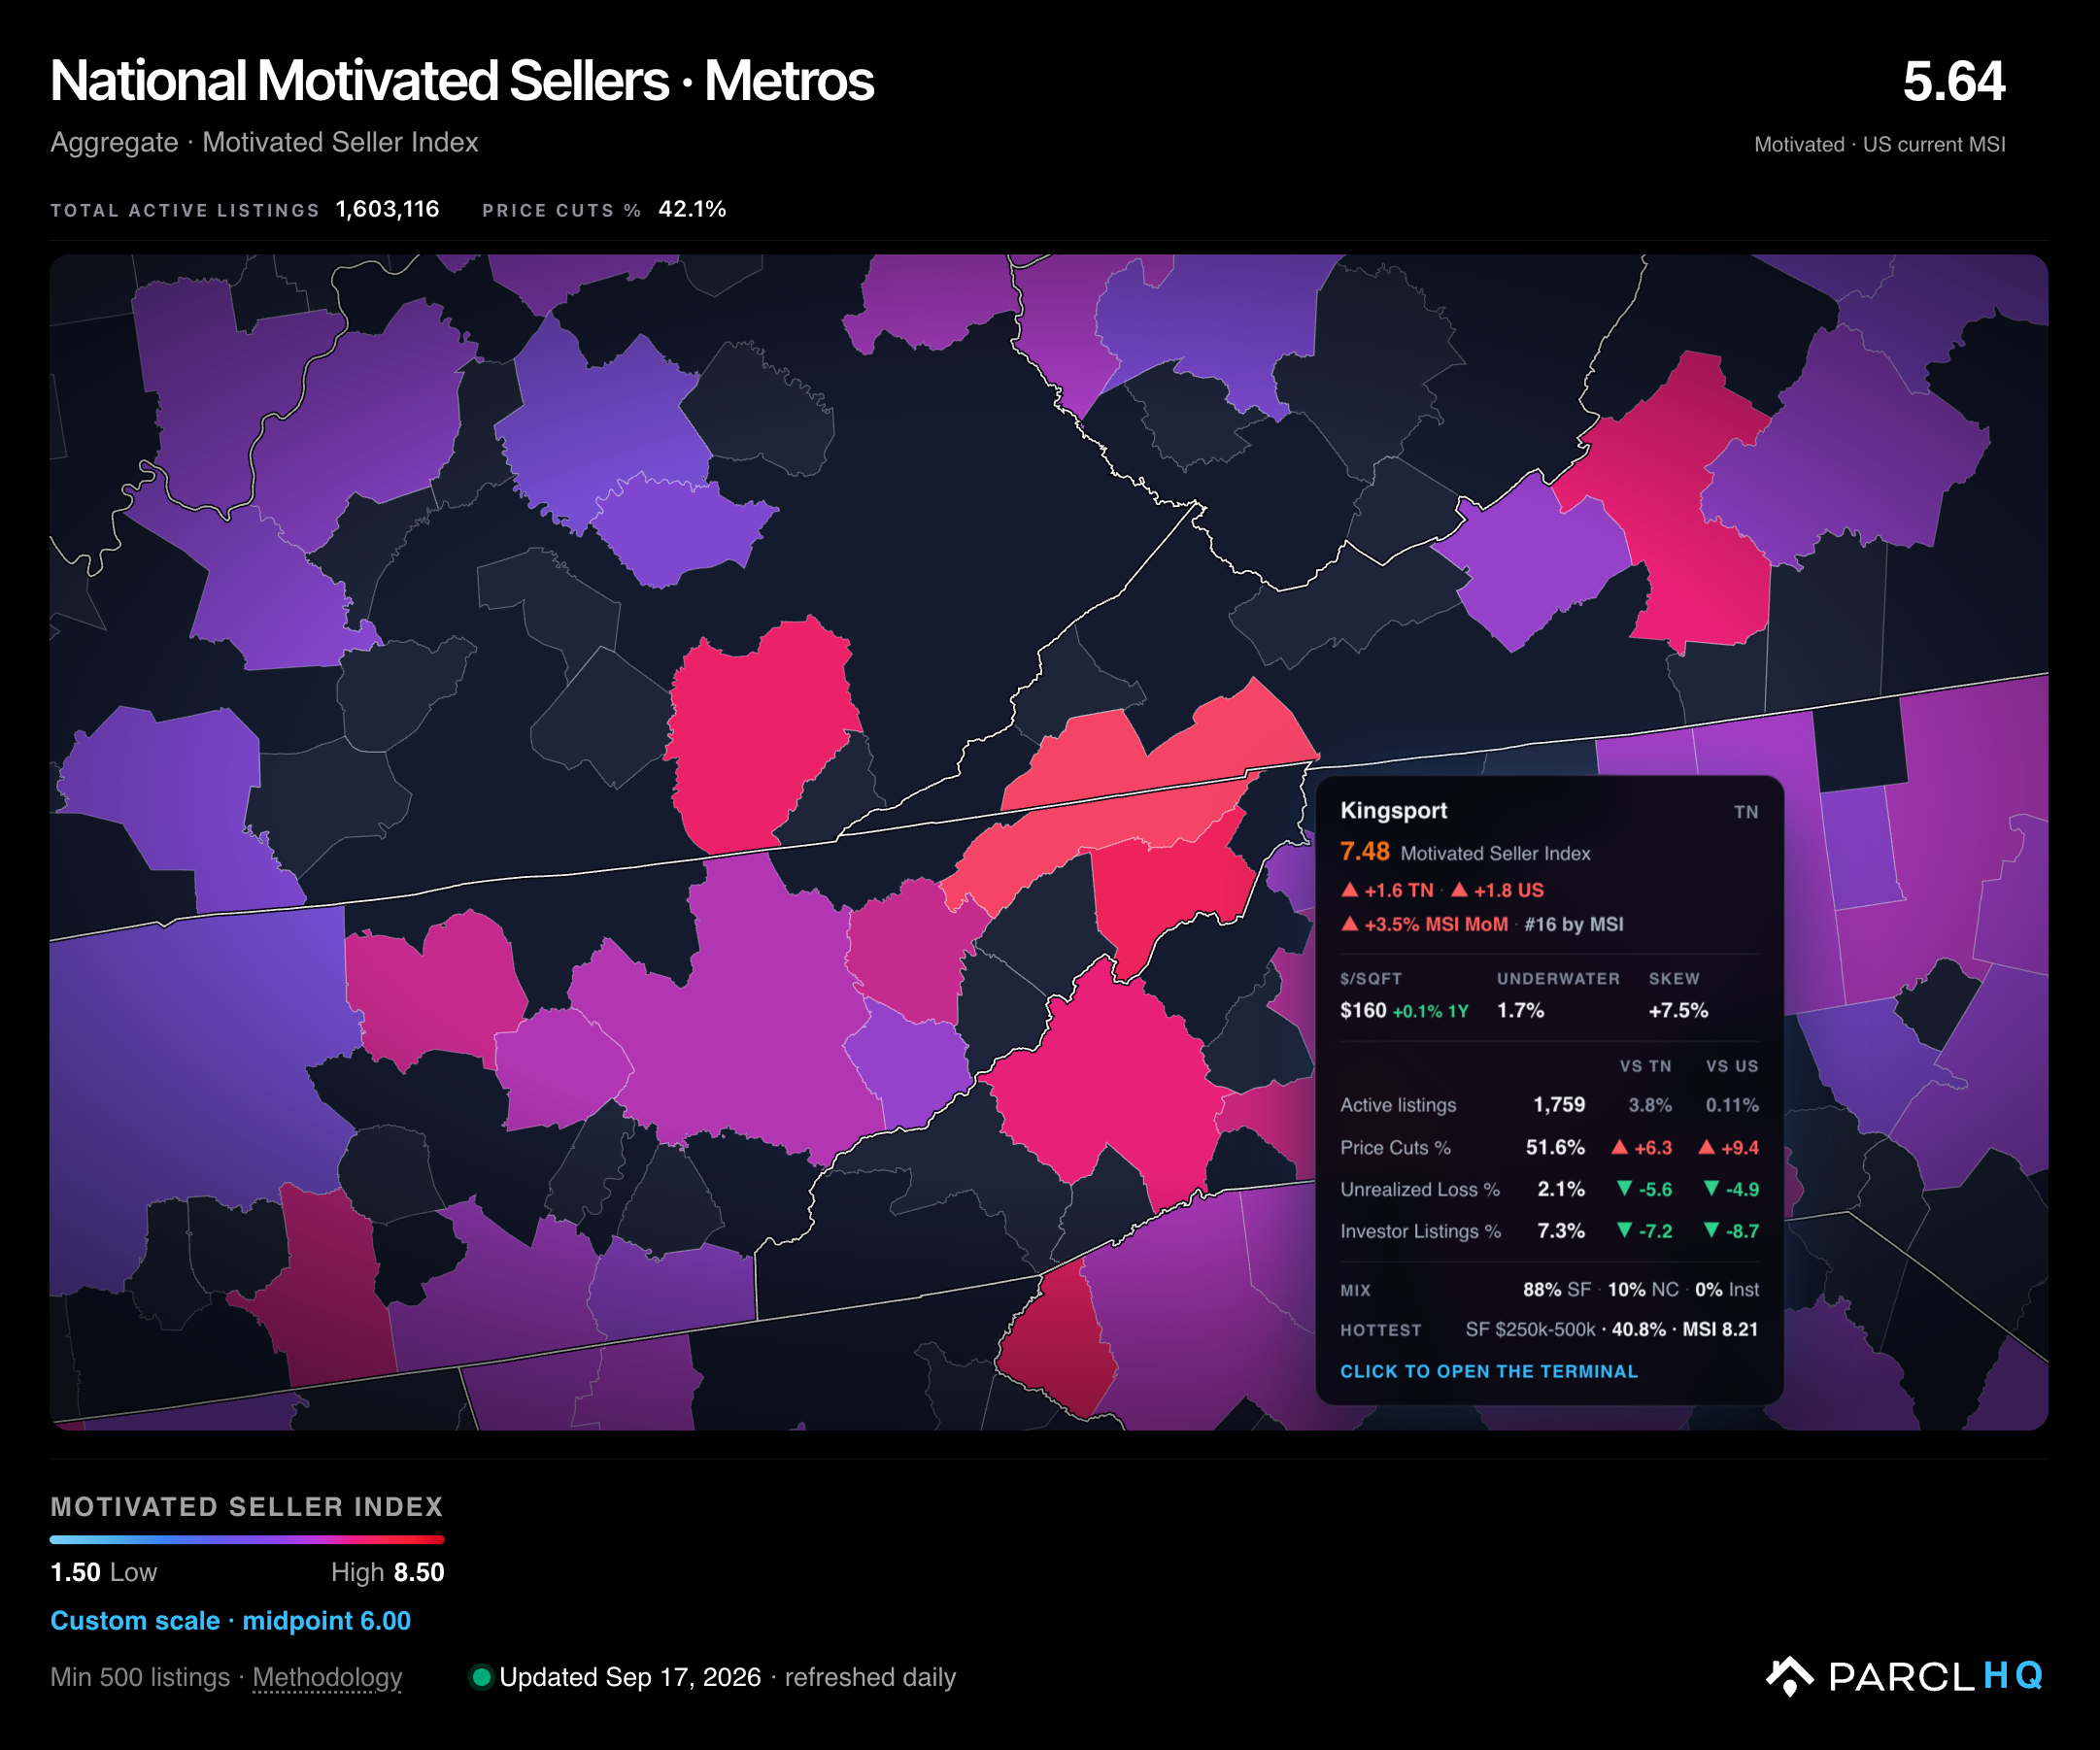
Johnson City borders Kingsport in Eastern Tennessee. Its MSI of 7.27 on 984 active listings would rank it in the top ten among major metros if it cleared the 1,000-listing cutoff. Among the 396 metros with at least 500 listings, Kingsport ranks #3 and Johnson City #6.
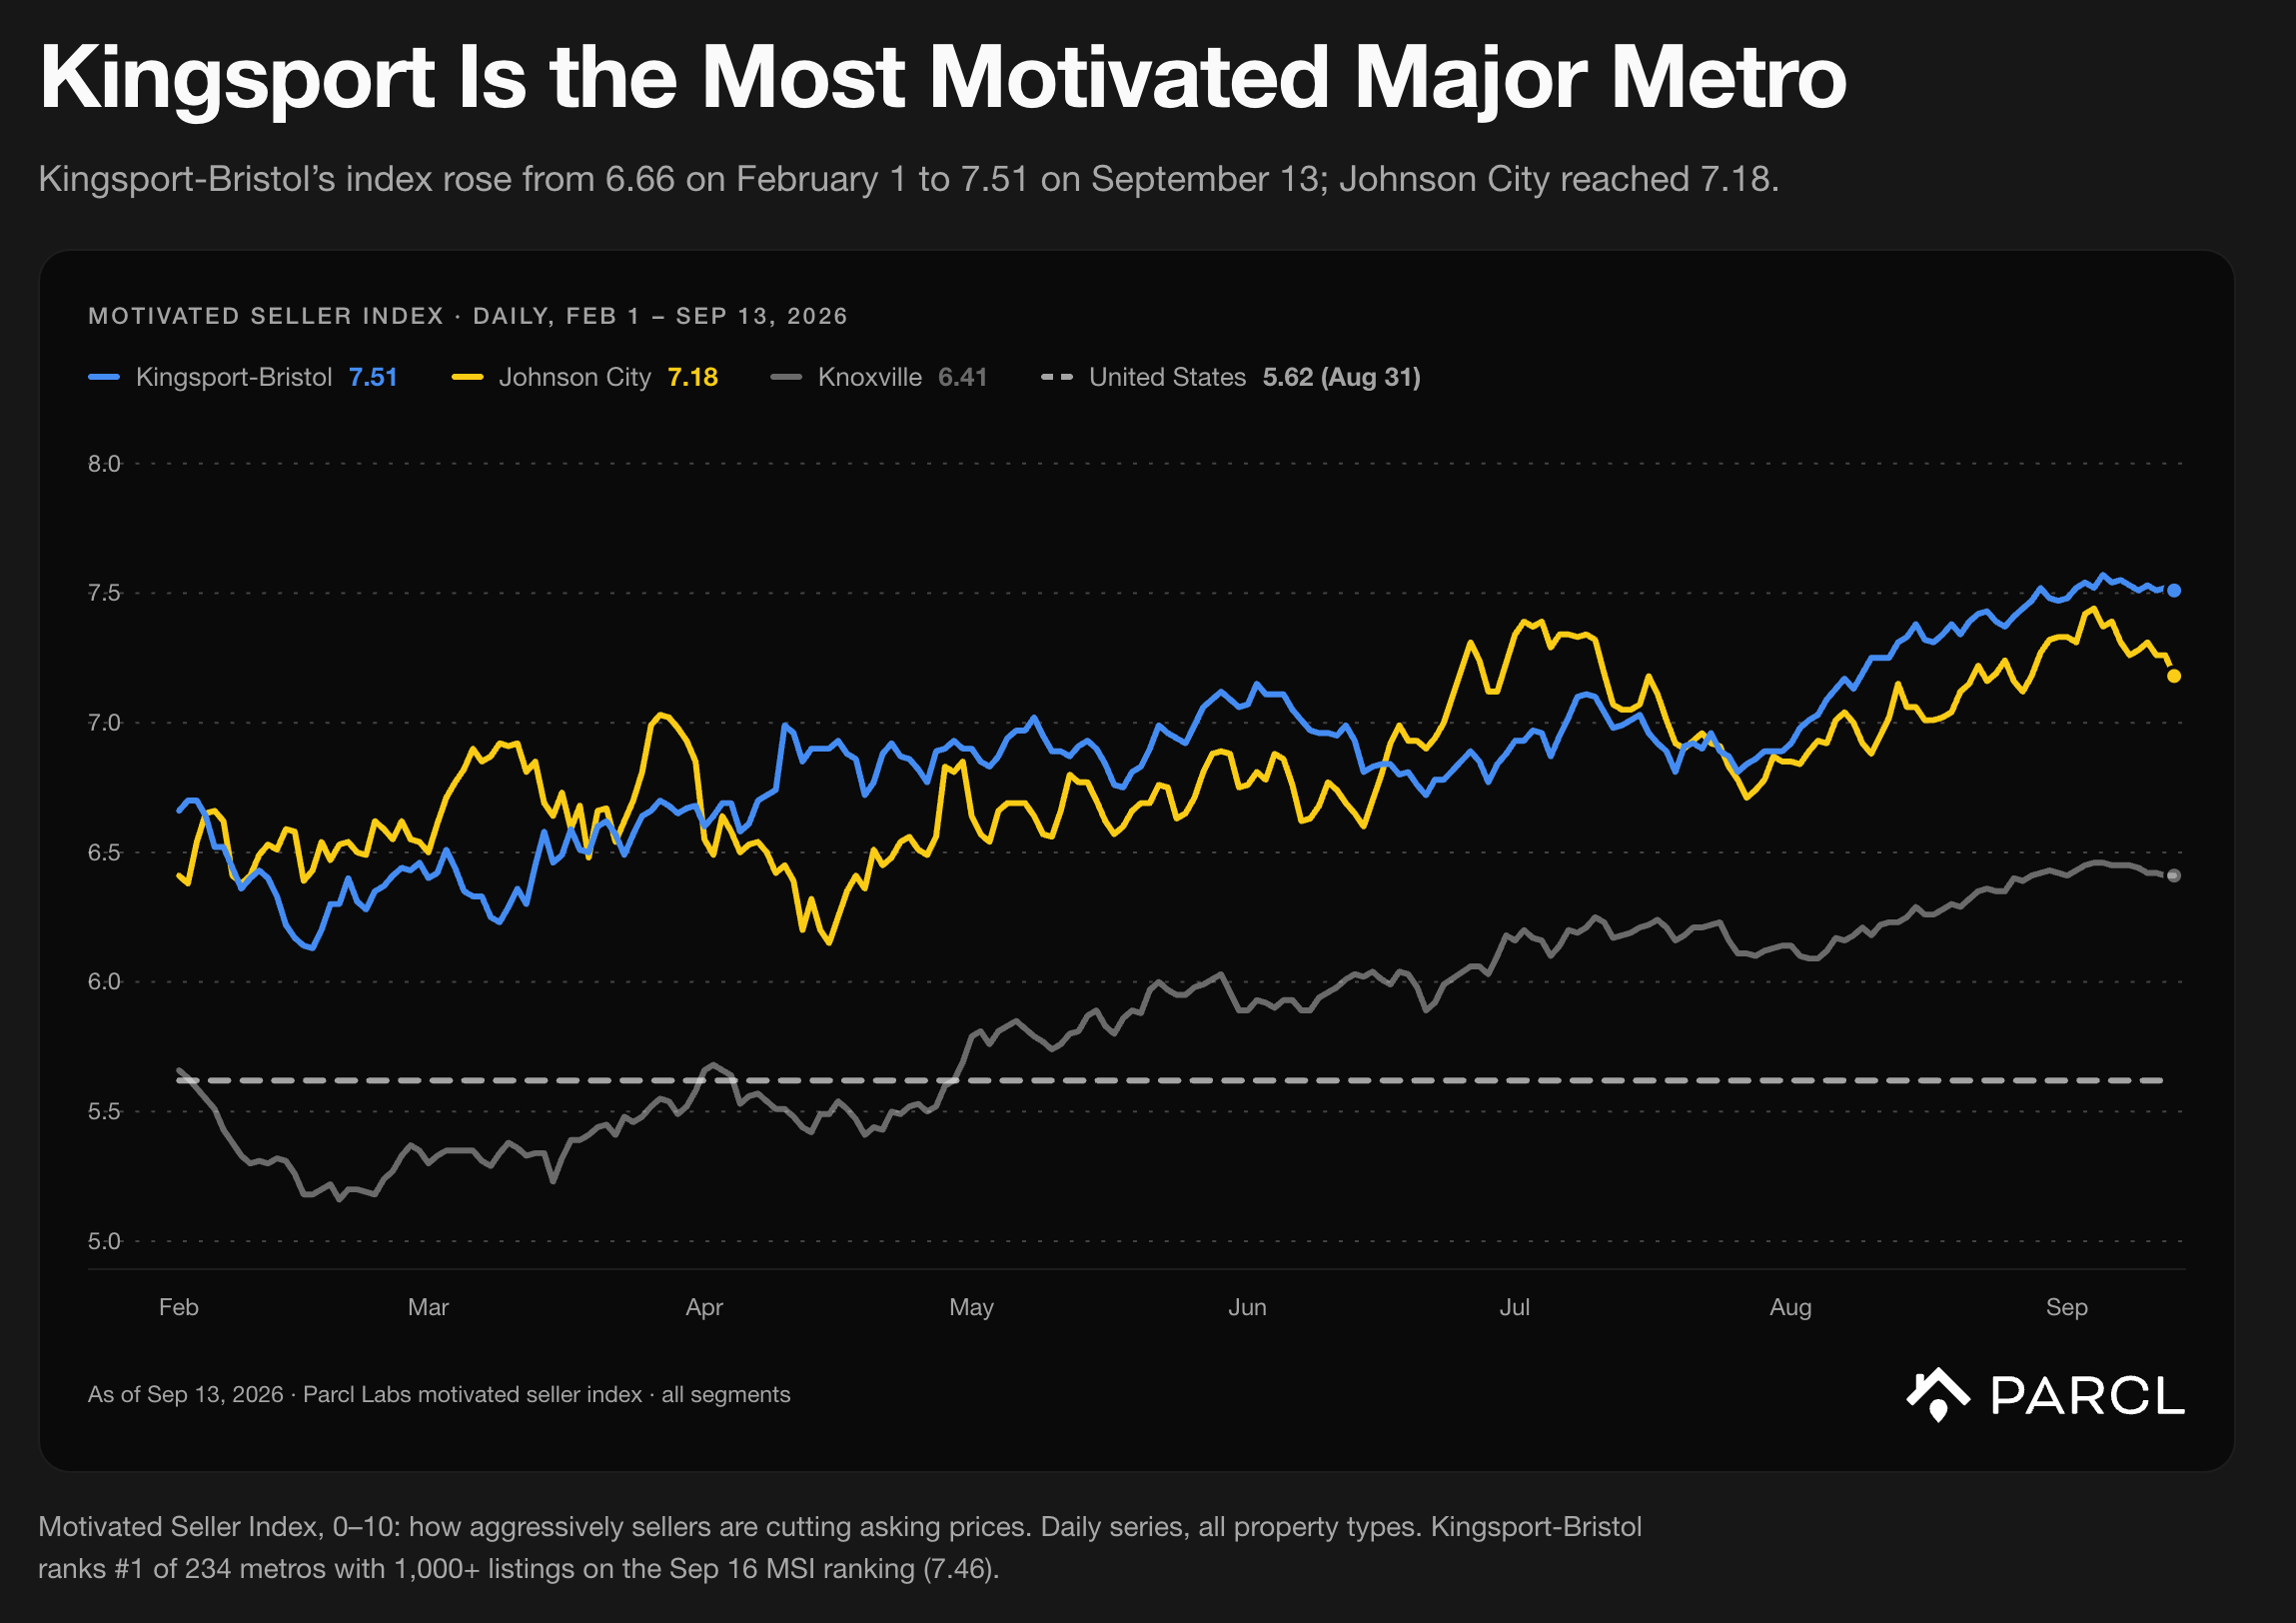
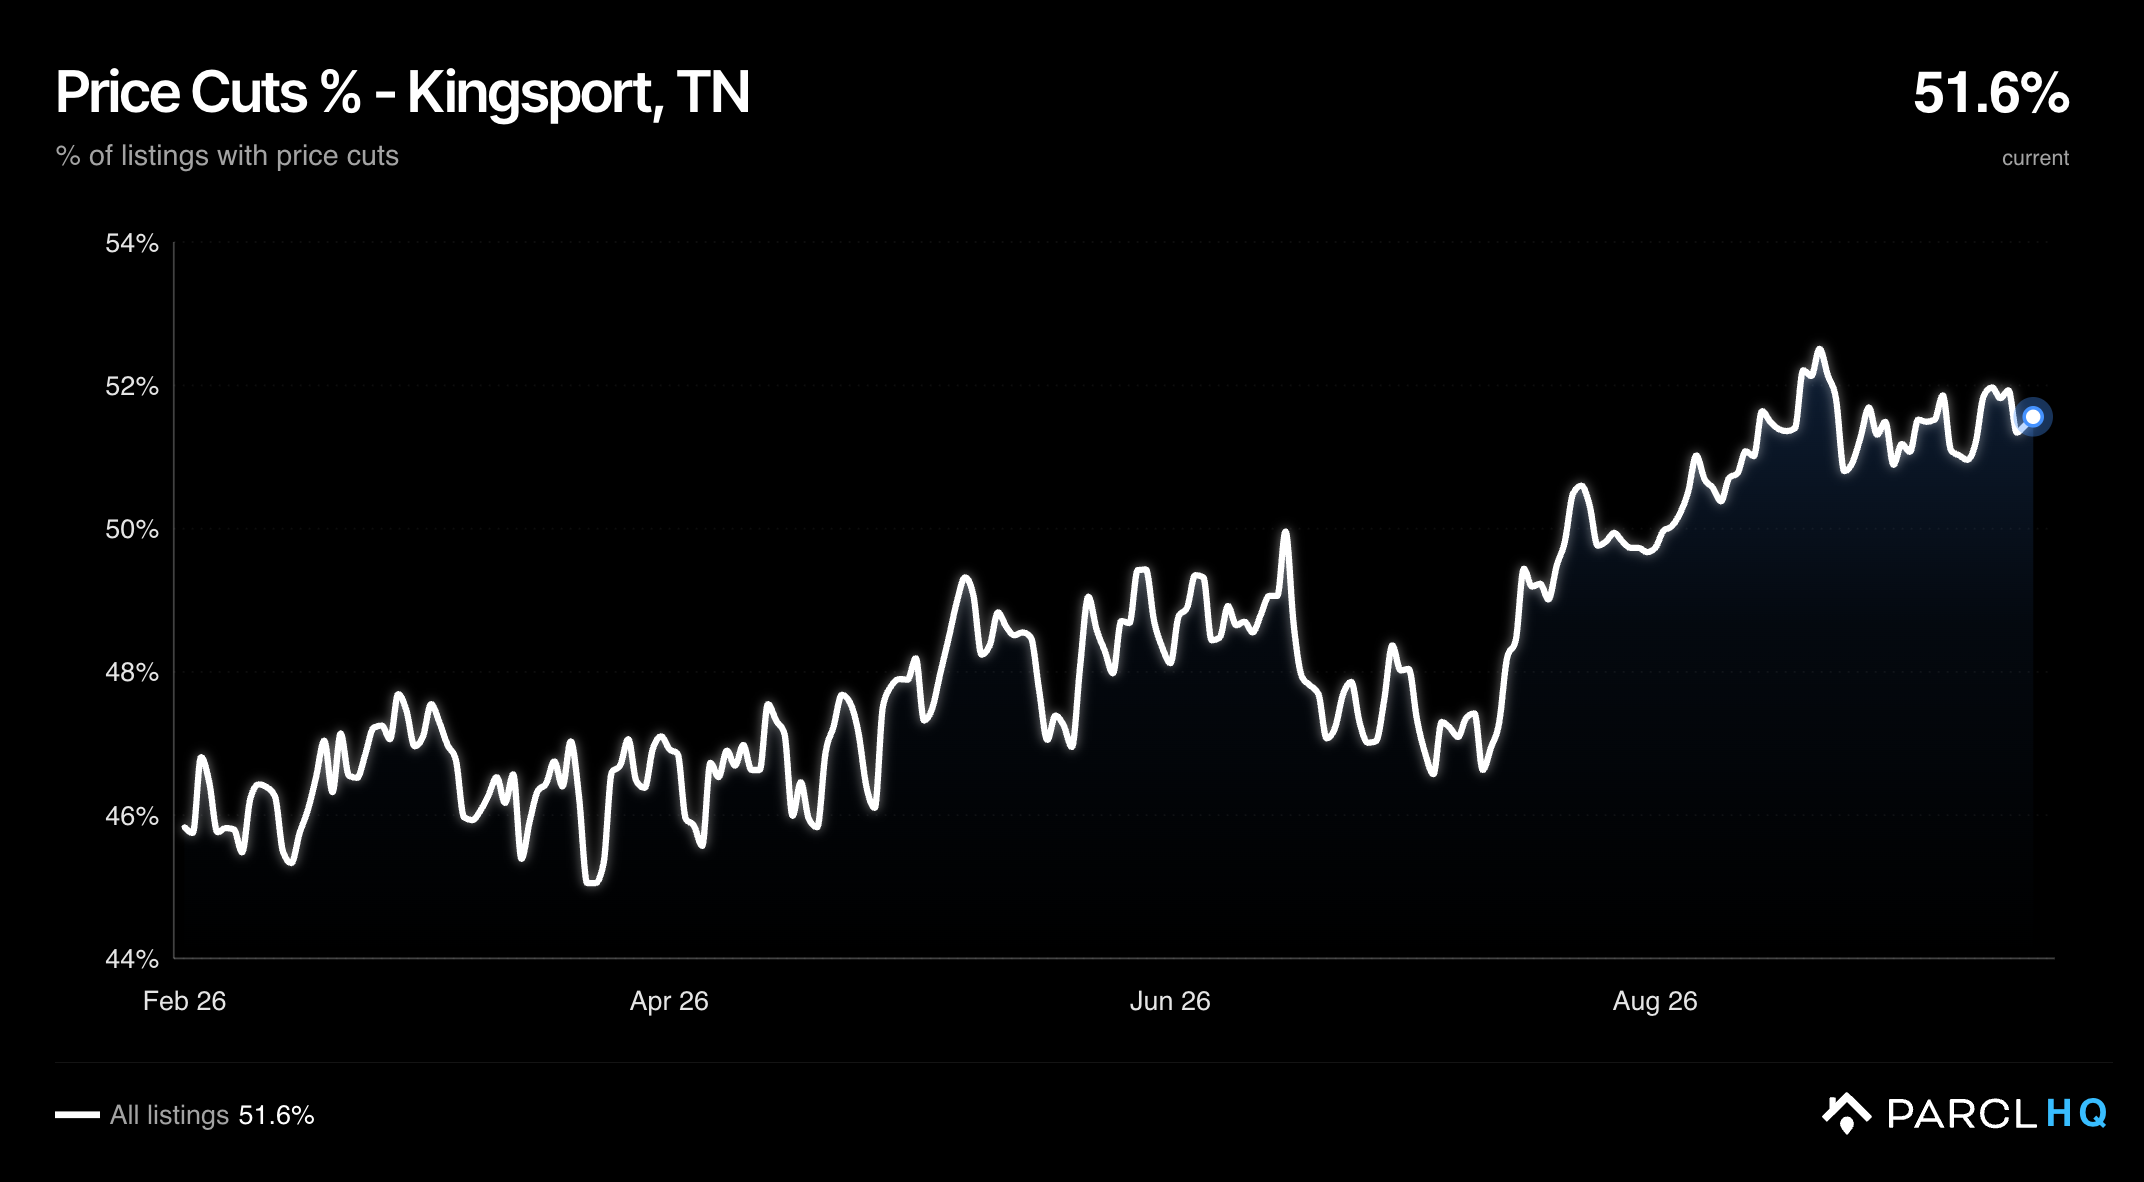
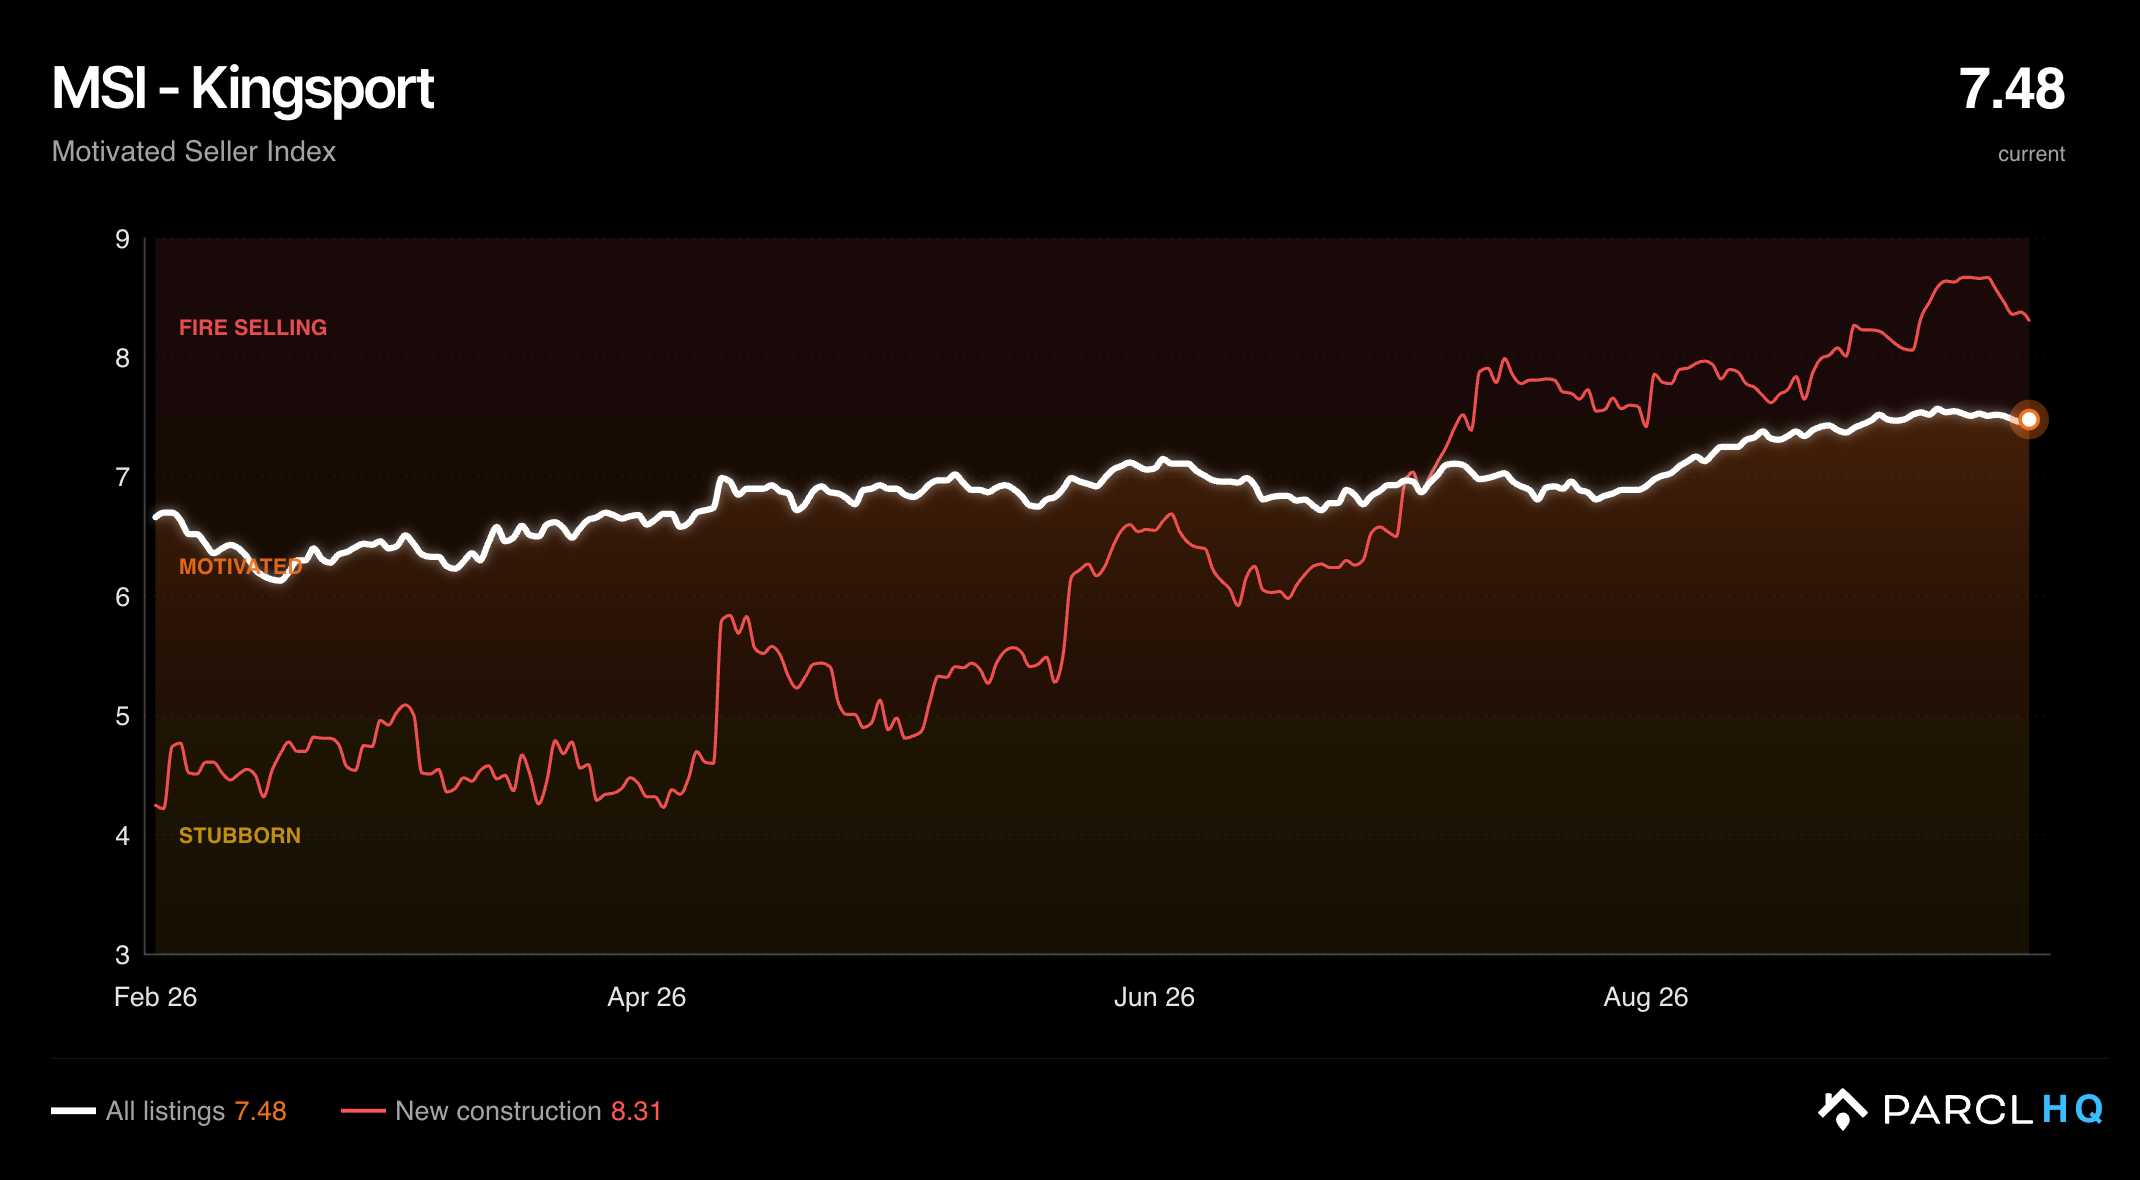
Motivation has risen since February in both metros. On HQ's daily series, Kingsport's MSI moved from 6.66 on February 1 to ~7.5 by mid-September, and the share of listings with at least one price cut rose from 46% to 52%. Johnson City moved from 6.41 to 7.18. Knoxville, the nearest large metro, moved from 5.66 to 6.41. Active listings in Kingsport increased 71% over the same period, from 1,032 to 1,764.
Kingsport ranks ninth of the 234 major metros on the share of listings that have cut price. Combined with the depth and pace of those cuts, that places it first on the index.
The Cutting Does Not Appear to Be Distress
The listing-level and owner-level data point away from financial distress.
About 2% of Kingsport listings ask less than the owner paid, the lowest share among the twelve most motivated metros and well below the 7% of listings nationally. Only nine total listings in the metro are flagged underwater.
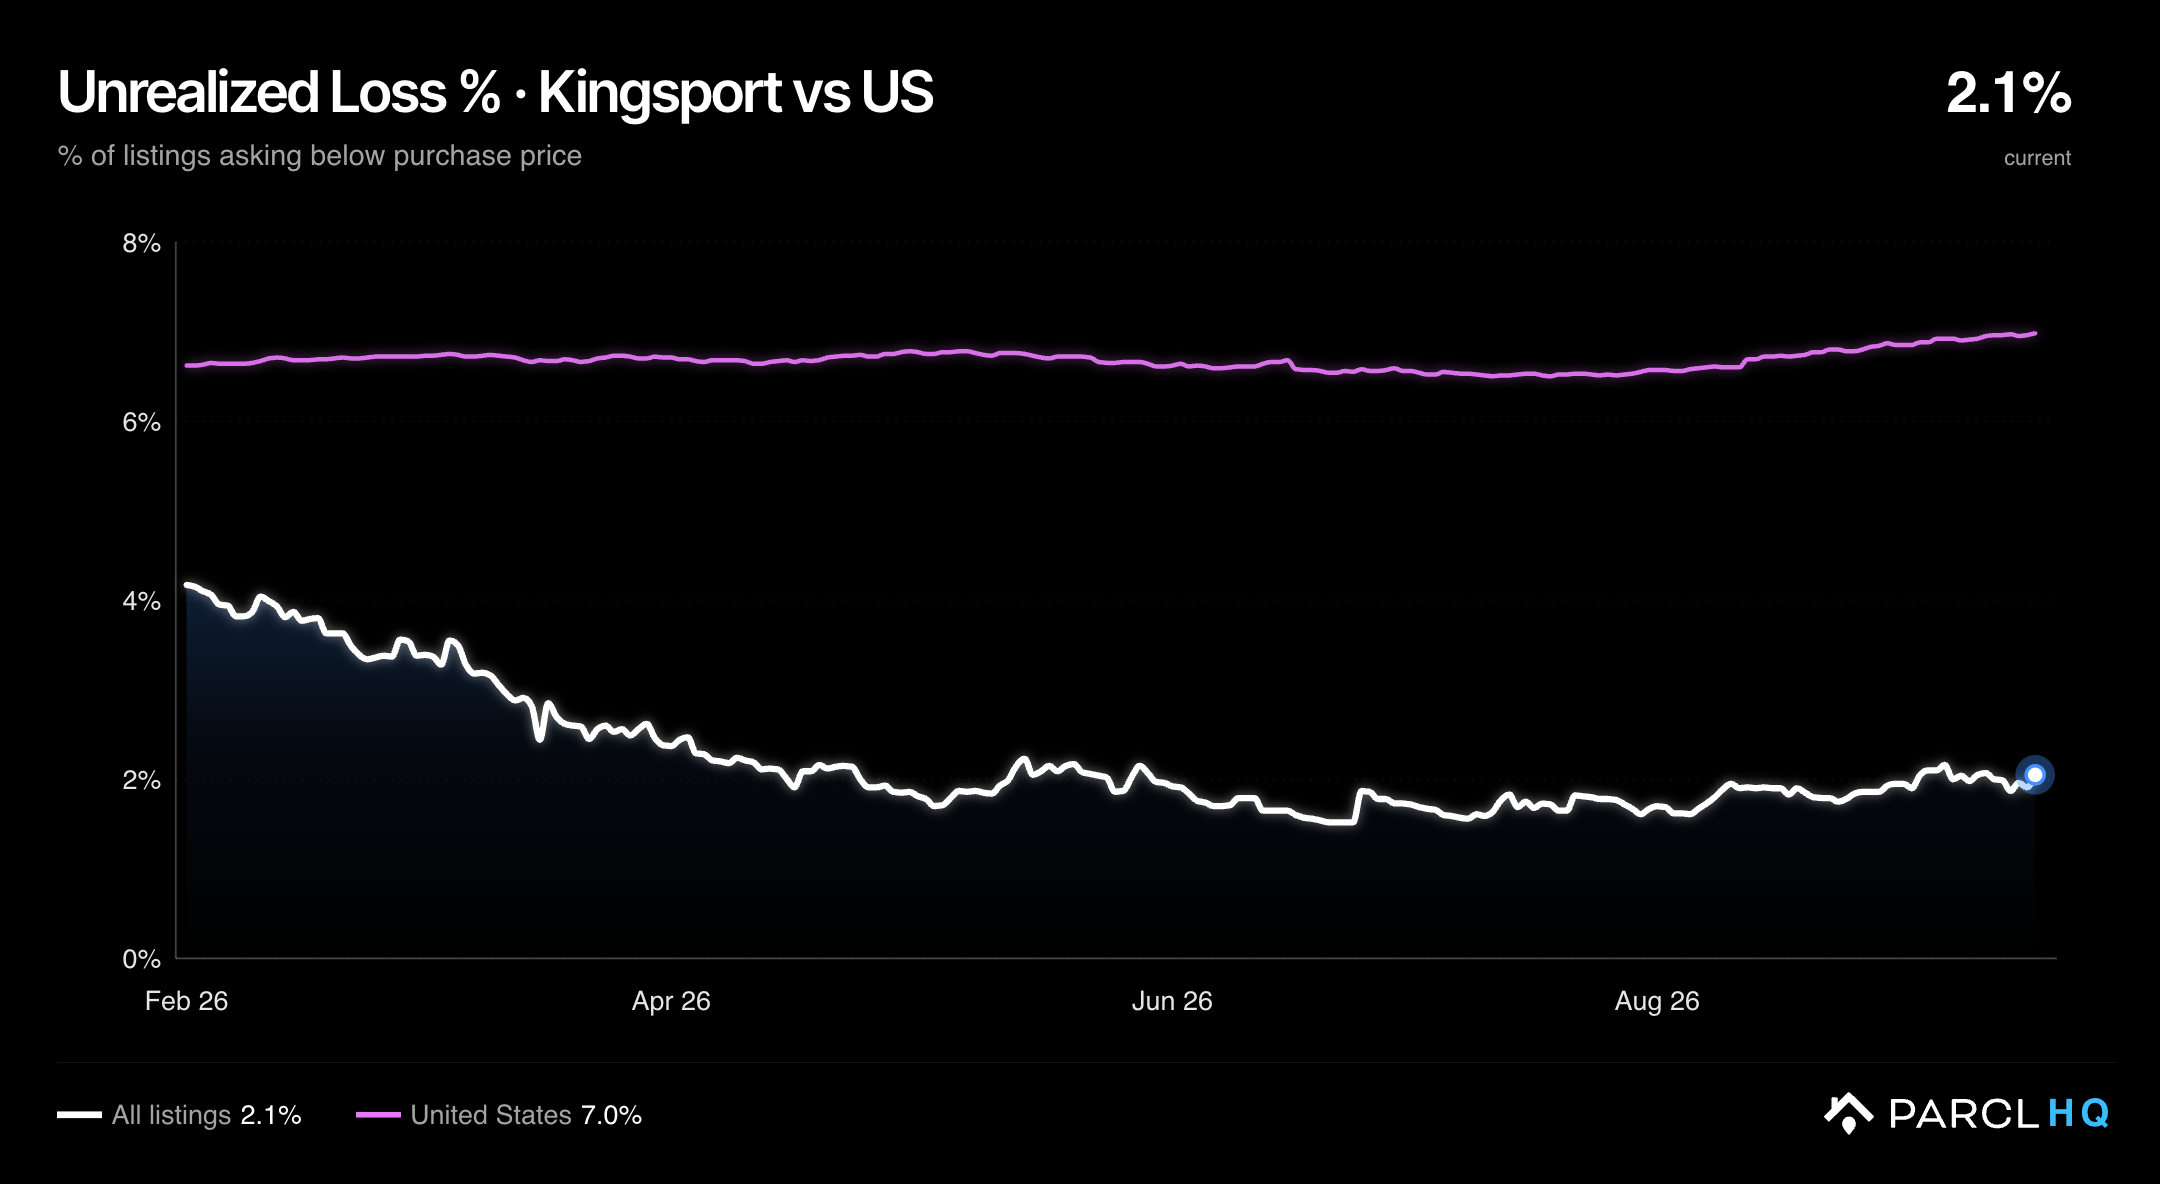
Among owners with a mortgage who currently have a home listed, 1.7% owe more than the estimated value of the home, against 3.6% nationally, and under 1% are asking less than their loan balance, against 2.1% for the US.
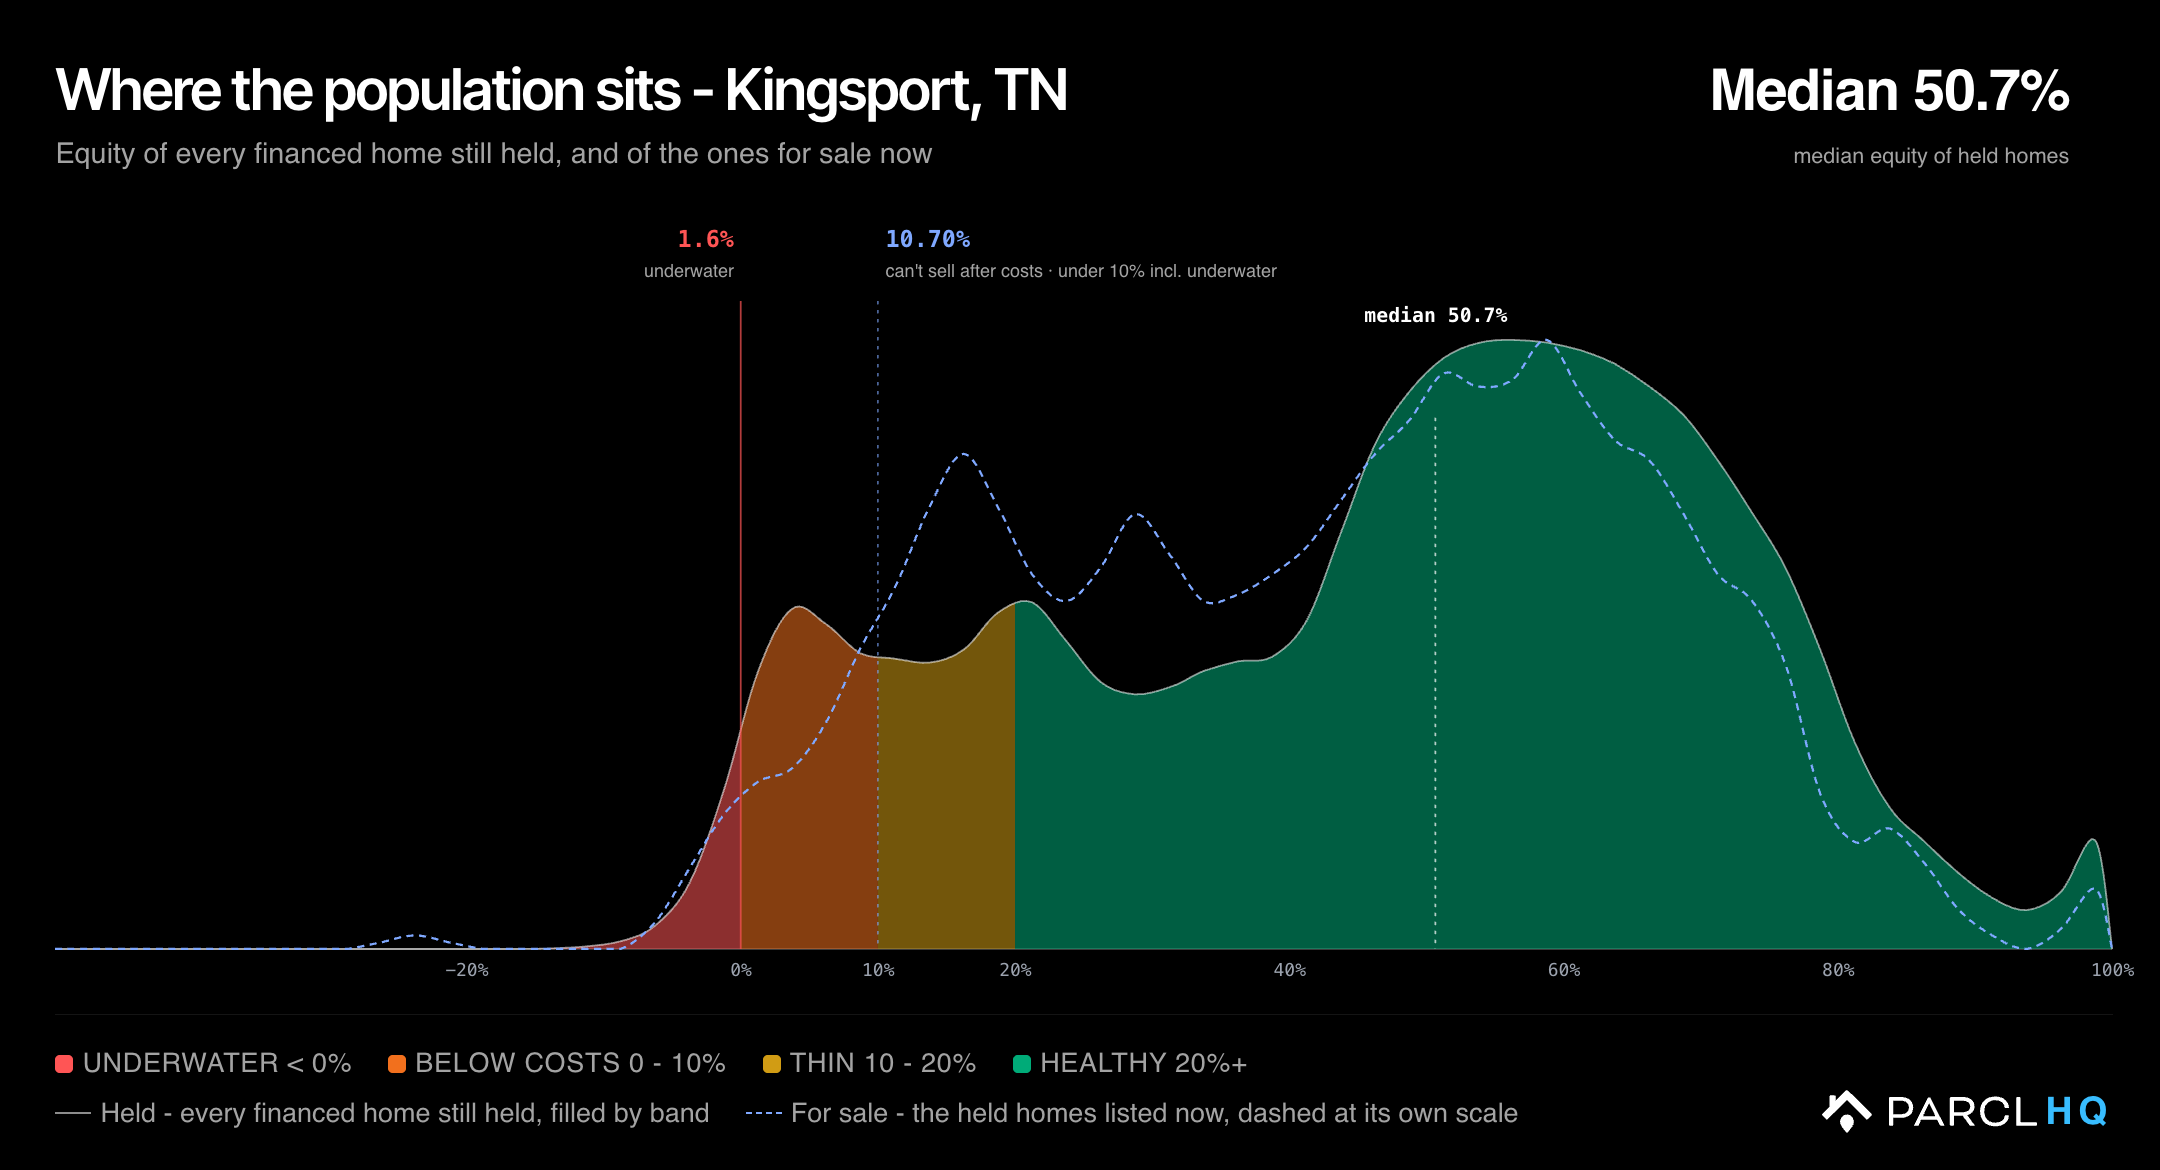
On this evidence, Kingsport owners are not in unusual financial trouble and are not rushing to sell. What sets them apart is what happens after they list. The rest of the piece lays out why that pattern is consistent with the second explanation for elevated MSI, sellers pricing to peak expectations and adjusting toward the market. In Kingsport, a few conditions seem to be contributing to this dynamic: a large percentage price gain from a low base, a supply mix that moved up the price ladder faster than buyers did, and seller cohorts with different amounts of room to adjust competing for the same buyers.
Prices Rose 83% From a Low Base
Between January 2020 and September 2026 the Kingsport sale price index rose 83%. Johnson City rose 84%, Knoxville 79%, the US 47%.
In January 2020 Kingsport homes sold for $88 per square foot; the US average was $141. Today Kingsport is at $161 and the US at $207. Kingsport remains a low-priced market in absolute terms, and its owners have experienced substantial appreciation that few US metros can match.
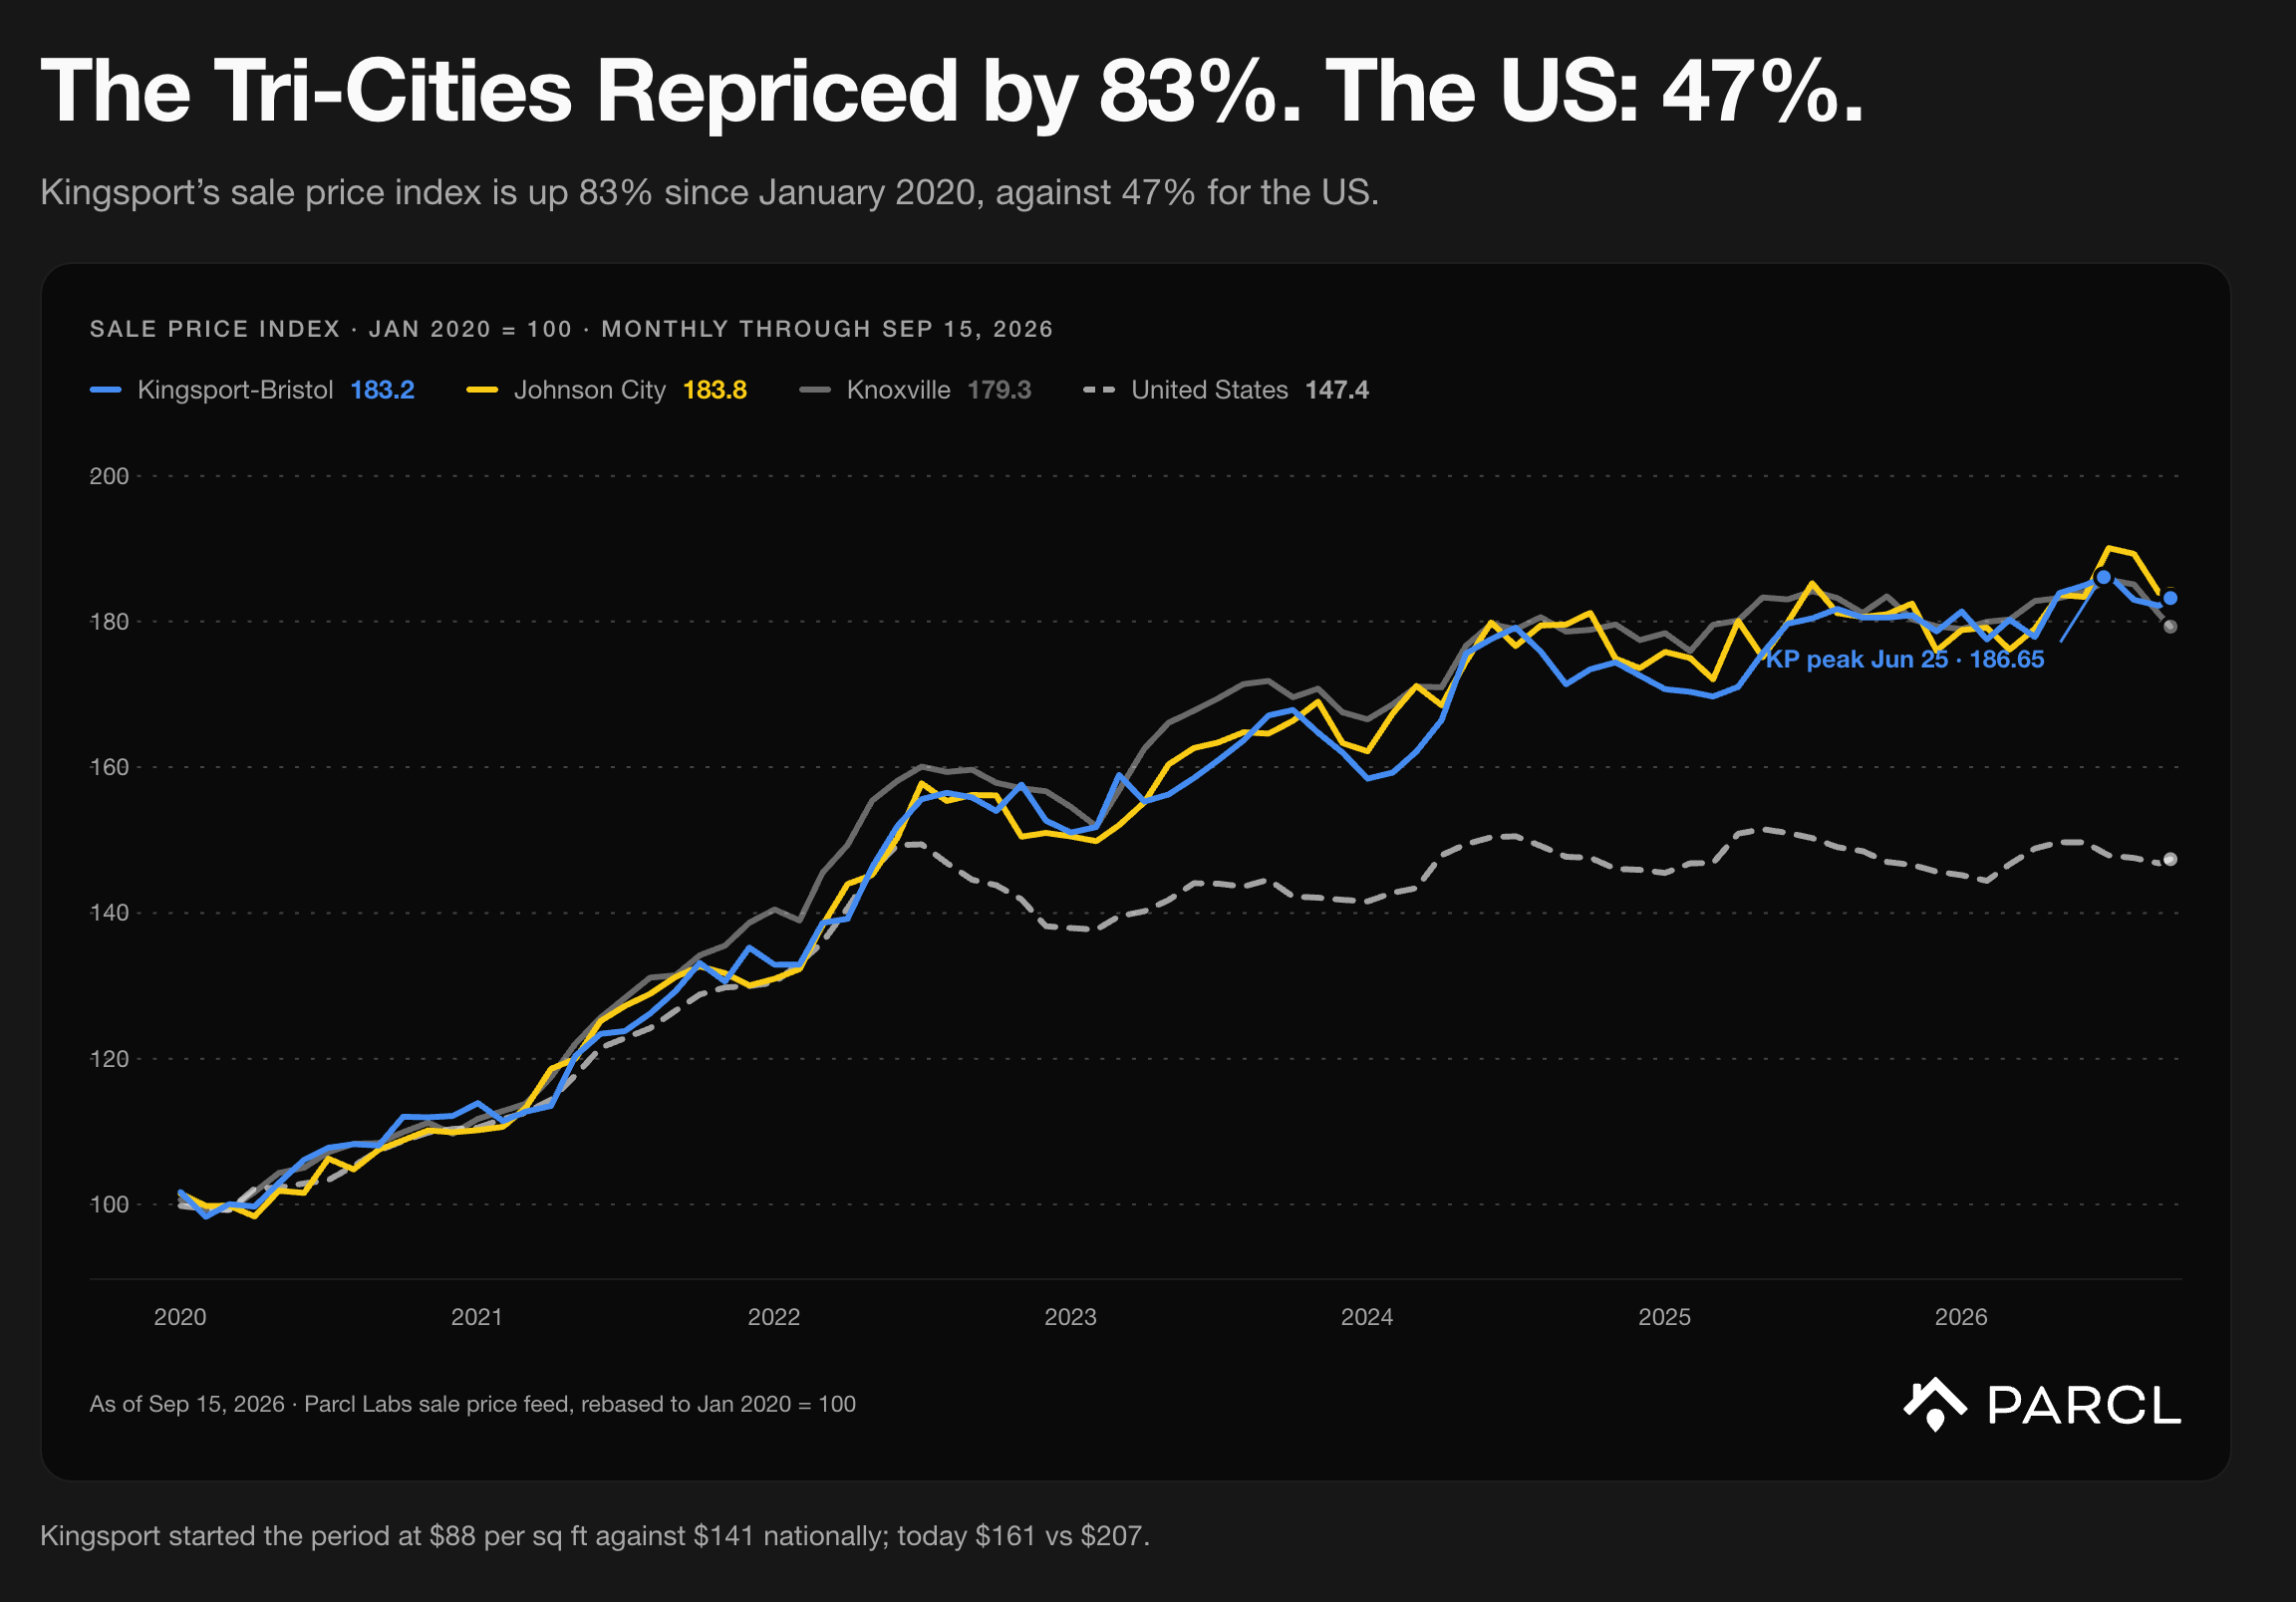
Those gains are distributed by purchase year. An owner who bought in Kingsport in 2018 holds a 95% index gain; the same purchase in the US holds 61%. For a 2021 purchase the figures are 48% and 21%, and for 2024, 7% and near zero. A 2025 Kingsport buyer holds 3%, against a US figure slightly below zero. The gap between a Kingsport owner's gain and a US average gain narrows every year and is close to zero for the newest cohort.
Purchase year | Kingsport index gain to date | US index gain to date |
|---|---|---|
2018 | +95% | +61% |
2020 | +72% | +41% |
2022 | +23% | +4% |
2024 | +7% | +0.2% |
2025 | +3% | −0.6% |
Supply Moved Up the Price Ladder Faster Than Buyers
In January 2020, 85% of Kingsport home sales closed under $250,000. By August 2026 that share had fallen to 51%. Buyers have moved up the price ladder as prices rose, but half of the market still transacts in the entry tier.
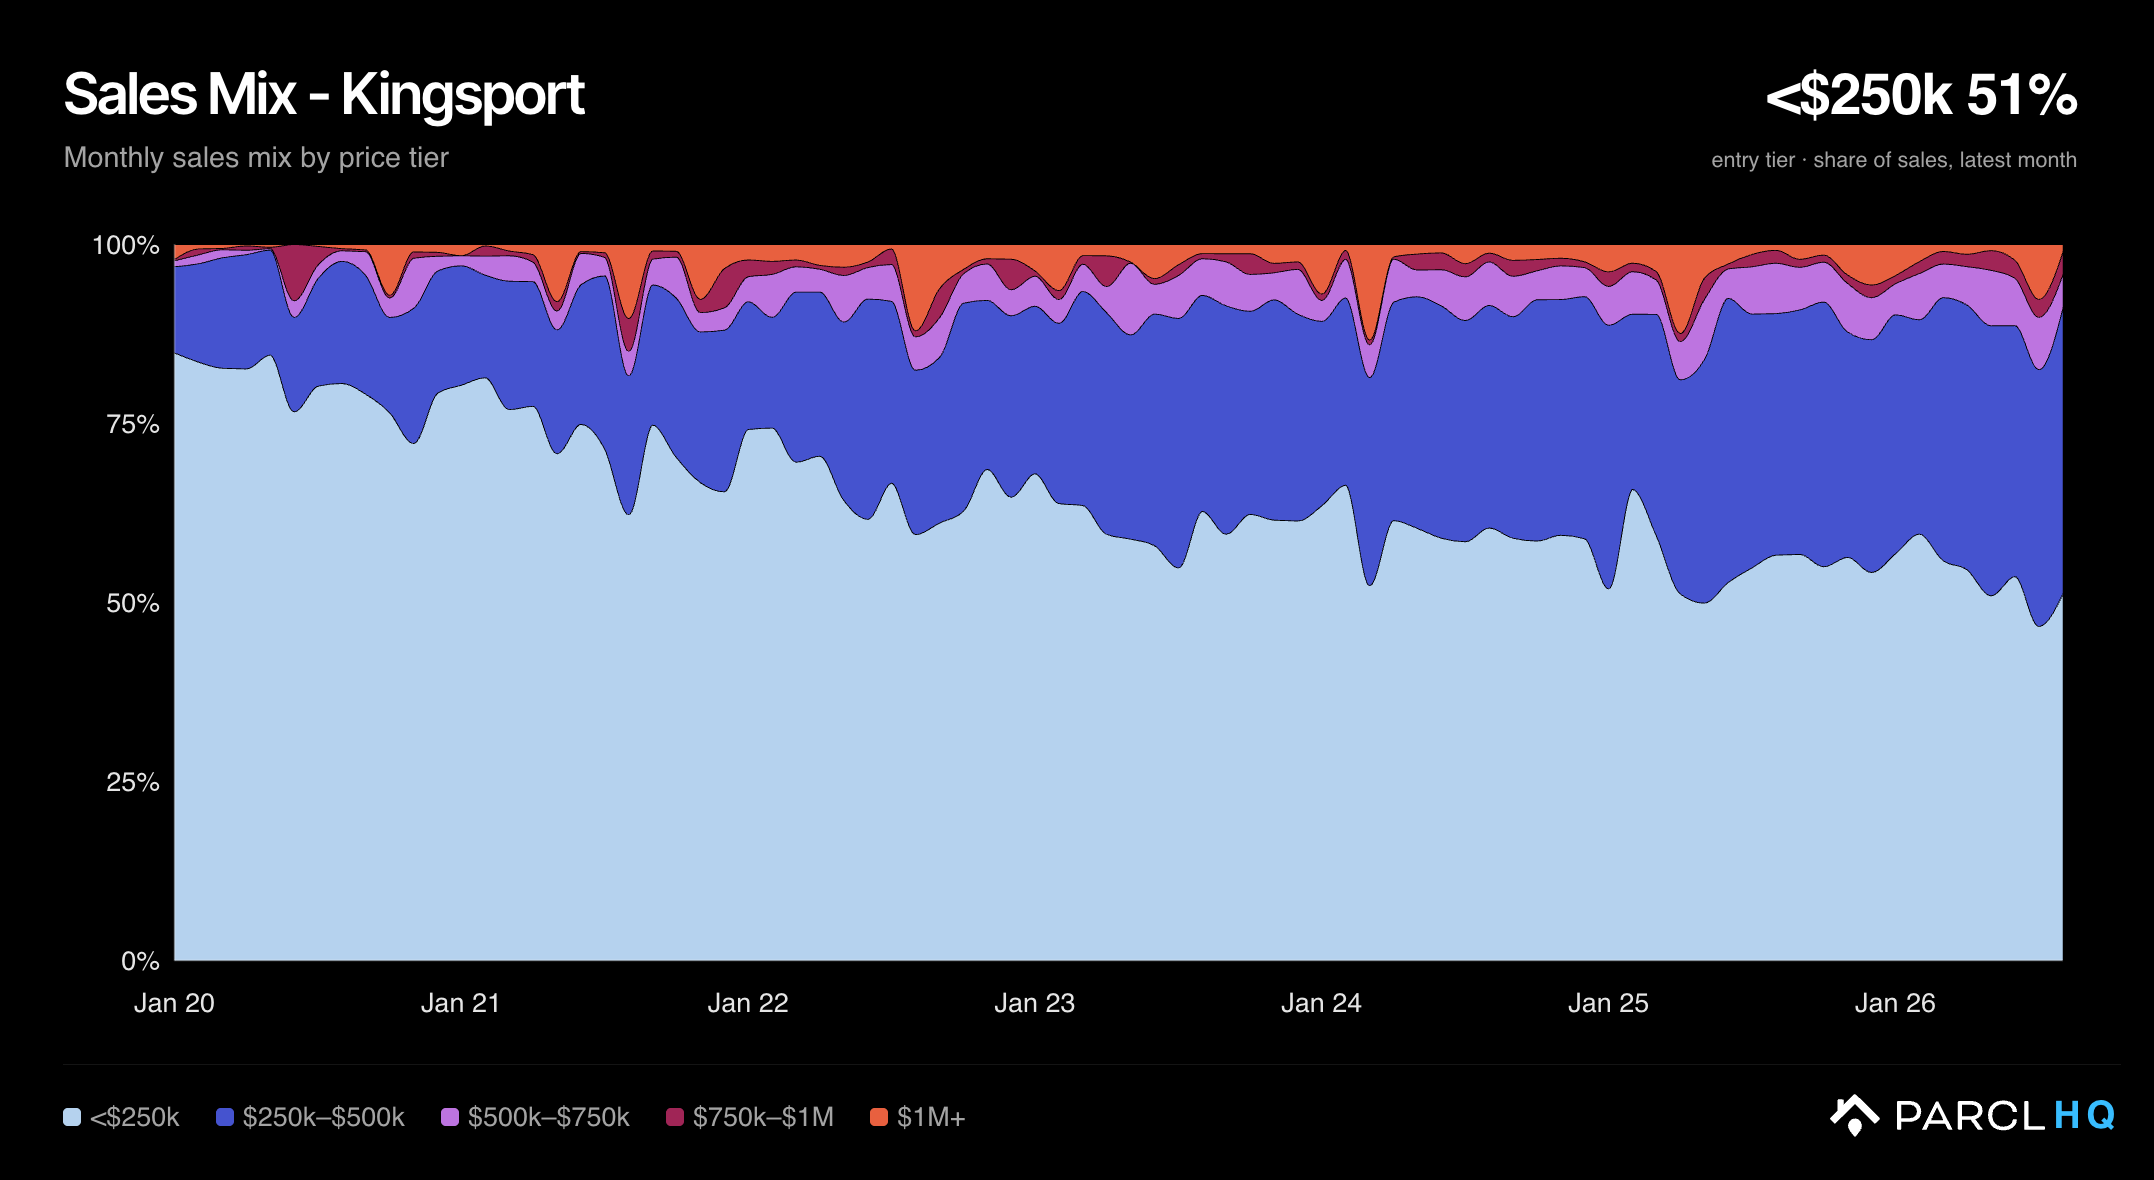
Asking prices have shifted into higher tiers faster than buyers' spending. Only 35% of Kingsport's active listings are priced under $250,000, against 51% of sales. The $250,000–$500,000 tier holds 45% of listings and 40% of sales.
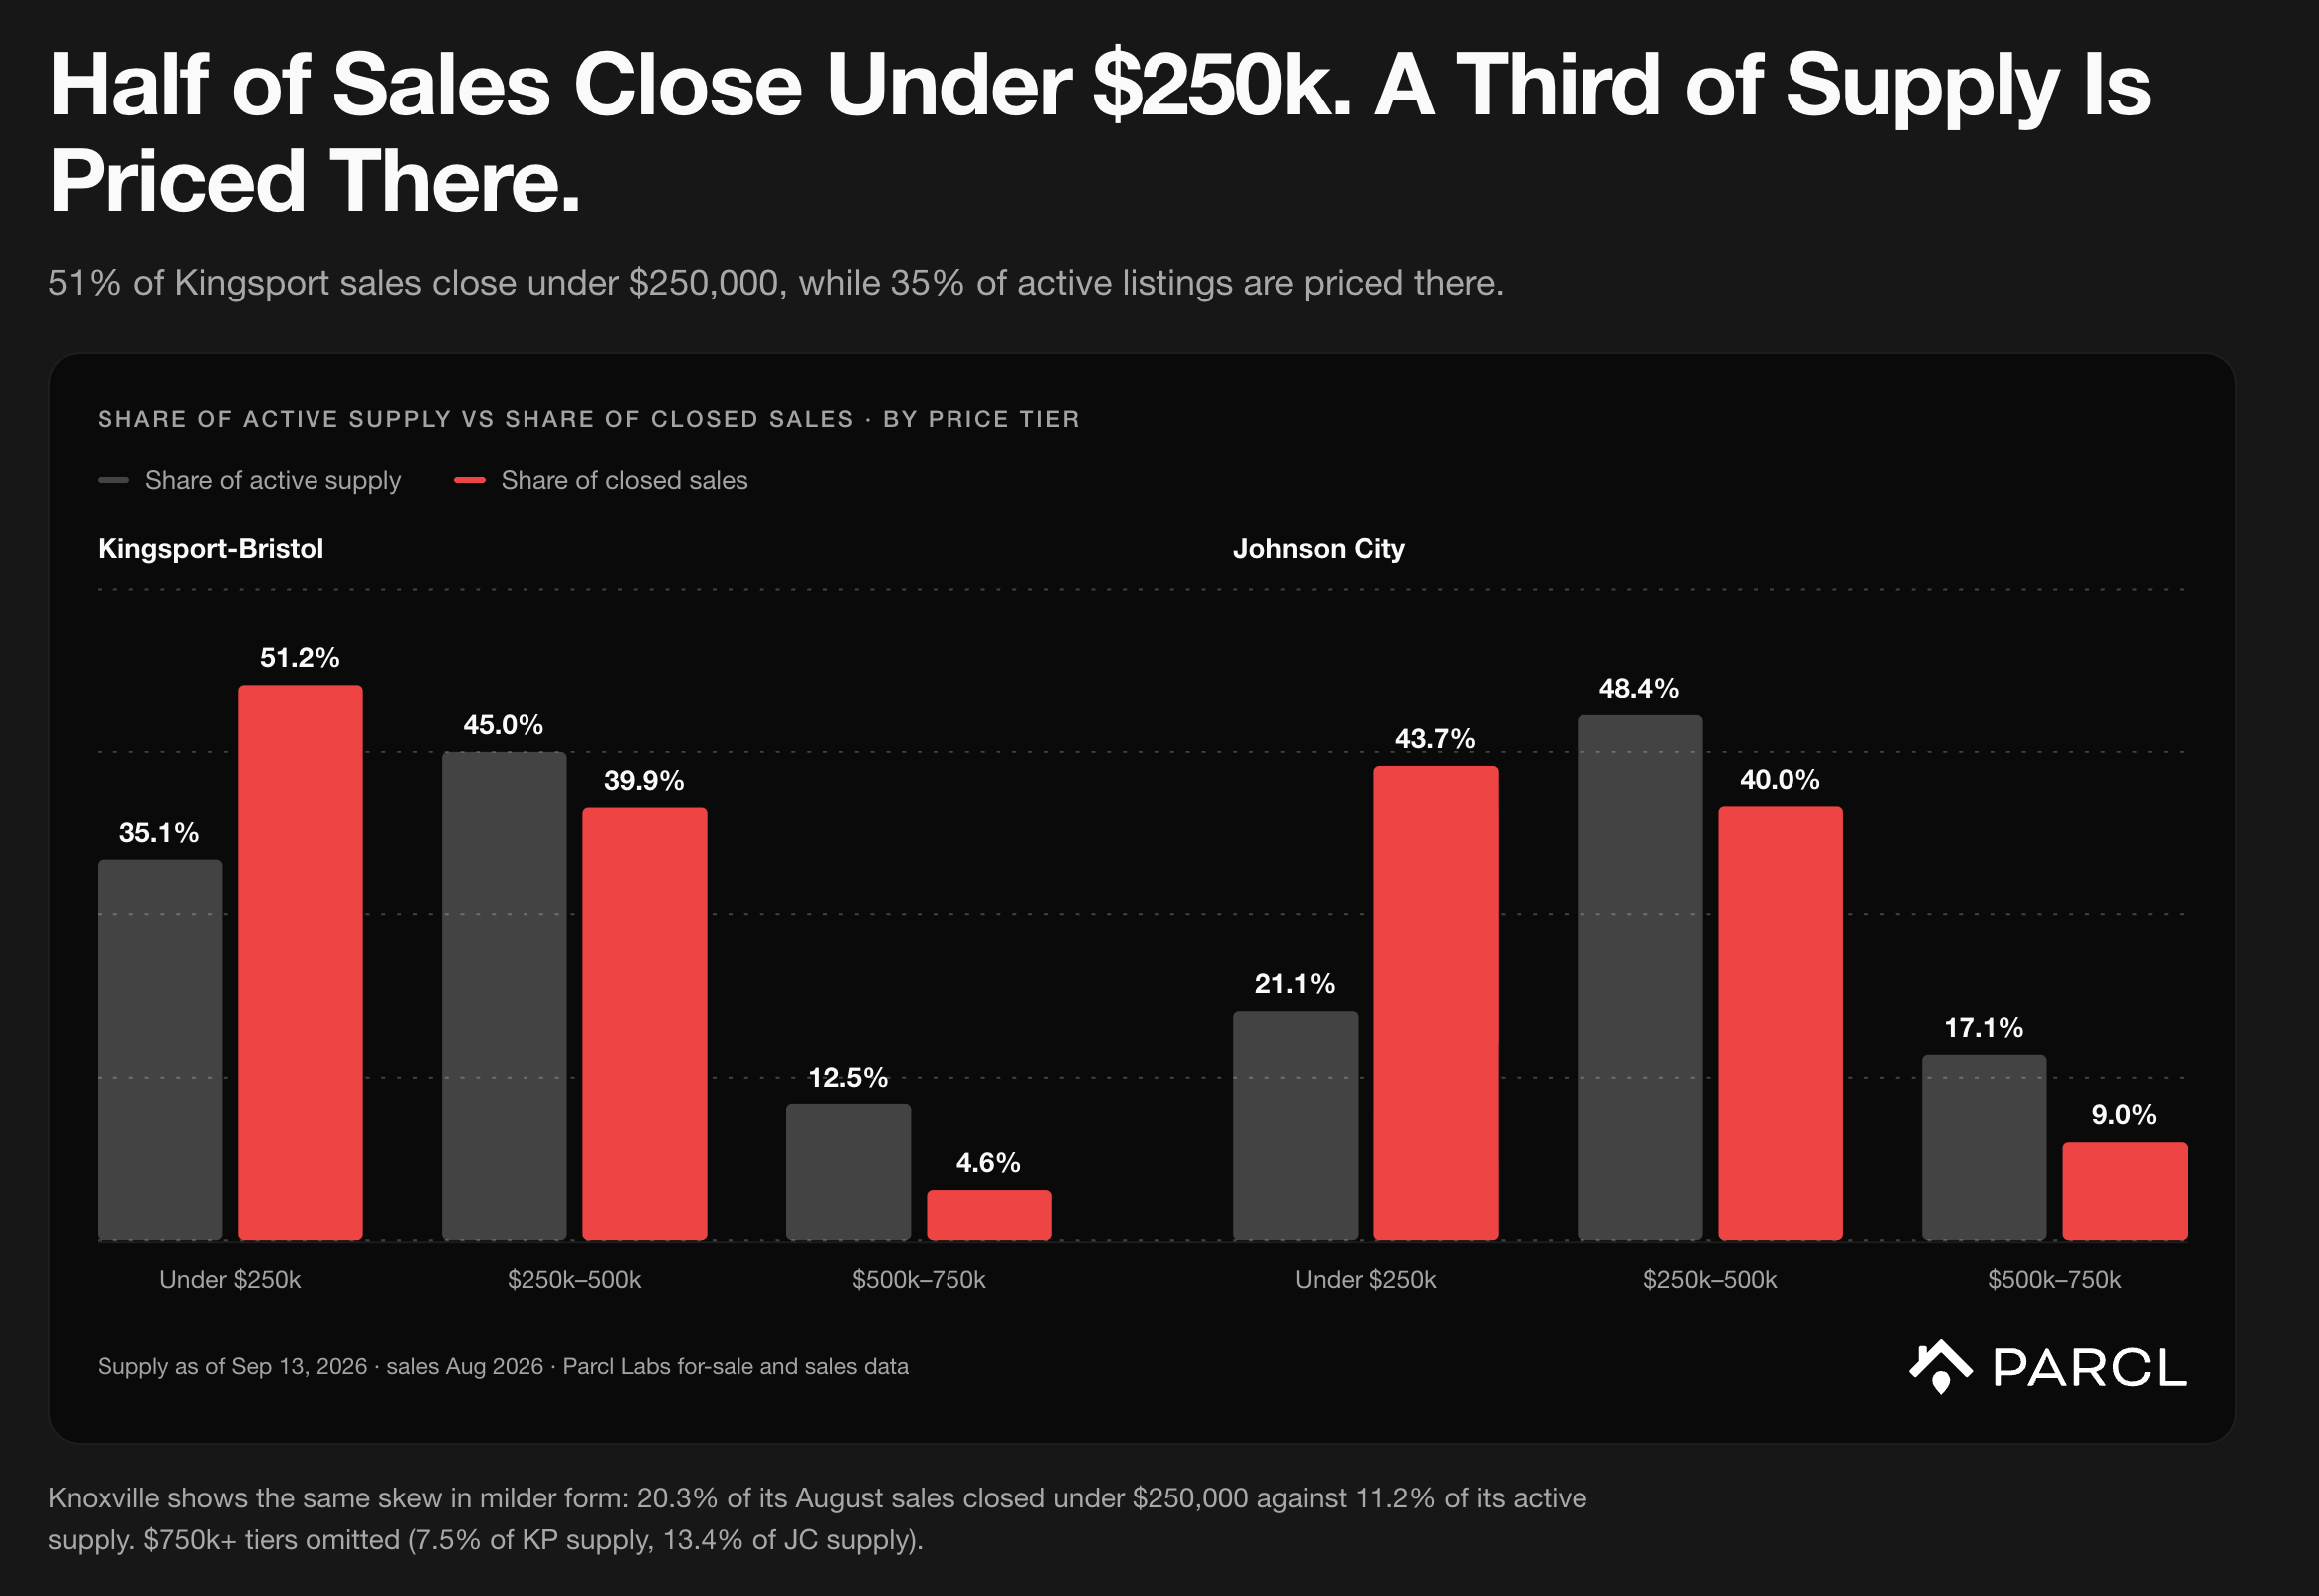
Johnson City shows the same pattern with a wider gap: 44% of its sales close under $250,000 and 21% of its listings are priced there, a 23-point difference against Kingsport's 16.
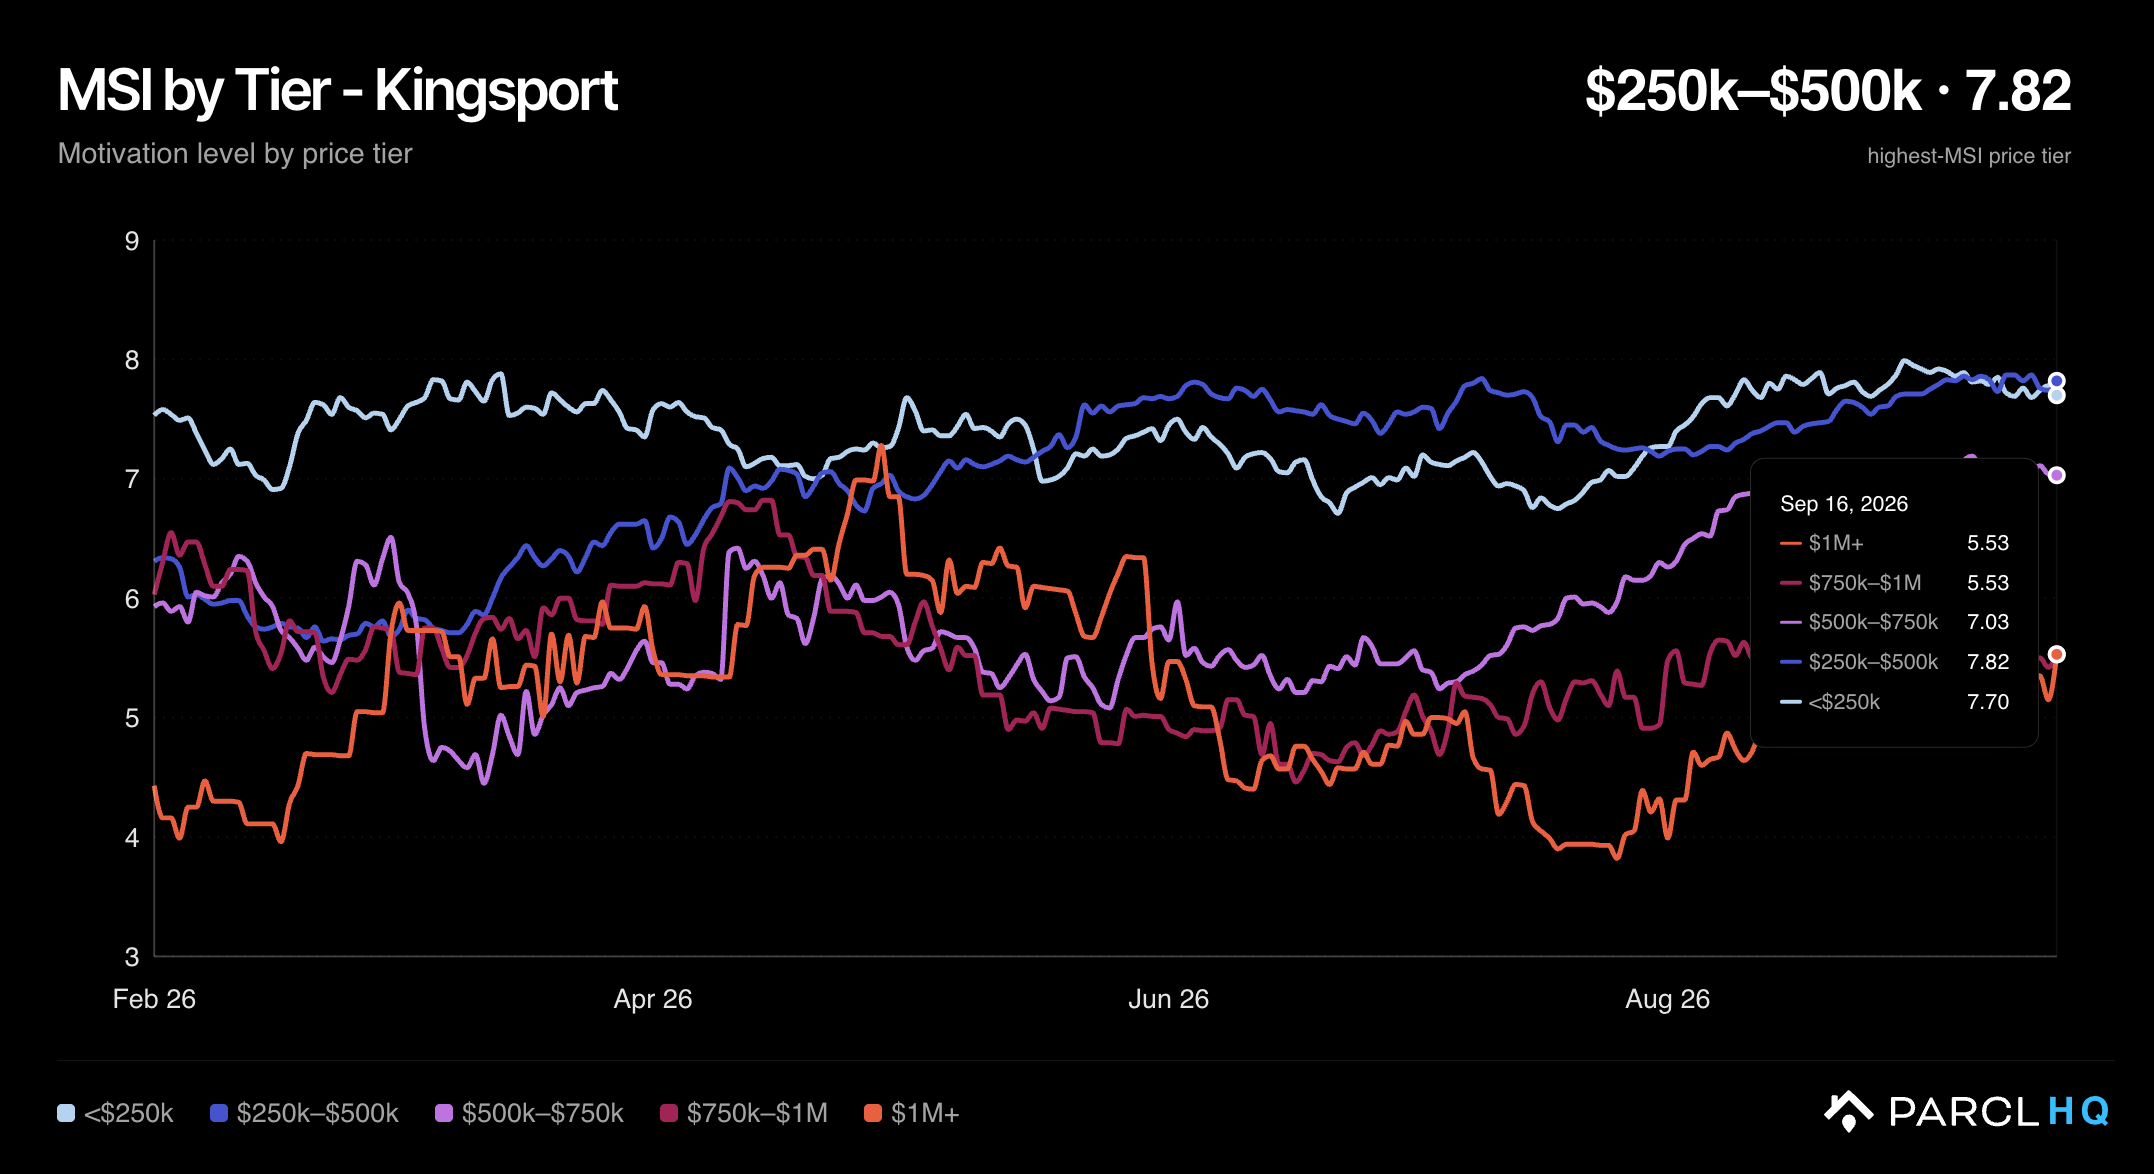
Pressure is mounting where supply and demand are mismatched. On HQ's tier panel, the $250,000–$500,000 tier carries an MSI of 7.82, the highest of any price tier in the metro (8.09 for its single-family segment), and 55% of listings in that tier have cut price. It is the first tier above the band in which half of sales close, and it is the tier into which the metro's entry-level stock has appreciated: a home that sold for $200,000 in January 2020 would be priced near $365,000 on the metro index today. More listings are priced there than current demand appears to support, and sellers in that tier are the ones adjusting.
Who Is Supplying the Listings
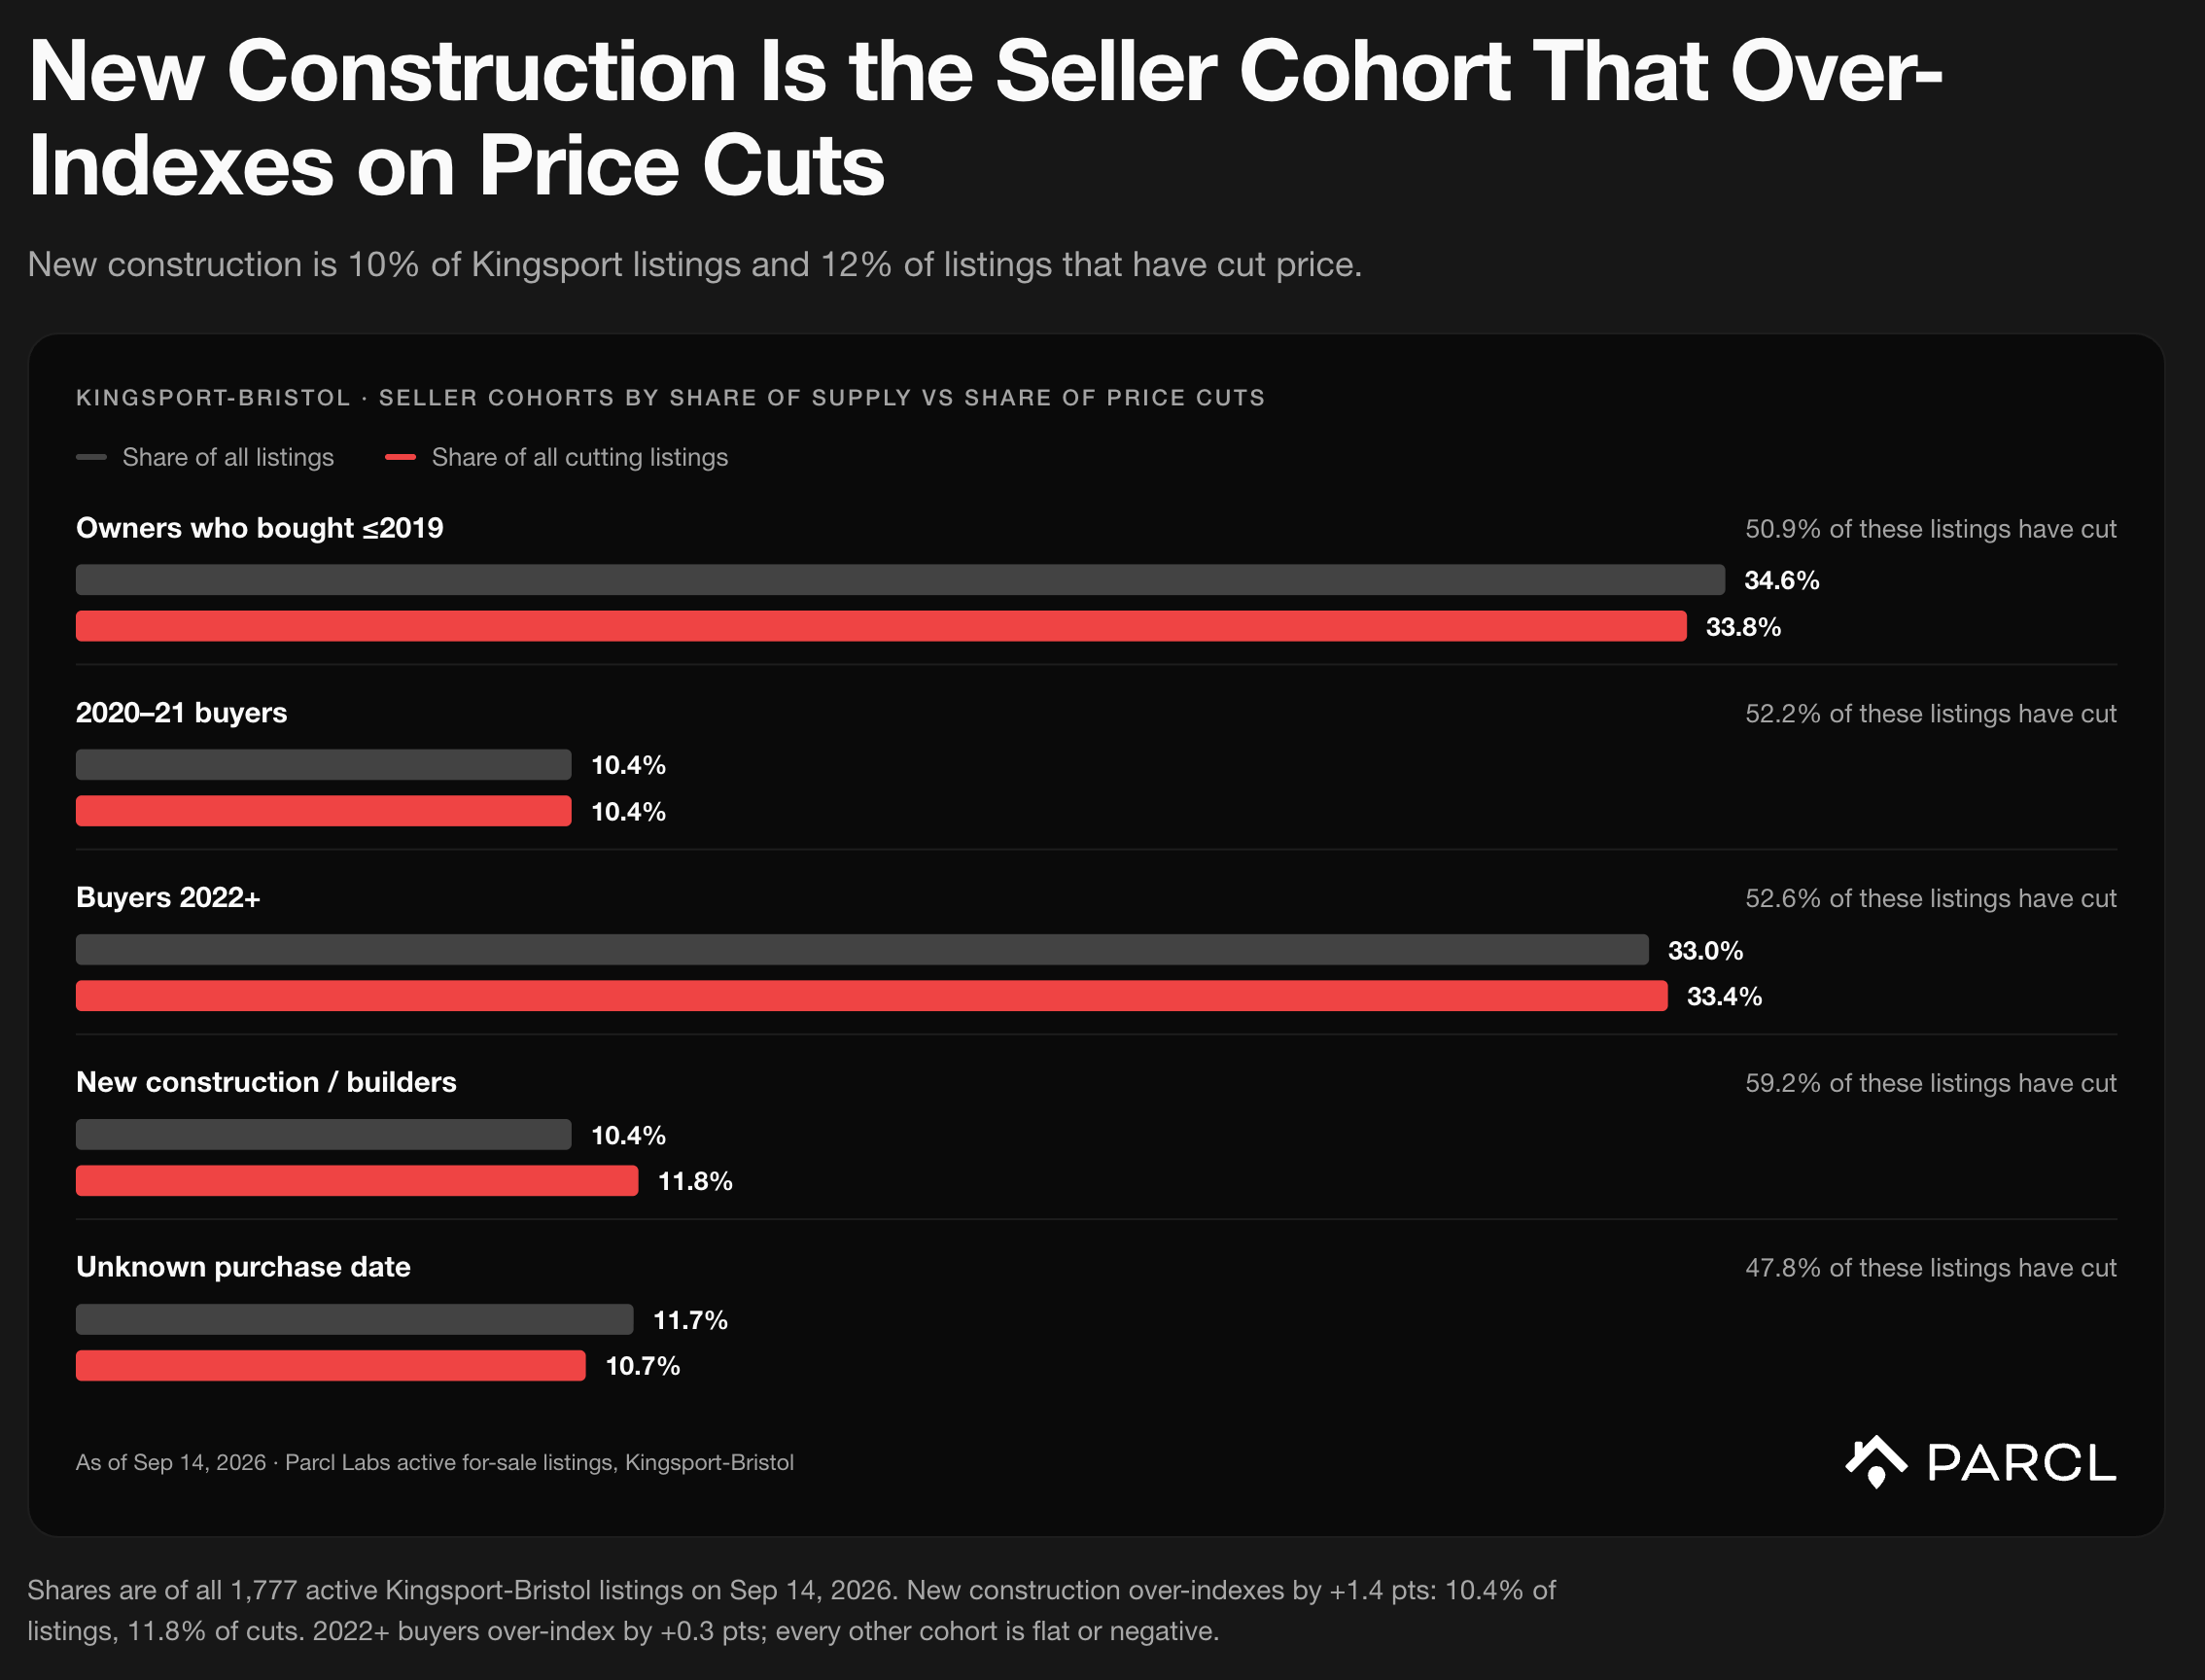
In some high-MSI markets a single group, investors for example, is the clear source of motivated supply. This is not the case in Kingsport. Its listings and its price cuts are spread across several seller cohorts with very different margins, competing for the same buyers.
Owners who bought before 2020 are 35% of active listings and 34% of cutting listings, with 51% of them having cut. Buyers from 2022 onward are 33% of listings and 33% of cutting listings, with 53% having cut. Both are within a point and a half of the metro's 52%. New construction is 10% of listings and 12% of cutting listings, with 59% having cut, the one cohort that over-indexes by a meaningful margin.
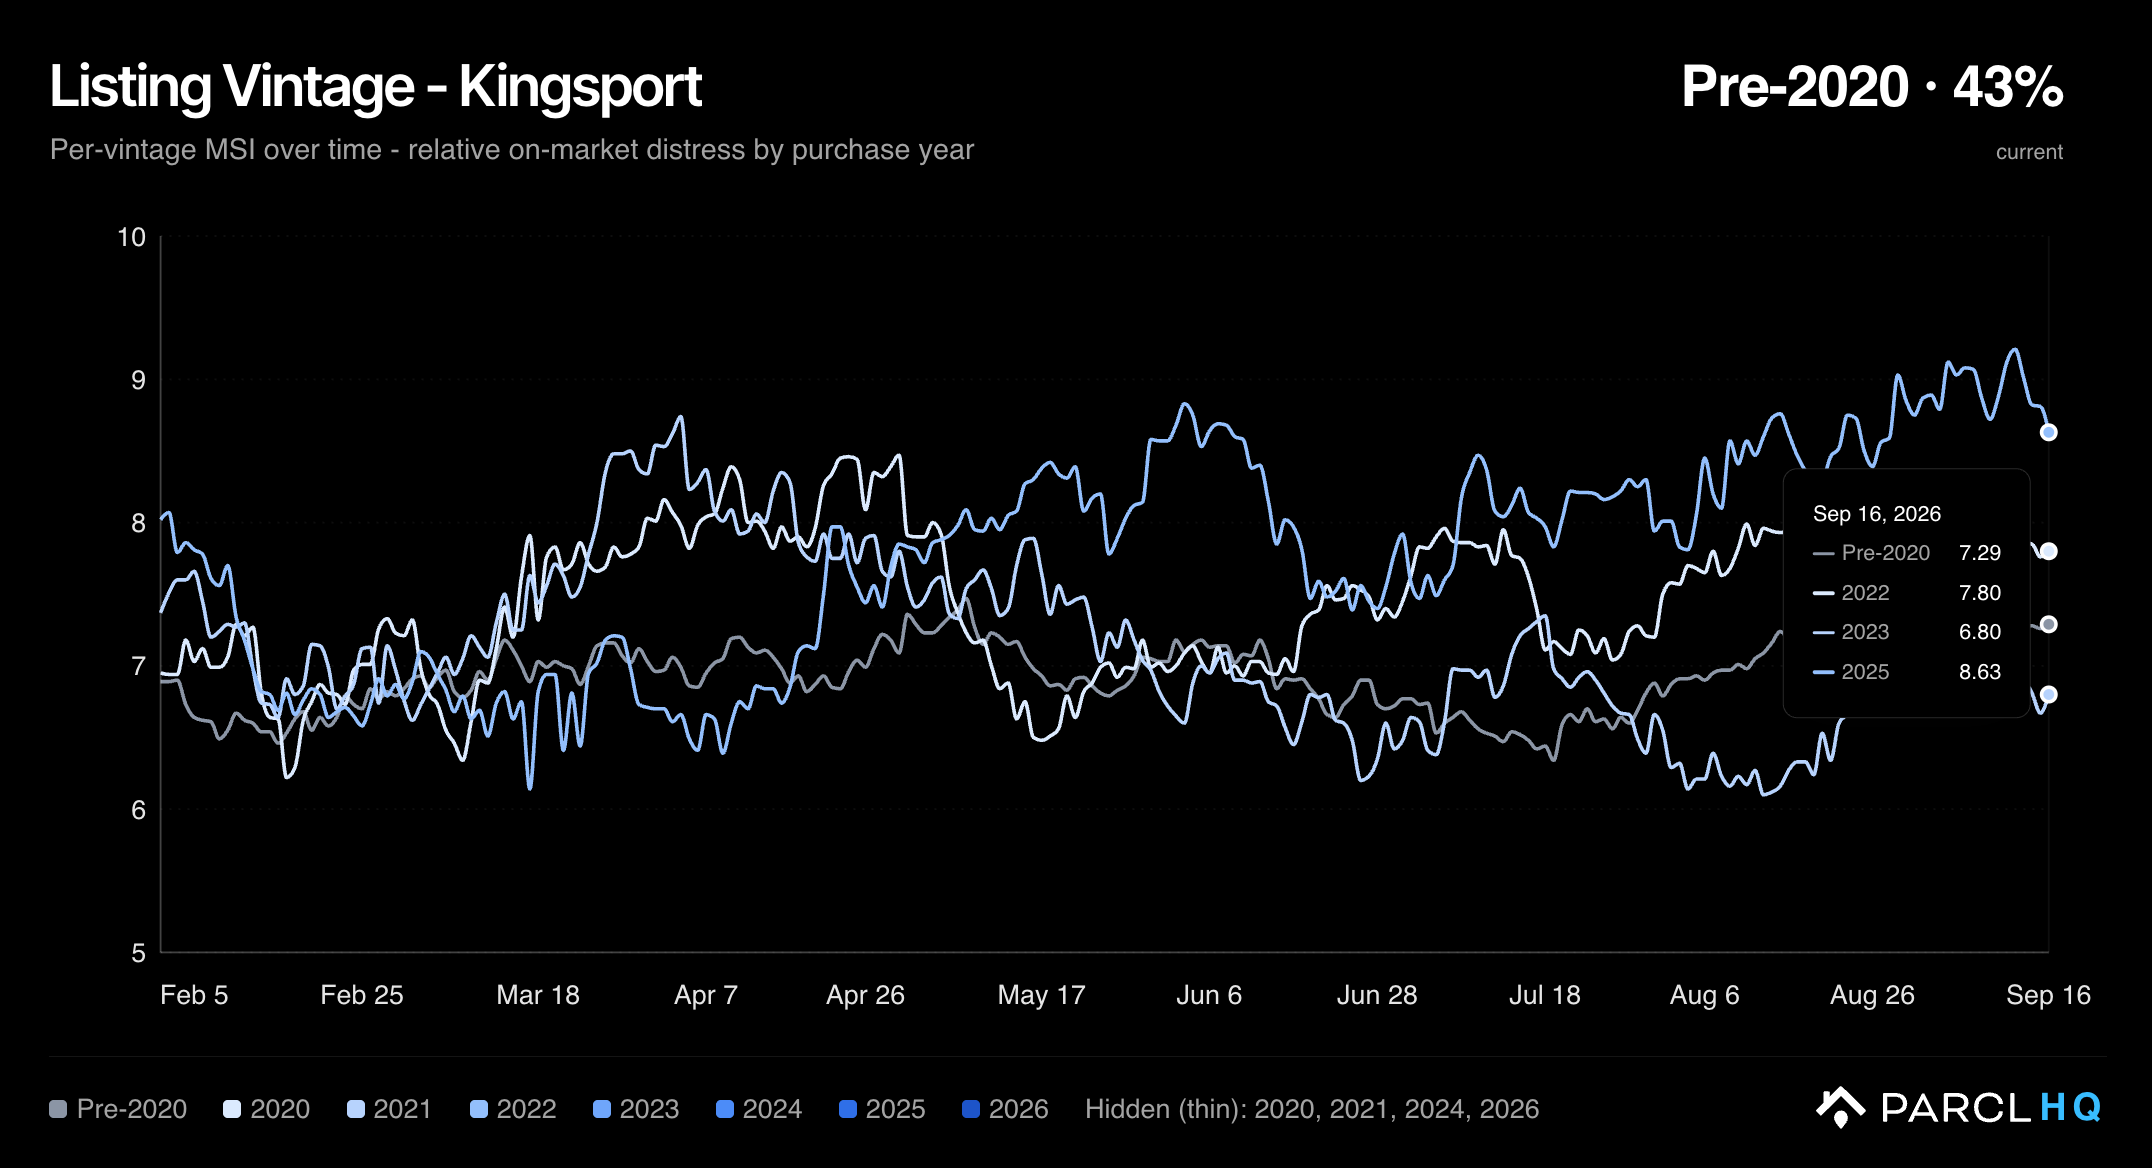
Share of cuts measures how often a cohort cuts. HQ's purchase-year panel measures how intense the price-cutting is by applying the market MSI formula to each vintage's listings and tracking it daily. Owners who bought before 2020 score 7.29, roughly the metro figure, and have held between 6.3 and 7.6 since February. The 2025 cohort scores 8.63, the highest of any vintage.
Long-tenure owners: cutting from a large cushion
Owners who bought before 2015 are 15% of Kingsport's listings. They ask a median 2.84x what they paid and, after their price cuts, hold a median paper gain of $193,500. A median price cut in this cohort consumes 9% of the owner's paper gain, and 11% of those who cut have given up more than a quarter of it. 49% of these owners have cut, slightly below the metro rate. They are not the source of elevated motivation, but they are the cohort with the most room to adjust downward.
Recent buyers: thinner margins, higher payments, twice the listing rate
Buyers from 2022 onward are 33% of listings. Those who bought in 2022–23 ask a median 1.28x what they paid, with a median paper gain of $64,250; for 2024–26 buyers it is 1.27x and $62,000. Among 2024–26 buyers, 26% have less than 10% of margin left after cuts, against 1.5% of pre-2015 owners. Their median loan-to-value is 0.71, and 36% owe more than 80% of their asking price. A price cut costs this cohort far more of its gain. A 2022–23 buyer who cuts gives up a median 22% of paper gain, and 44% have given up more than a quarter.
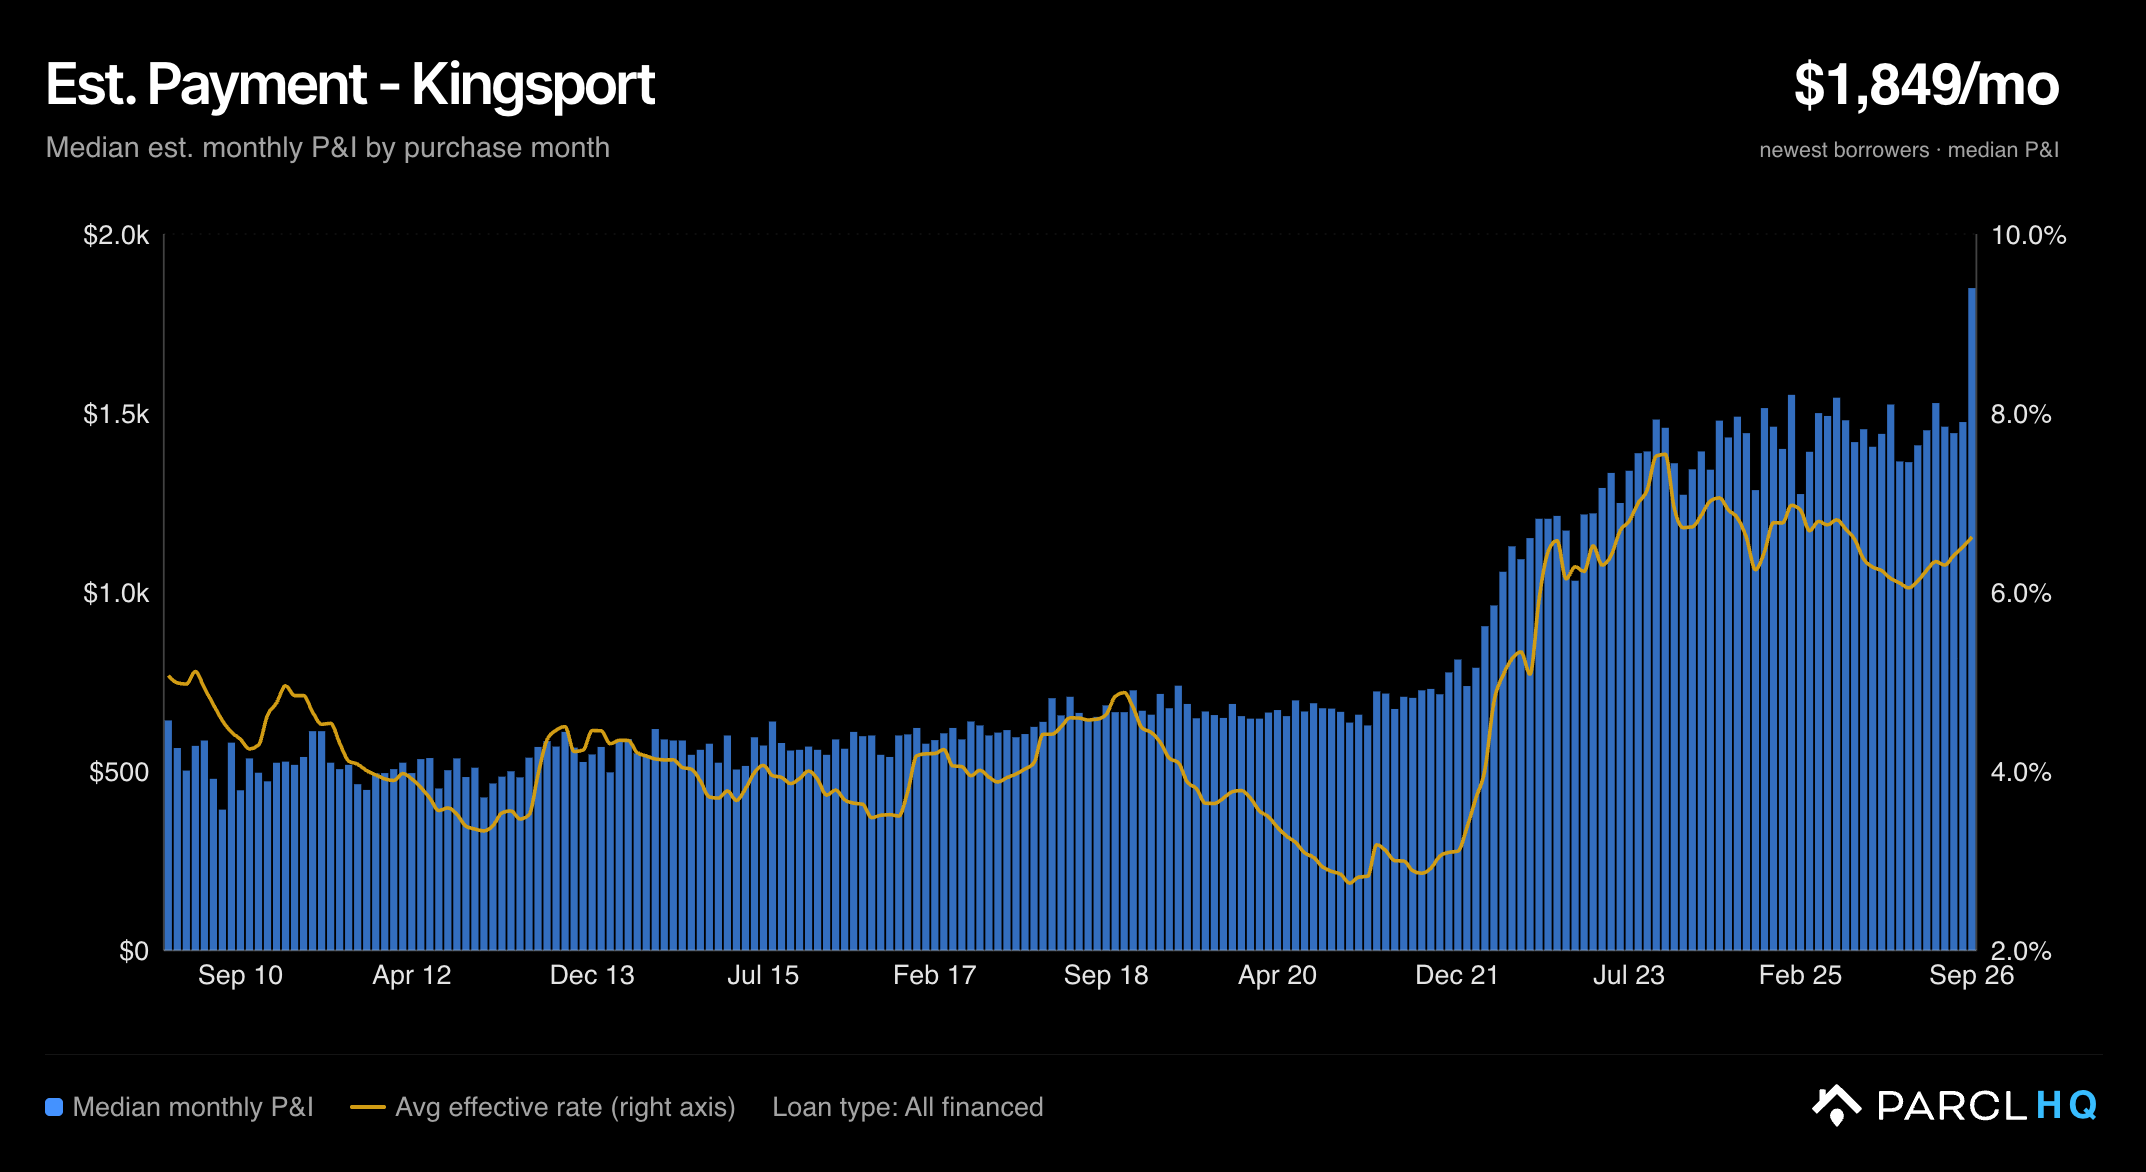
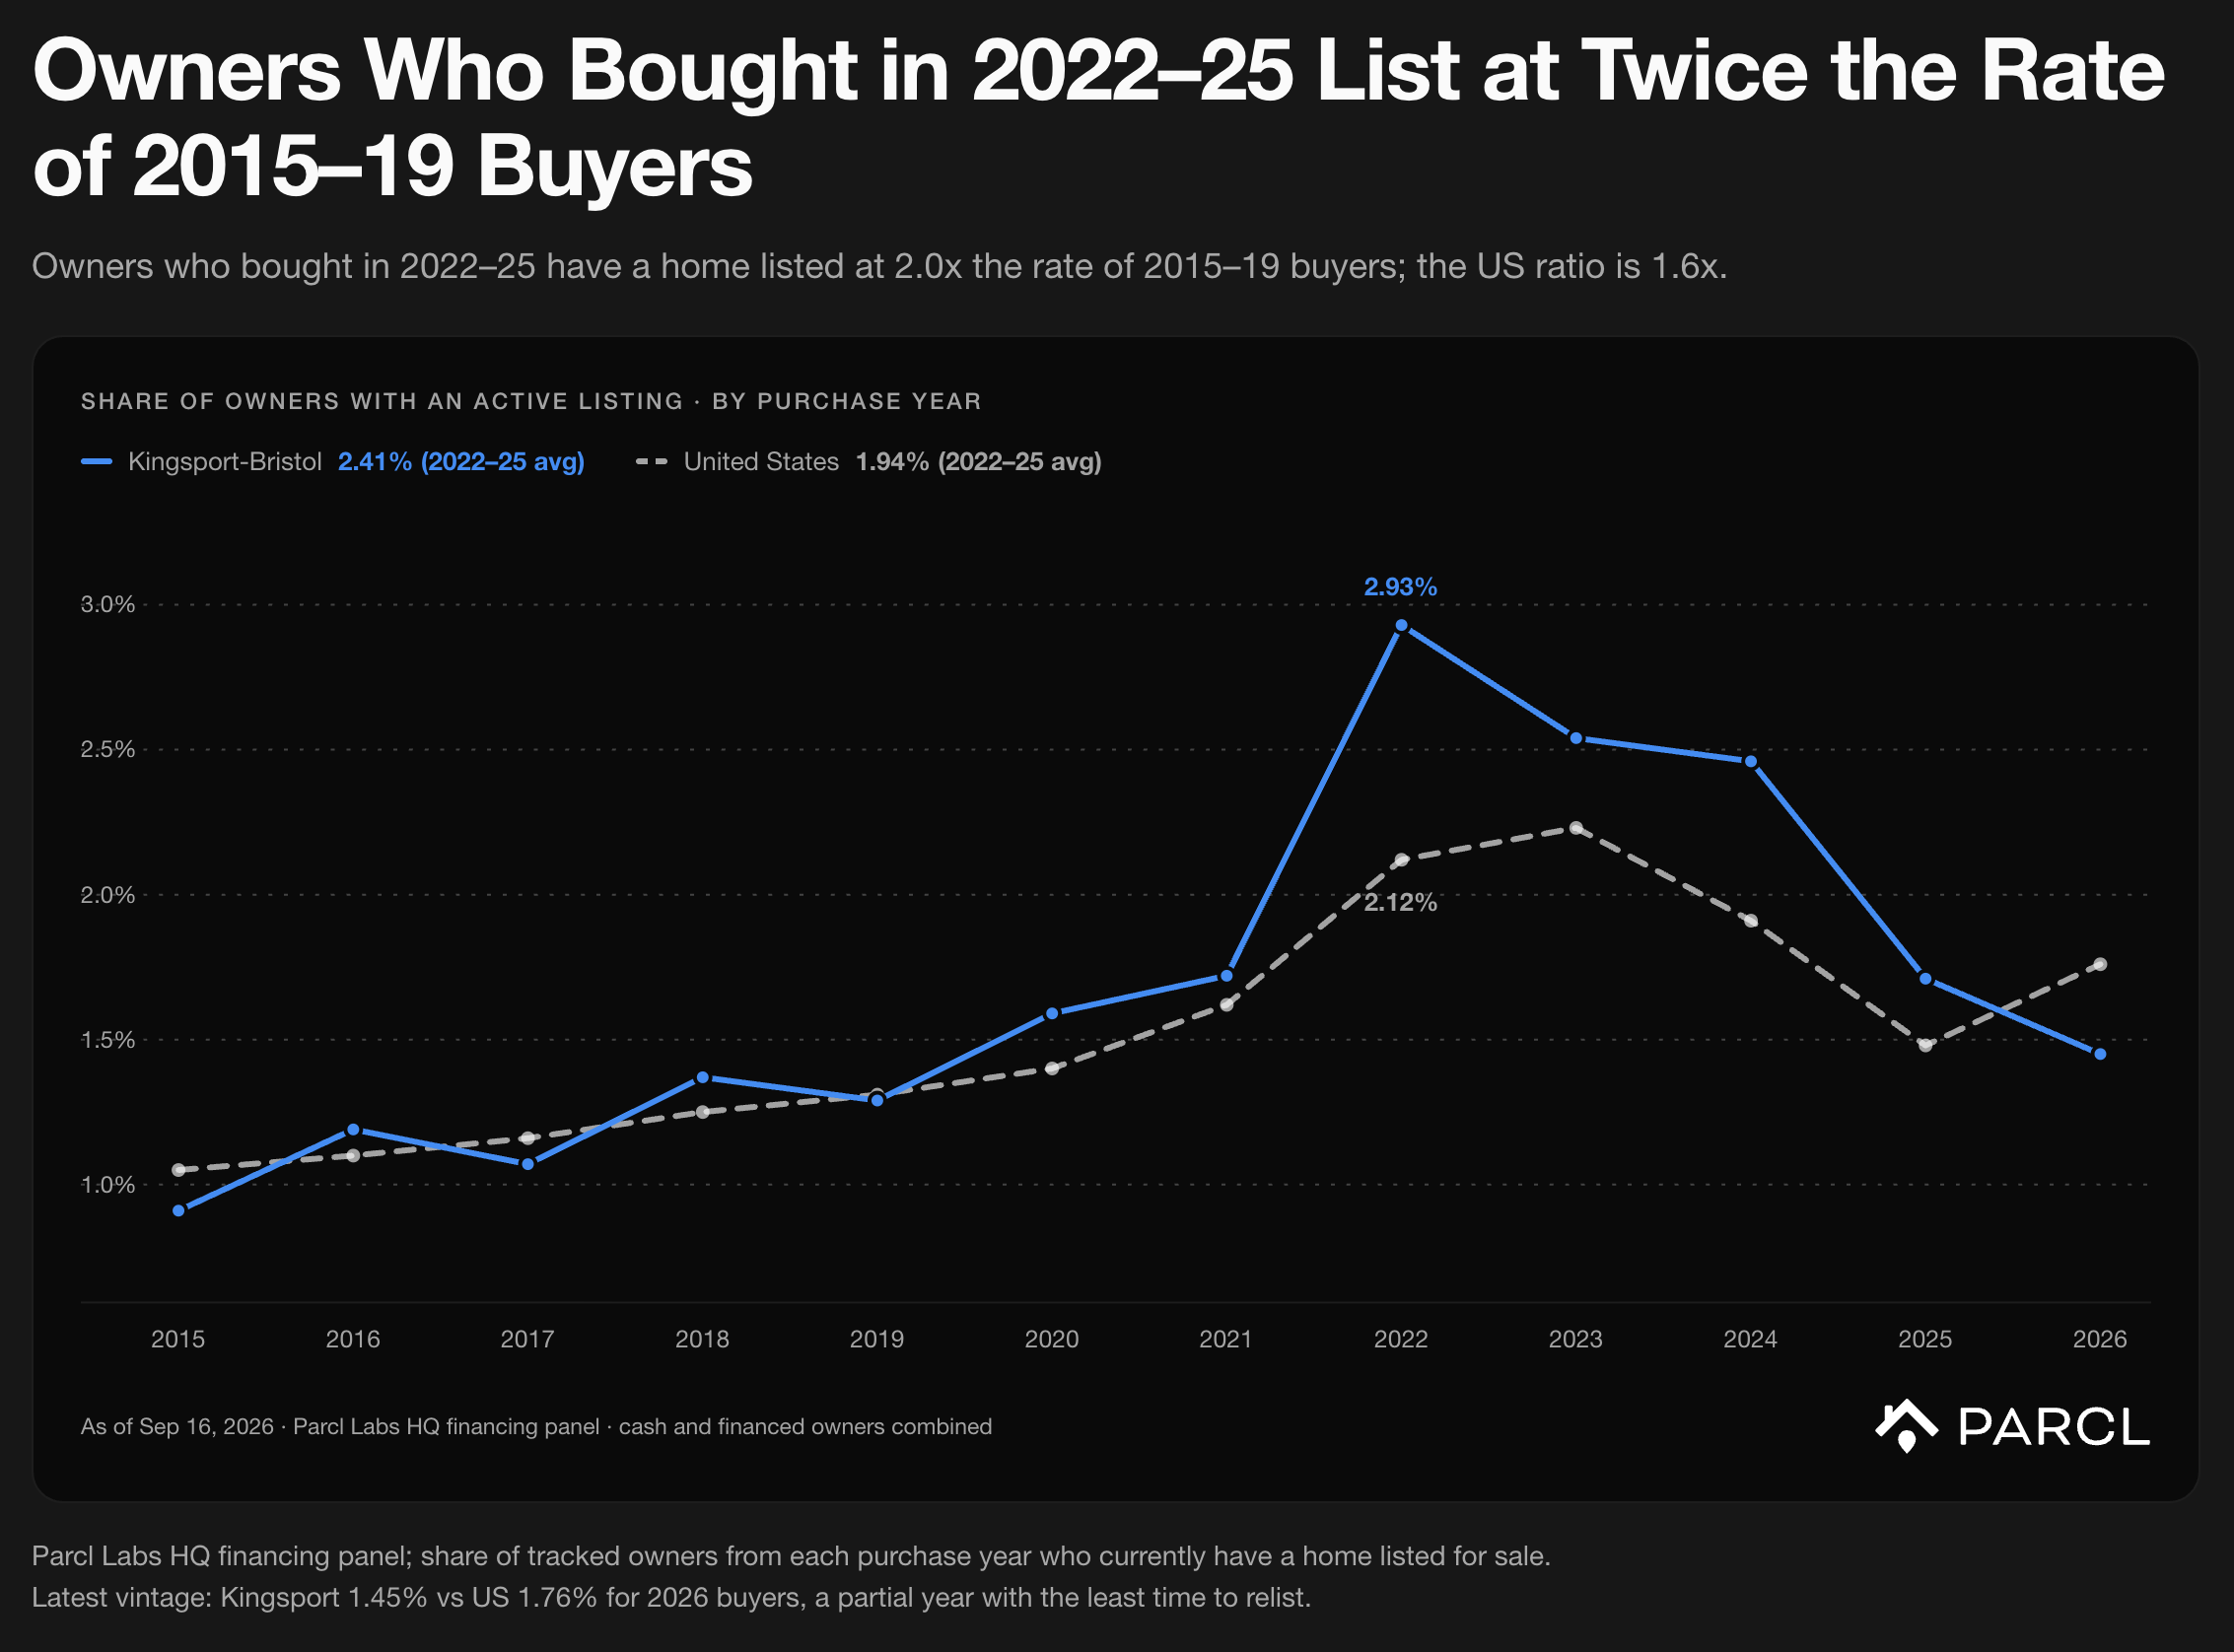
The financing panel shows the carrying-cost difference behind this cohort's higher listing rate. Among Kingsport owners with a mortgage, a 2021 buyer carries a median monthly principal-and-interest payment of $721 at a 2.98% effective rate. A 2025 buyer carries $1,485 at 6.59%, on a home that has appreciated 3% since purchase. Owners who bought in 2022–25 have a home listed at 2x the rate of owners who bought in 2015–19. For the US the same ratio is 1.6x; for the other East Tennessee metros it is between 2x and 2.4x. The higher listing rate among recent buyers is regional, not specific to Kingsport*.*
Recent buyers are not underwater in meaningful numbers: 6% of Kingsport's 2024–26 sellers ask below purchase, and 1% of Kingsport owners who bought in 2024 owe more than their home is worth, against 7.6% for the US. While the margin pressure is real, Kingsport's motivation does not appear to be a solvency problem.
Builders: the cohort over-indexing on cuts
New construction is 10% of Kingsport's active listings and 12% of its cutting listings. 59% of new-construction listings have cut price, against 51% of existing homes. Median days on market is 74 against 60, and the segment's MSI of 8.31 is the highest of any property type in the metro. On HQ's daily series the new construction segment has run above the metro since early July, and the gap has widened through September.
A builder's price cut carries more information than an owner's. Builders typically work through incentives first: rate buydowns, closing-cost credits, upgrades, etc. A reduction to list price usually means those levers have been used and the unit still has not moved. By that standard, a 59% cut rate in this segment represents more motivation than the same figure among existing-home sellers.
D.R. Horton, the largest homebuilder in the country, is also the largest single builder in Kingsport's new-construction pool, and its listings are where the segment's cutting is most concentrated. ~96% of D.R. Horton homes matched to active Kingsport listings have cut price, at an average of 2.2 cuts each and a median asking price of $239,900. Most are in the Fieldcrest Acres townhome and single-family communities in Blountville. On HQ's homes view, Fieldcrest Acres registers as a price-cut hotspot: 26 homes in the cluster have cut, 89% of its listings, at an average of 7.6% off, against 52% for the market. These communities appear to have been planned and priced during the run-up and are being sold into the adjustment. 60% of the D.R. Horton homes are priced under $250,000, the tier in which half of the metro's sales close. Priced where the demand is, they are still cutting.
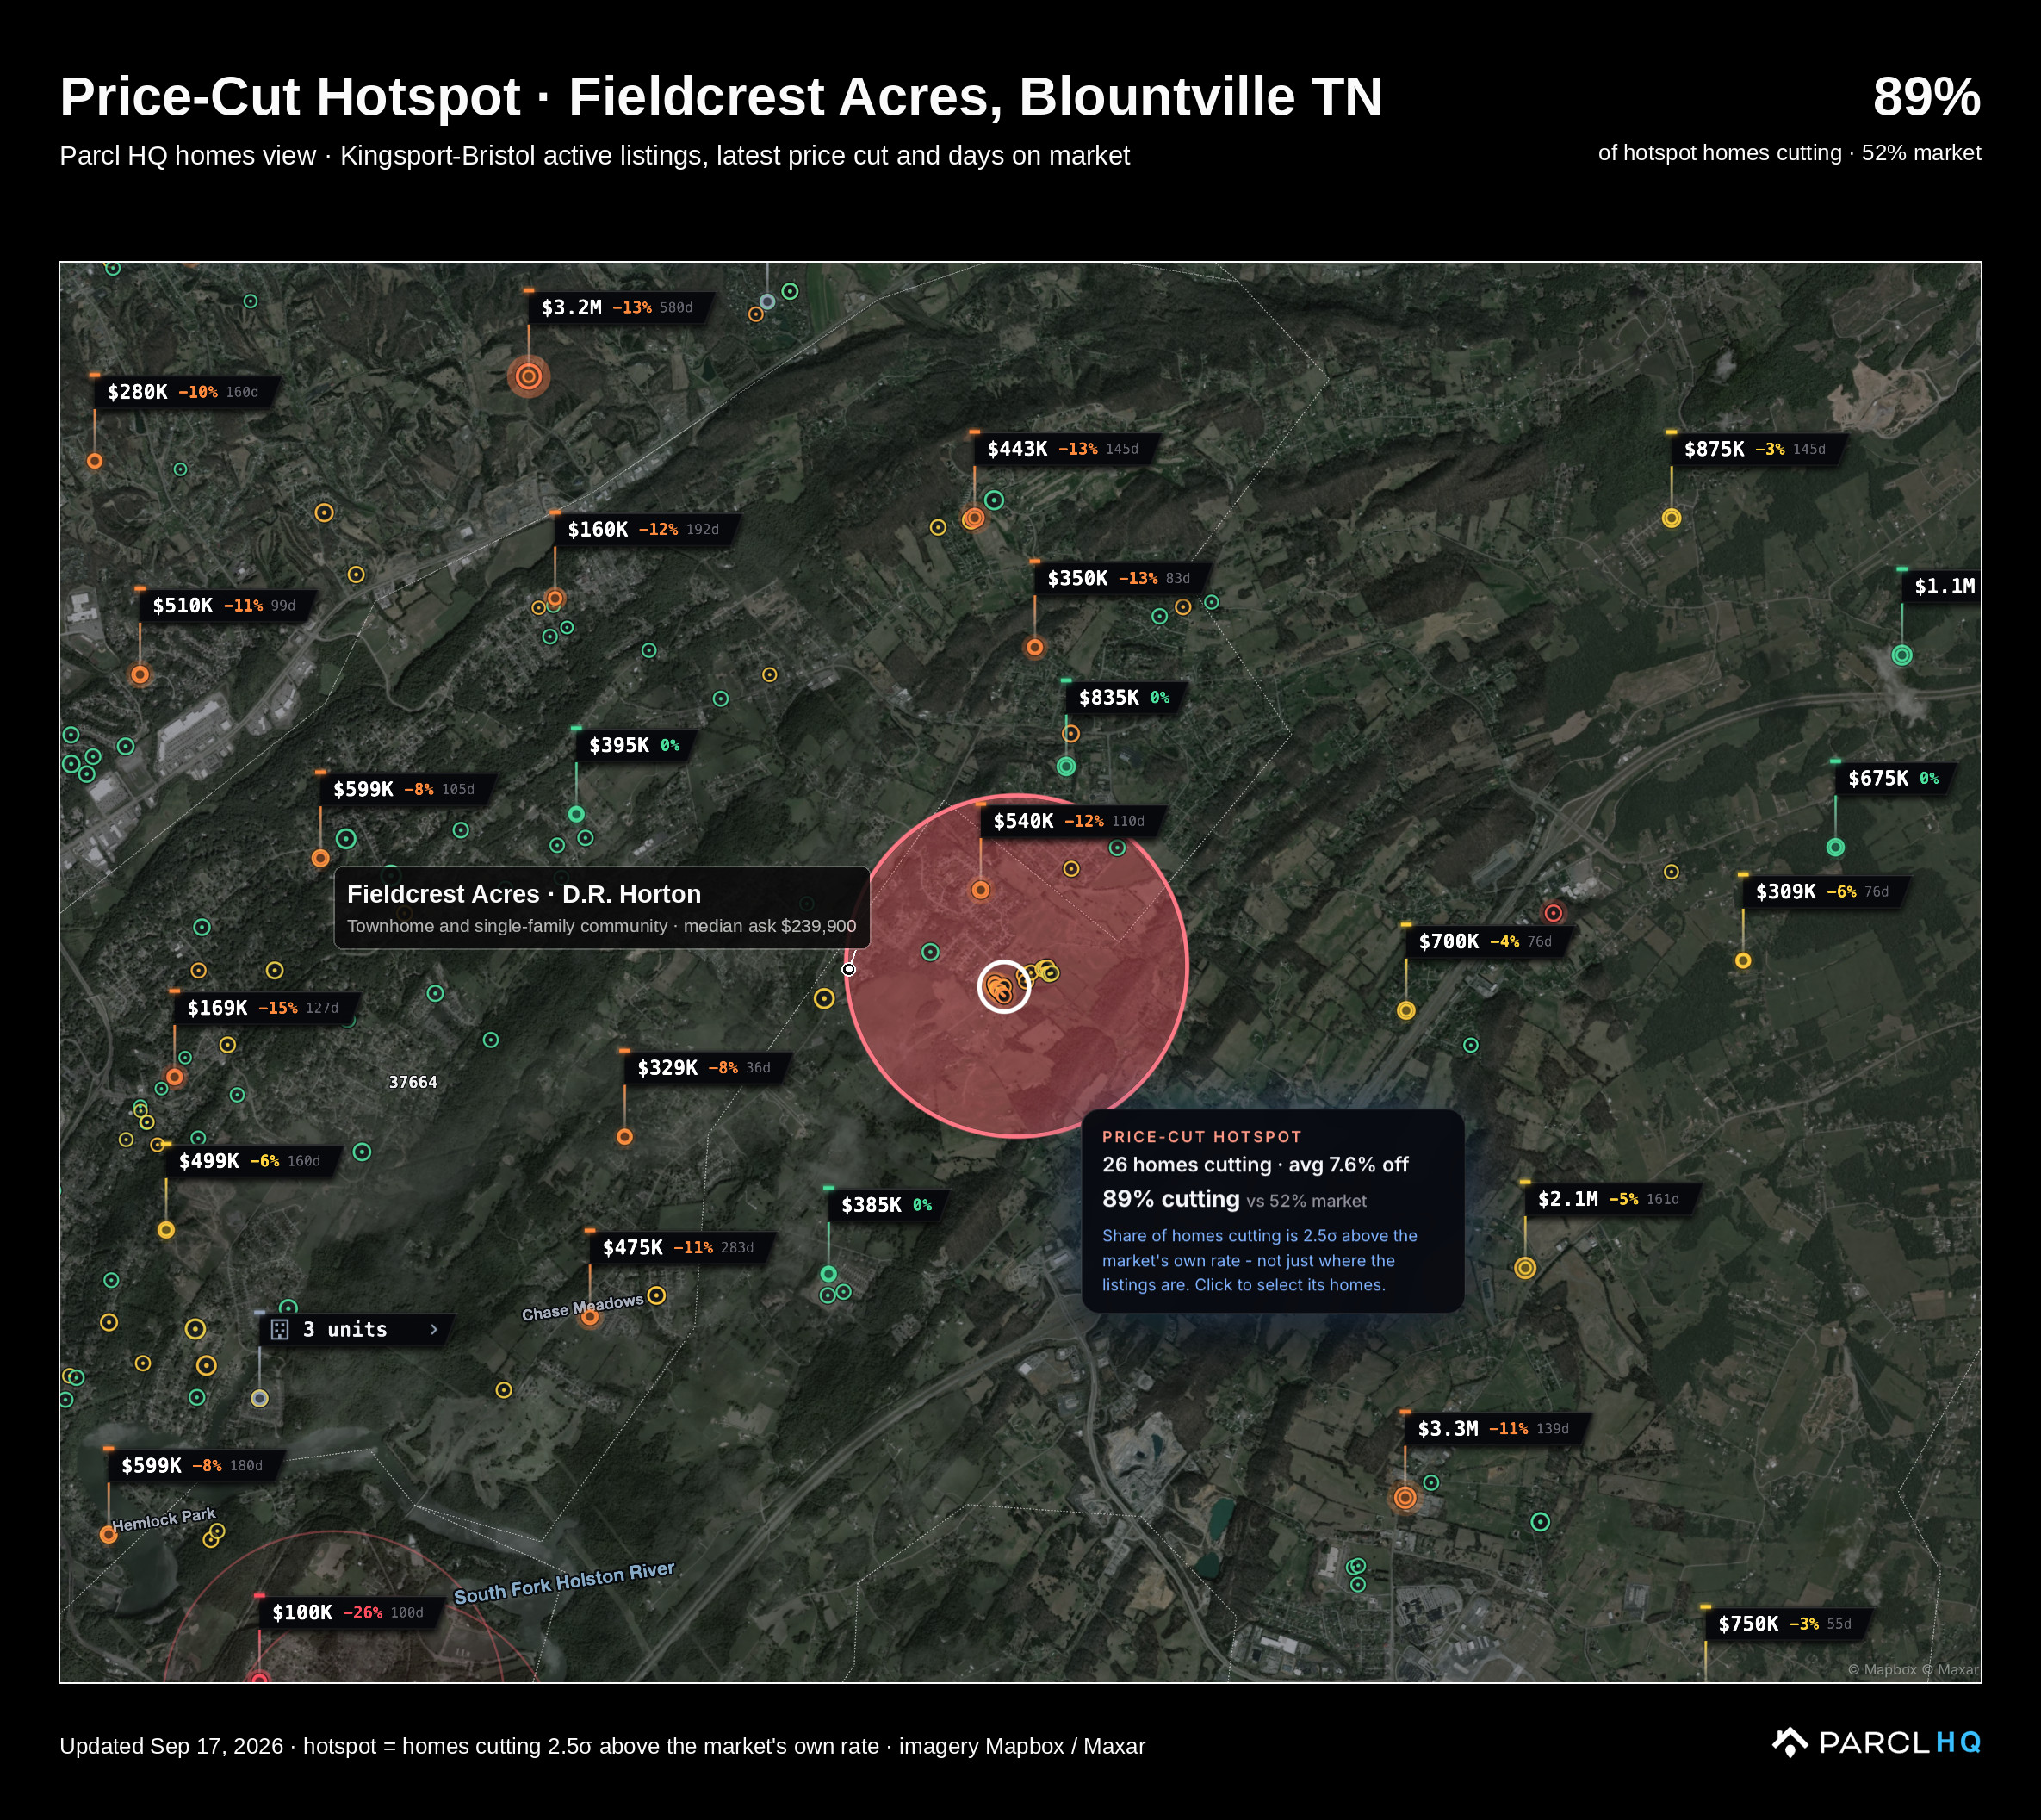
D.R. Horton is not the only builder cutting prices in Kingsport. Regional and local builders make up the rest of Kingsport's new-construction listings, and roughly half of those have cut as well.
What We're Watching Next
Kingsport's elevated seller motivation appears consistent with expectations adjusting after six years of rapid appreciation, with limited evidence of widespread financial distress. We are watching how much further those asking-price reductions carry through to sale prices and erode recent buyers' equity.
Half of listings have cut price, and 64% of Kingsport sales over the trailing 90 days closed below the final asking price. The price index is now 1.8% below its June 25, 2026 peak. Sellers are making concessions to close transactions, but the decline in the broader index remains modest.
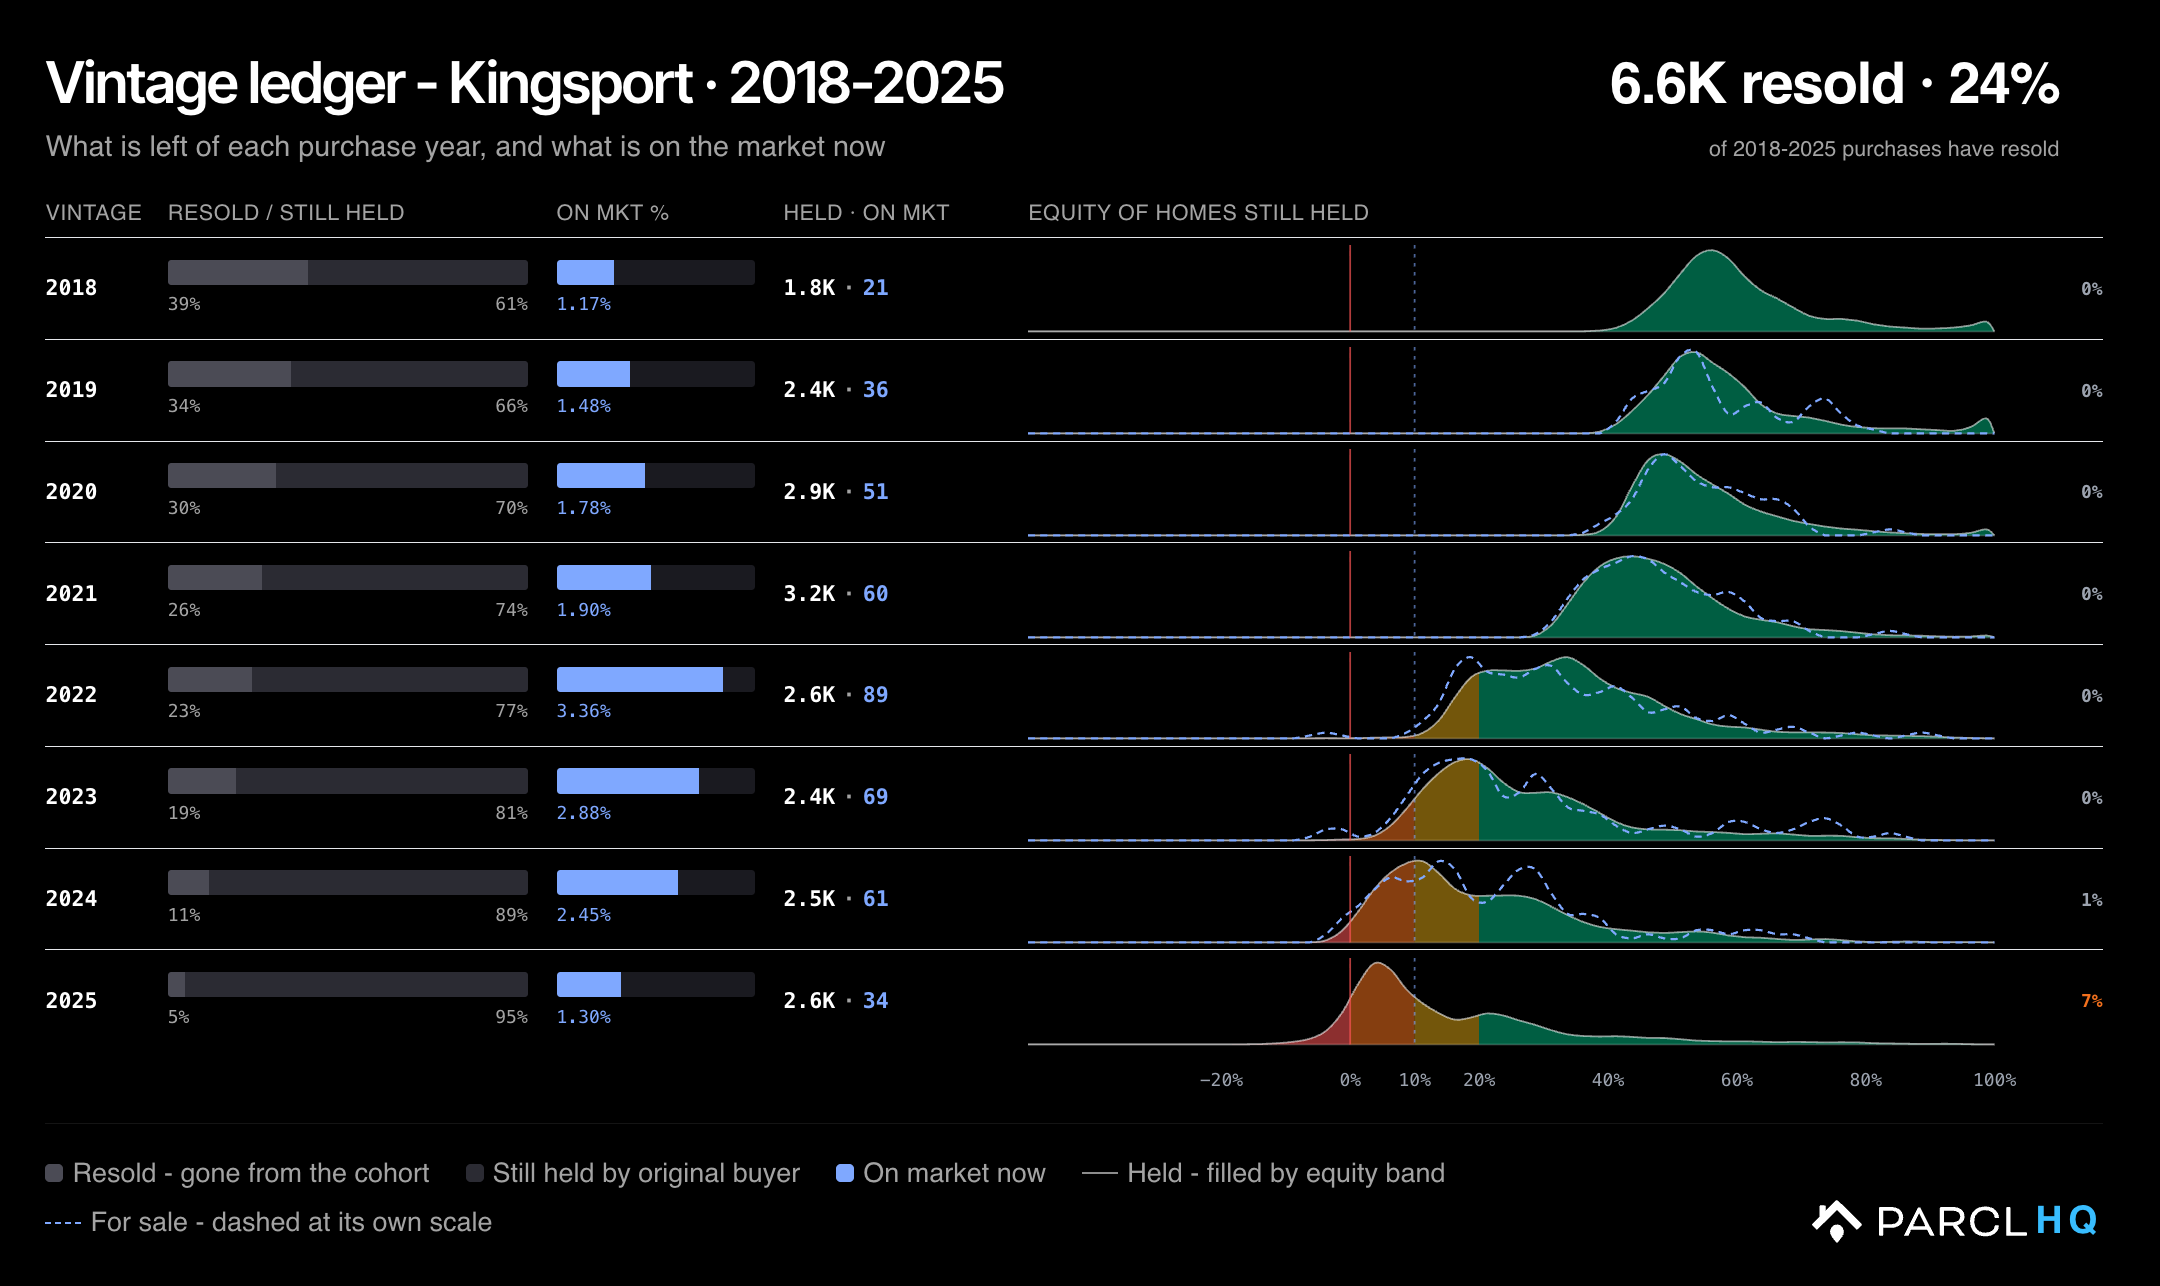
Further declines would leave the newest buyers most exposed. On HQ's financing panel, 7.1% of Kingsport owners with a mortgage who bought in 2025 and 13.6% of those who bought in 2026 already owe more than their home's estimated value, whether or not they are listed. The corresponding share is below 1% for each purchase year from 2021 through 2024. Negative equity is concentrated among the last two purchase years, whose owners bought at elevated prices and have had little time to build a cushion against declines.
The equity distributions below show how that cushion narrows across purchase years. Tracking these balances alongside the share of owners listing will help reveal whether falling prices coincide with more selling among recent buyers.
Parcl HQ updates these series daily. We will revisit prices, equity, and listing activity as the fall selling season progresses. Join us in monitoring the situation in Kingsport live in Parcl HQ.


Follow Us for More