
How Real Estate Agents Use Parcl: Guide to Winning Your Market
Aug 25, 2026 · 13 min read
How agents use Parcl to spot market shifts, price with confidence, uncover seller leads, create standout marketing, and power AI with trusted housing data.

Parcl Now Meets Real Estate Agents Where They Work
Real estate agents have been among Parcl's most active and engaged community members since day one. They come to Parcl for real-time insights, granular local detail, and an independent read on the housing market. These benefits resonate with agents who are tired of relying on lagged, high-level data from the same platforms that sell them ads.
Until recently, however, accessing Parcl data required technical skills and the ability to work through our API. As a result, many agents could see Parcl's value but had no practical way to apply it in their day-to-day work.
That technical barrier is now gone. provides an intuitive, interactive research experience. brings Parcl into Claude and ChatGPT, where agents can analyze markets and properties in plain English.
As our data has become more accessible, agents are increasingly using Parcl to get an edge across five areas of their business: tracking local market shifts in real time, pricing listings with evidence, identifying prospective sellers, creating marketing that stands out, and bringing trusted housing data into new AI workflows.
This guide breaks down each use case with real examples and practical tips for getting started for your own real estate operation.
Use Case #1: Become the Real-Time Expert on Your Market
The most common way we see agents use Parcl is to monitor their local markets. Broad metro headlines are easy to find, but agents need to know what is changing in specific ZIP codes, price bands, and property types.
Parcl HQ delivers that level of detail through daily-updating market intelligence and national coverage down to ZIP codes and individual properties.
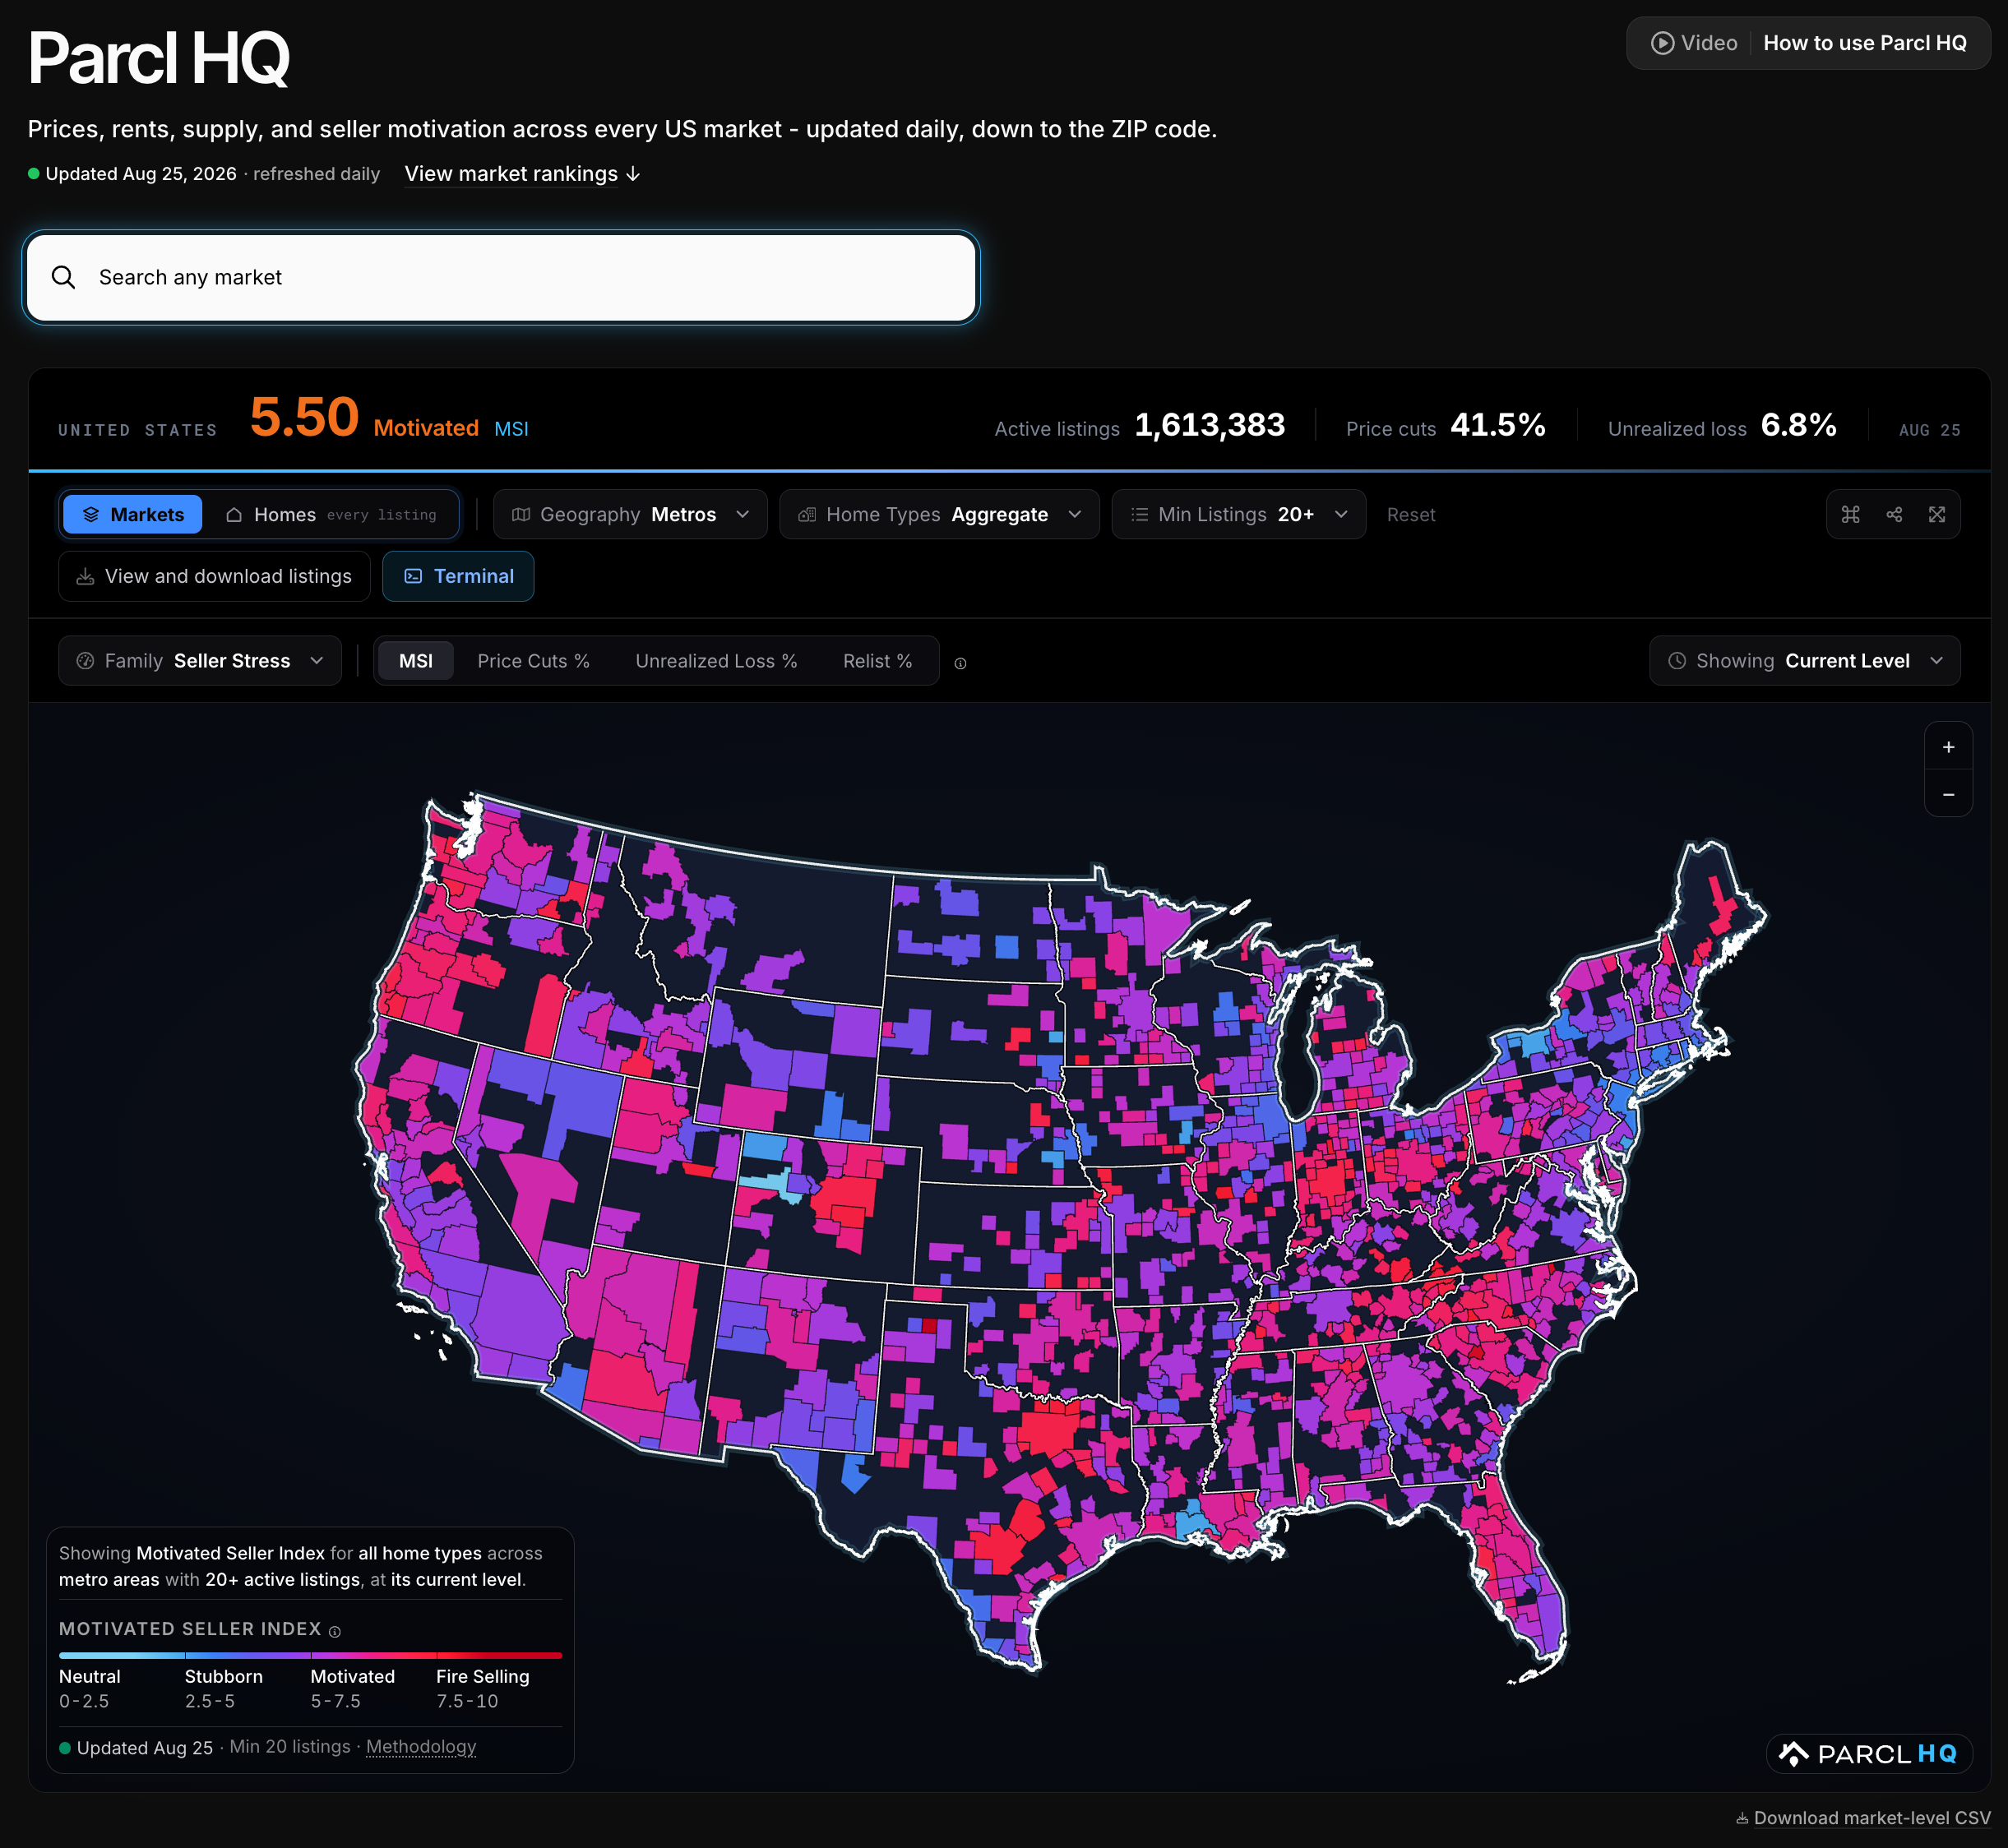
Start With the Neighborhoods Where Your Business Lives
Start by searching the market you know best. Use Parcl HQ's interactive map to scan the surrounding region, then click into a ZIP code, city, or county. The Terminal organizes market data into five tabs: Price & Motivated Seller Intelligence, Supply & Demand, Ownership, Financing, and Rentals.
Use Terminal's detail to answer the questions your clients actually ask. Is inventory rising in one ZIP code or across the metro? Are price cuts concentrated in a specific price band? Is new construction moving differently from resale? Are homes still selling at ask? How common are all-cash purchases, and what does that mean for buyers using financing?
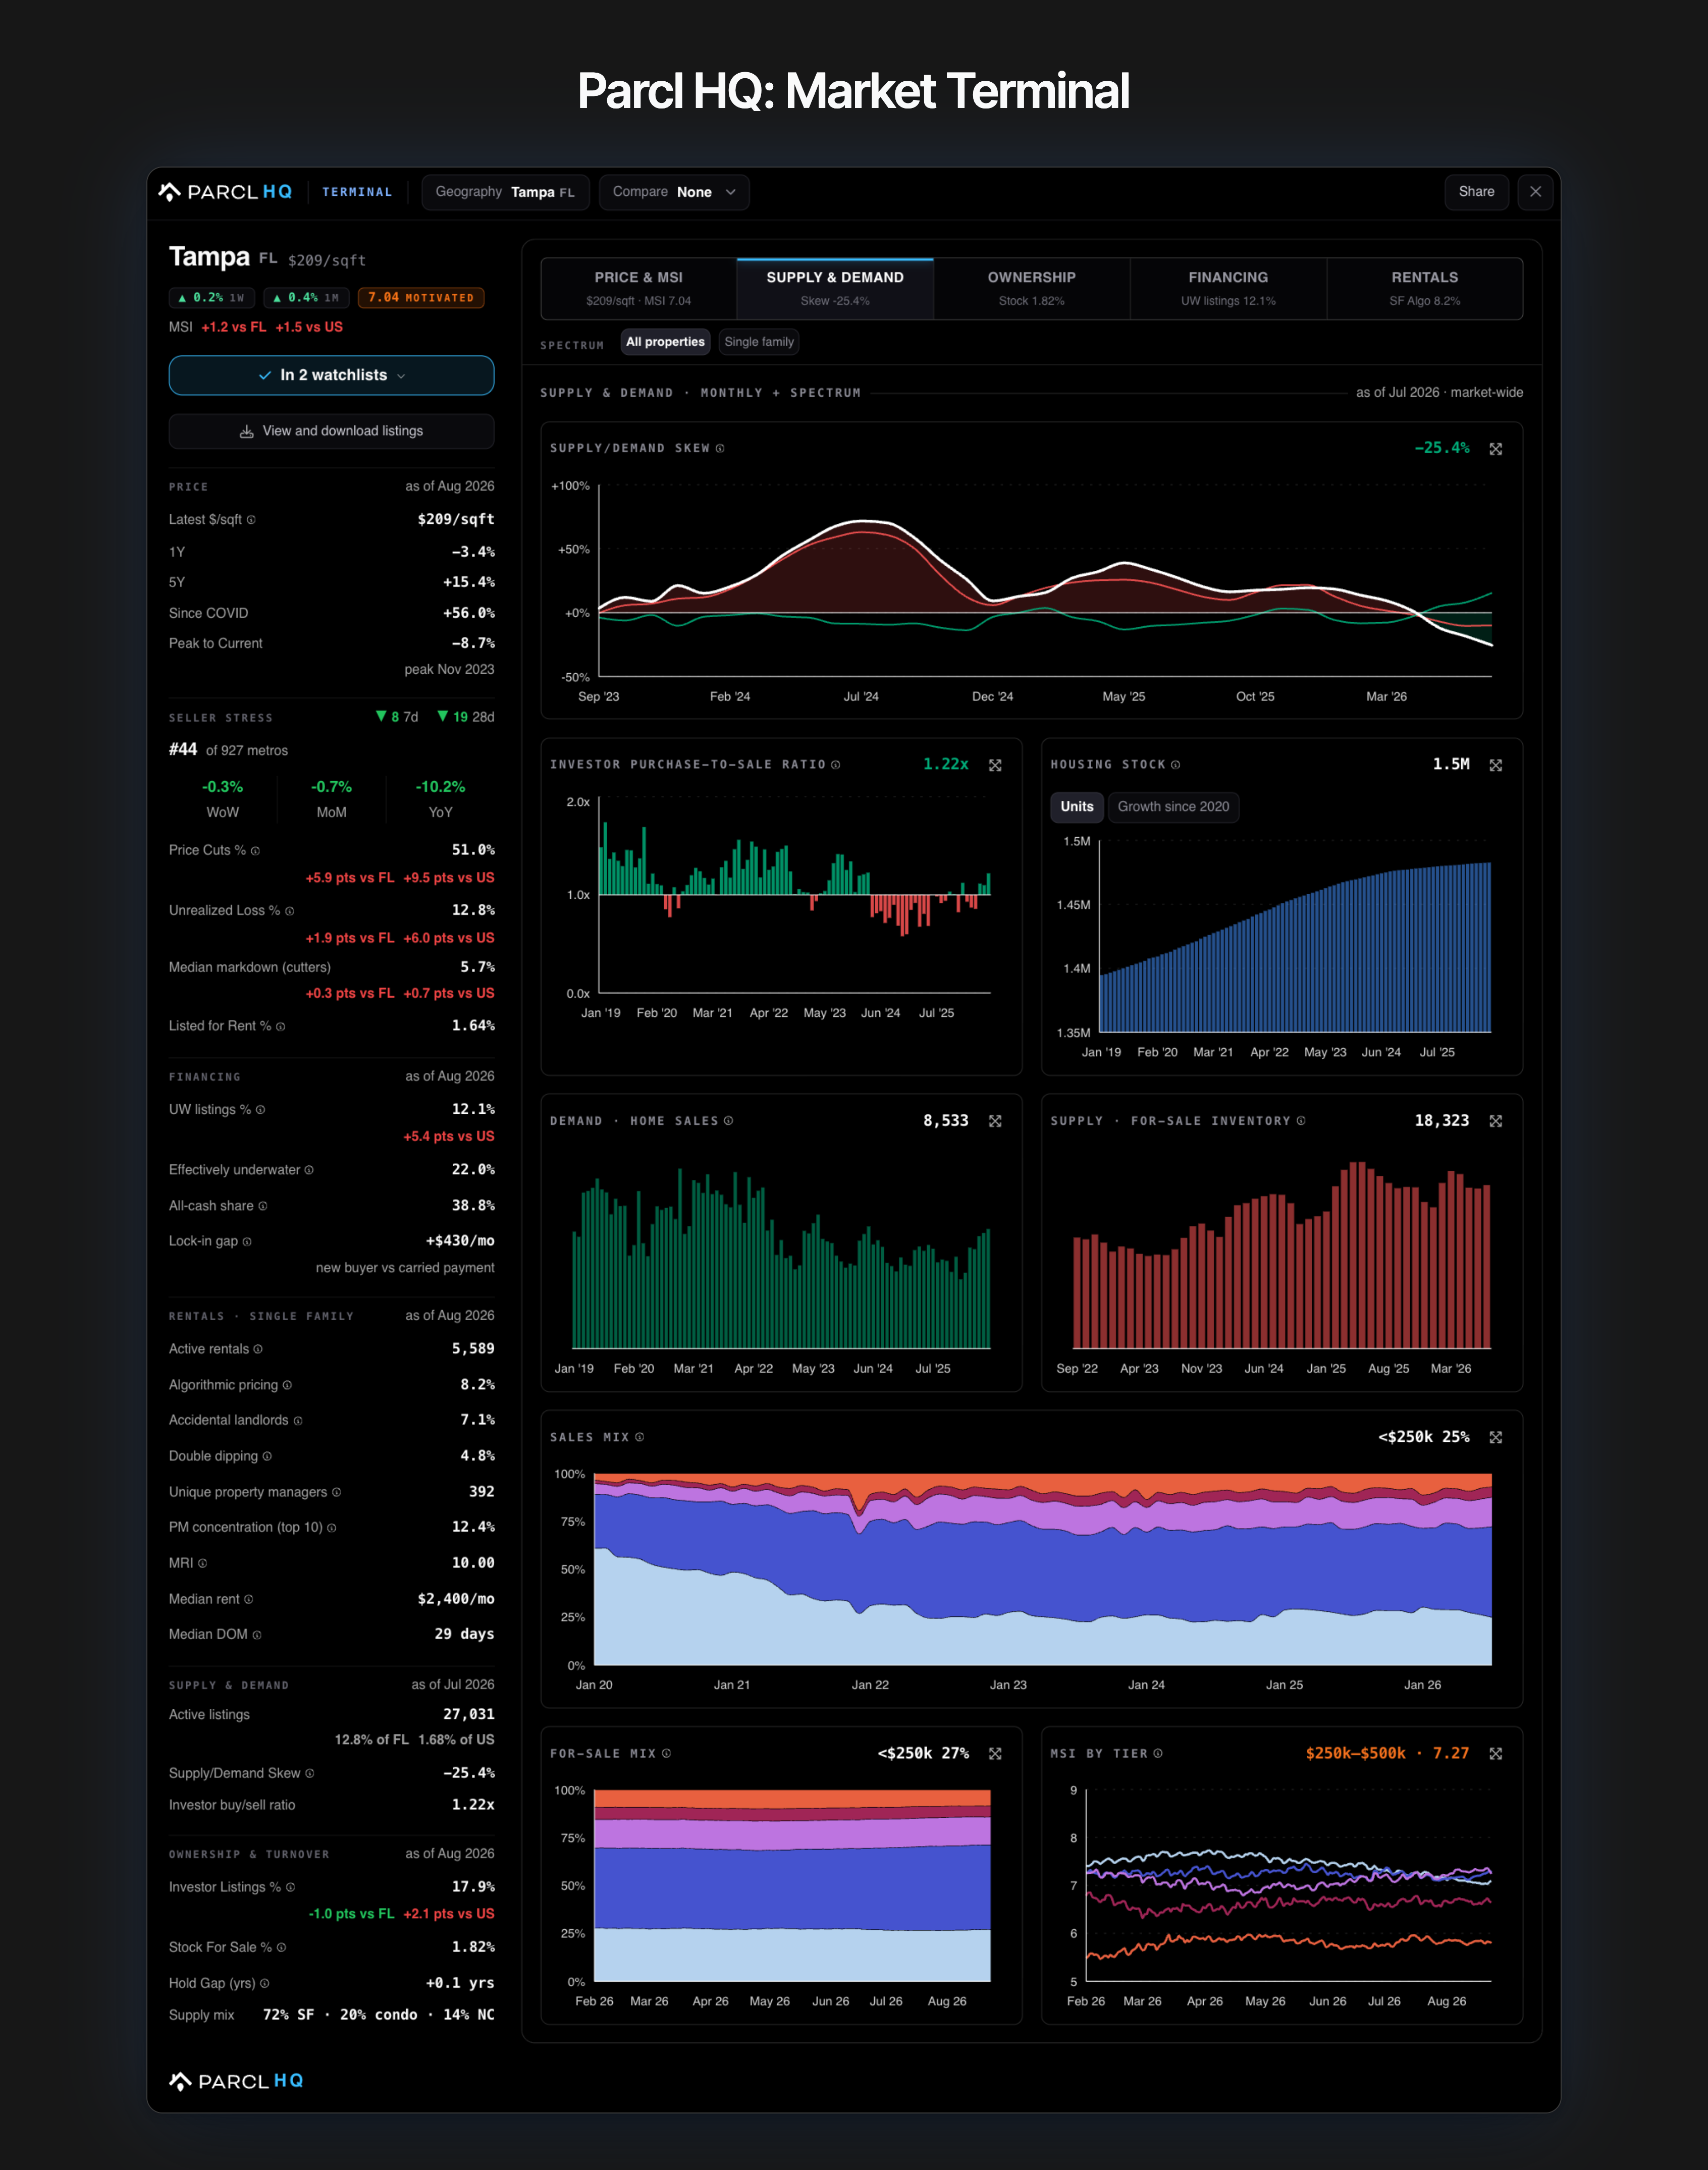
Comparing the same signal across geographies, property types, and time periods reveals whether a shift is isolated or widespread, giving you the context to turn market data into useful intelligence.
Build a Watchlist of Your Key Markets
The next step is to turn that research into a view you can use every day. Save the ZIP codes, cities, counties, and metros you track to , then use Display Data to select and arrange the indicators that fit your business.
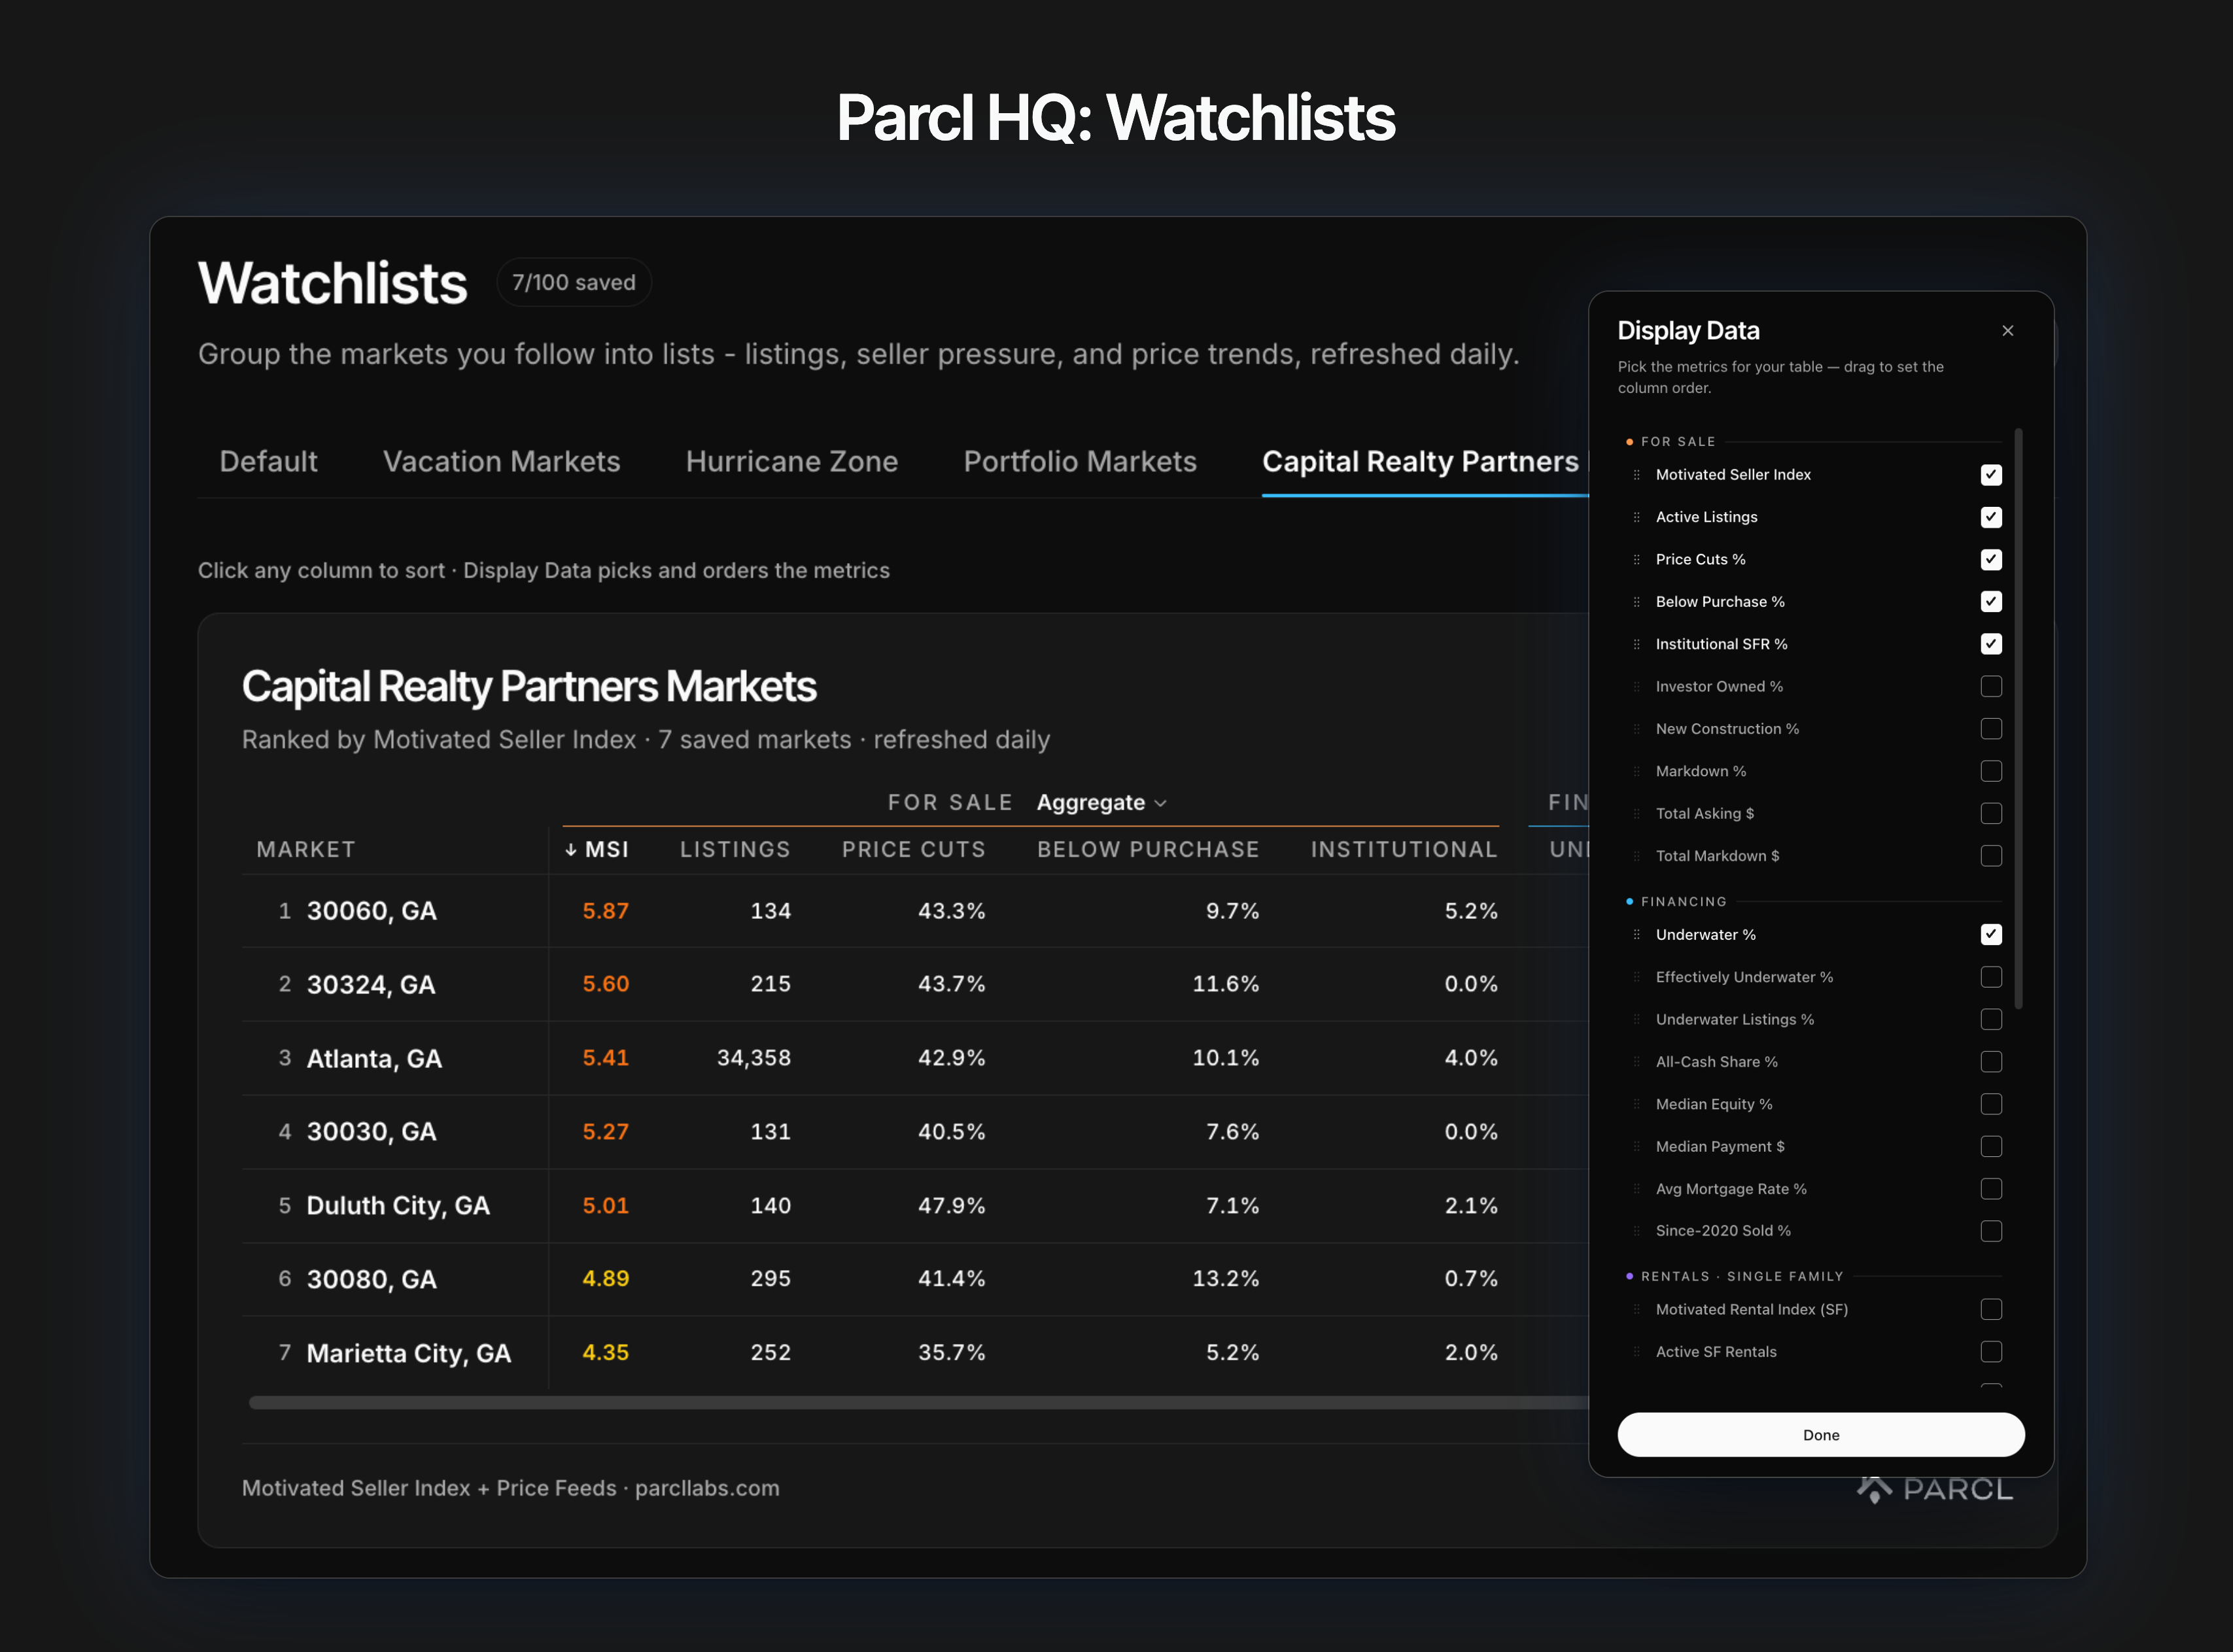
A listing-focused view might prioritize seller motivation, active listings, price cuts, markdowns, and re-lists. A new-construction specialist could focus on inventory, price trends, and the share of listings that are newly built. Each time you open Parcl, the markets and signals most relevant to your clients are already in front of you.
Set Alerts for the Changes You Need to Know About
Once your Watchlists are in place, use alerts to monitor changes that could affect your listings. Every chart in the Terminal includes a bell icon. Choose a metric, set a threshold above or below its current level, and Parcl will notify you in the platform and by email when the market crosses it.
An alert might track seller motivation entering a higher band, price cuts % crossing a chosen level, or price per square foot falling below a target. Parcl surfaces the change when it happens, helping you proactively recognize when a market deserves a closer look.
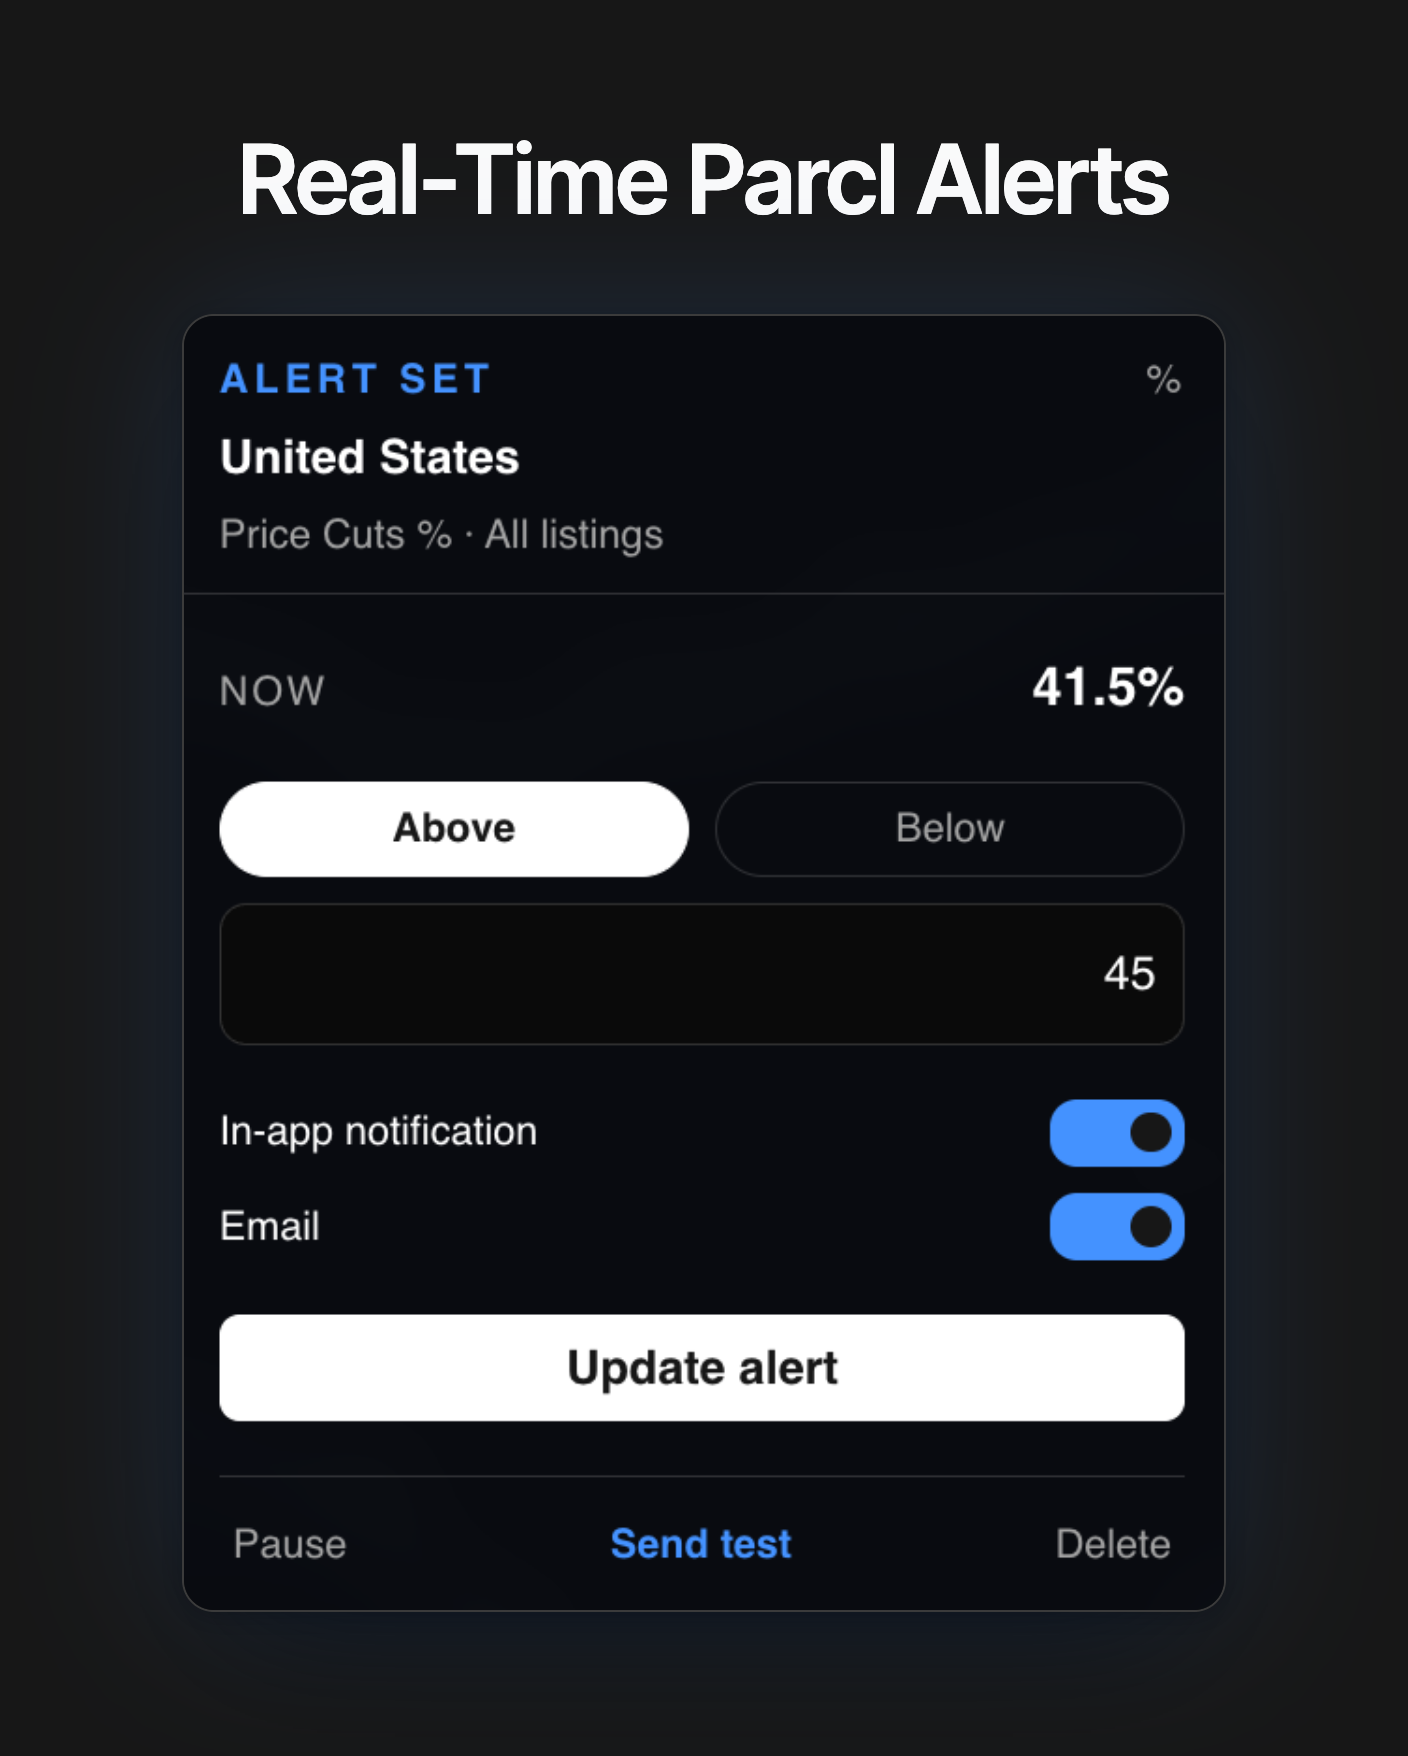
Parcl HQ, Watchlists, and alerts give you a simple system to research your markets, organize and compare the areas you serve, and stay ahead of local changes that could shape your next client conversation.
Use Case #2: Price Listings With Evidence
Market trends provide context, but pricing a listing requires a closer view of the homes competing for buyers today. Agents need to understand which properties form the current competitive set, how those sellers are responding to the market, and what outcomes different pricing strategies are producing. Parcl HQ brings those signals together in one place.
Build a Live Competitive Set
Switch Parcl HQ from Markets to Homes view to see every active listing across an area. Each property shows its price, price-cut depth, and days on market. Filters let you narrow the field by home characteristics, price, seller motivation, unrealized loss, and time on market.
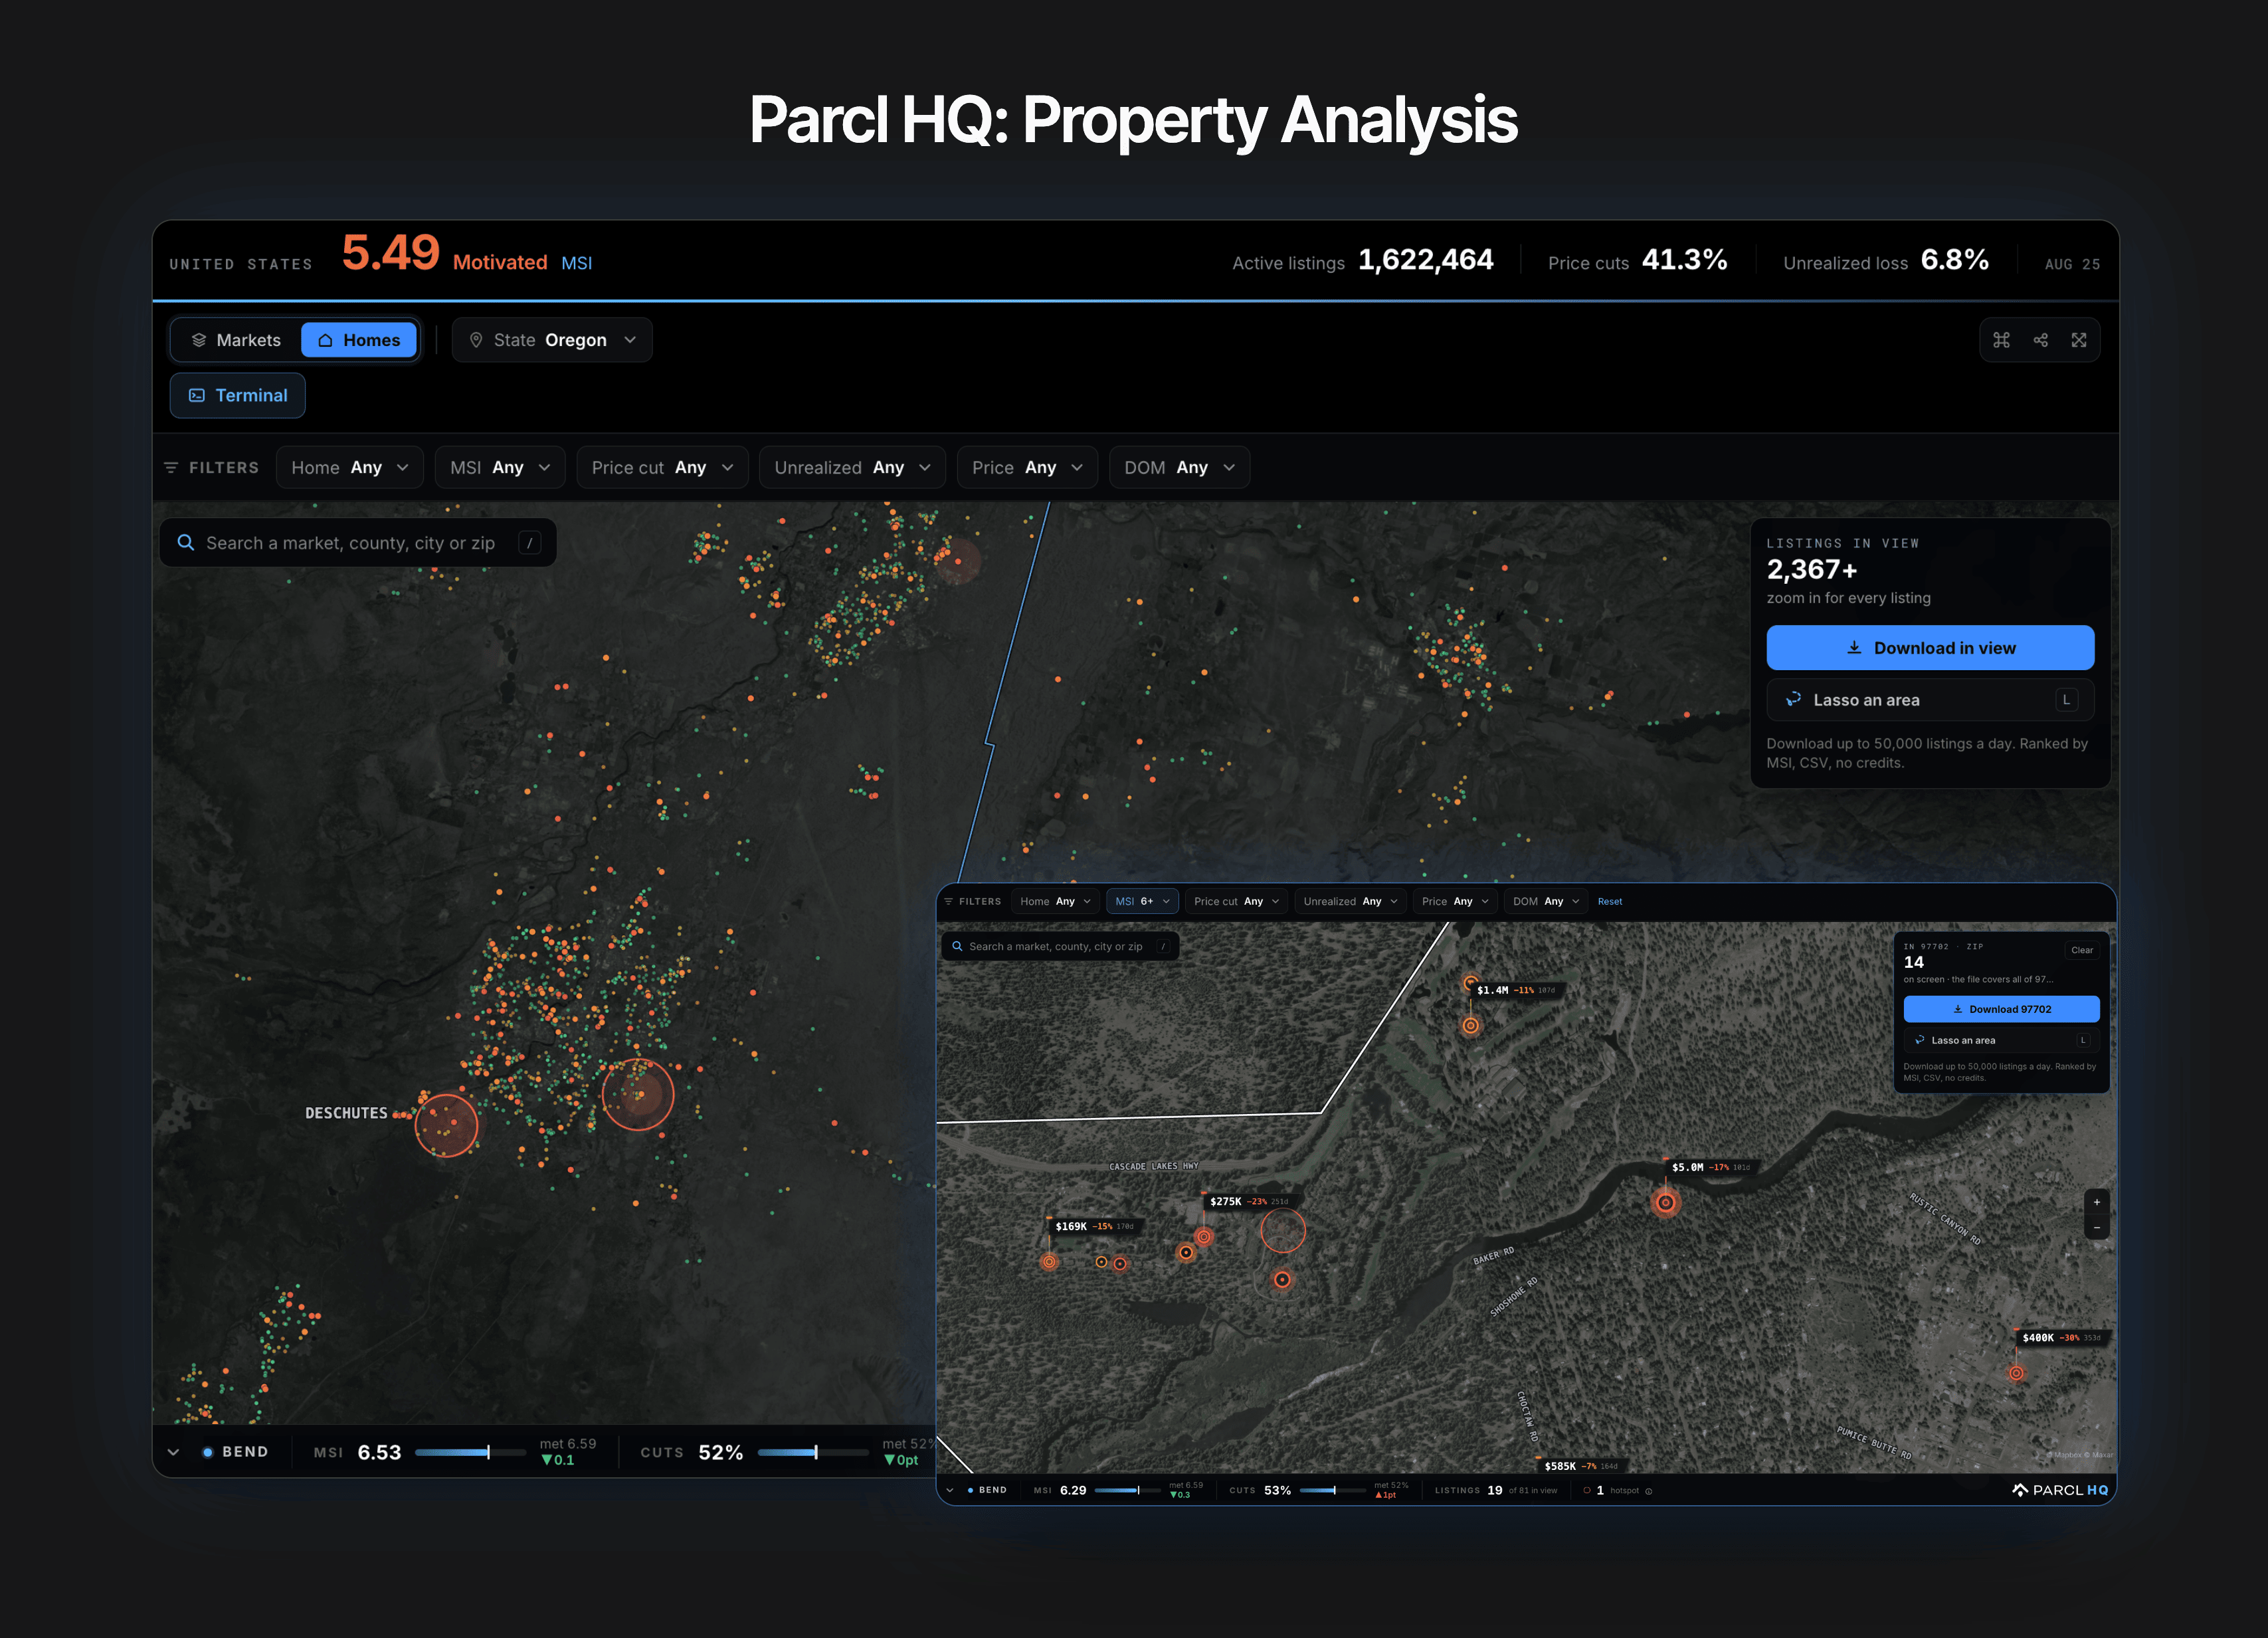
This gives you a real-time read on competing listings to use alongside closed-sale comps. If nearby homes are listed above your recommendation, you can see whether they are attracting buyers or accumulating days on market and price cuts. That context helps separate the prices sellers want from the prices buyers are responding to.
Put Asking Prices in Context
Some sellers test the market with an aspirational price and hold firm when buyers do not respond. Others adjust because completing a sale is the priority. Treating both asking prices as equal signals can distort a pricing recommendation.
The Motivated Seller Index, or MSI, helps distinguish between those behaviors. The 0-to-10 score uses listing activity to group sellers into four bands: Neutral, Stubborn, Motivated, and Fire Selling. It shows whether a seller is holding firm or becoming more willing to meet the market.
Parcl also adds context that may help explain what is behind that behavior, including whether the property is investor-owned, the mortgage may be underwater, the seller holds substantial equity, etc. These insights can reveal the constraints or flexibility shaping a pricing strategy. Pairing MSI with owner context helps agents evaluate competing listings more accurately and compare those strategies with the client's own position.
Show What Different Strategies Have Produced
The Terminal connects active competition with completed outcomes. Sale vs Ask shows what homes sold for relative to asking over the past 30, 60, or 90 days. Price Cuts %, Markdown $, and days on market show how often sellers adjusted and how long those approaches took to produce a sale.
Agents can use that evidence to explain the tradeoffs behind each strategy. Testing the top of the range may mean accepting more time on market and possible price cuts. Pricing closer to current demand may better support a seller who prioritizes speed or certainty.
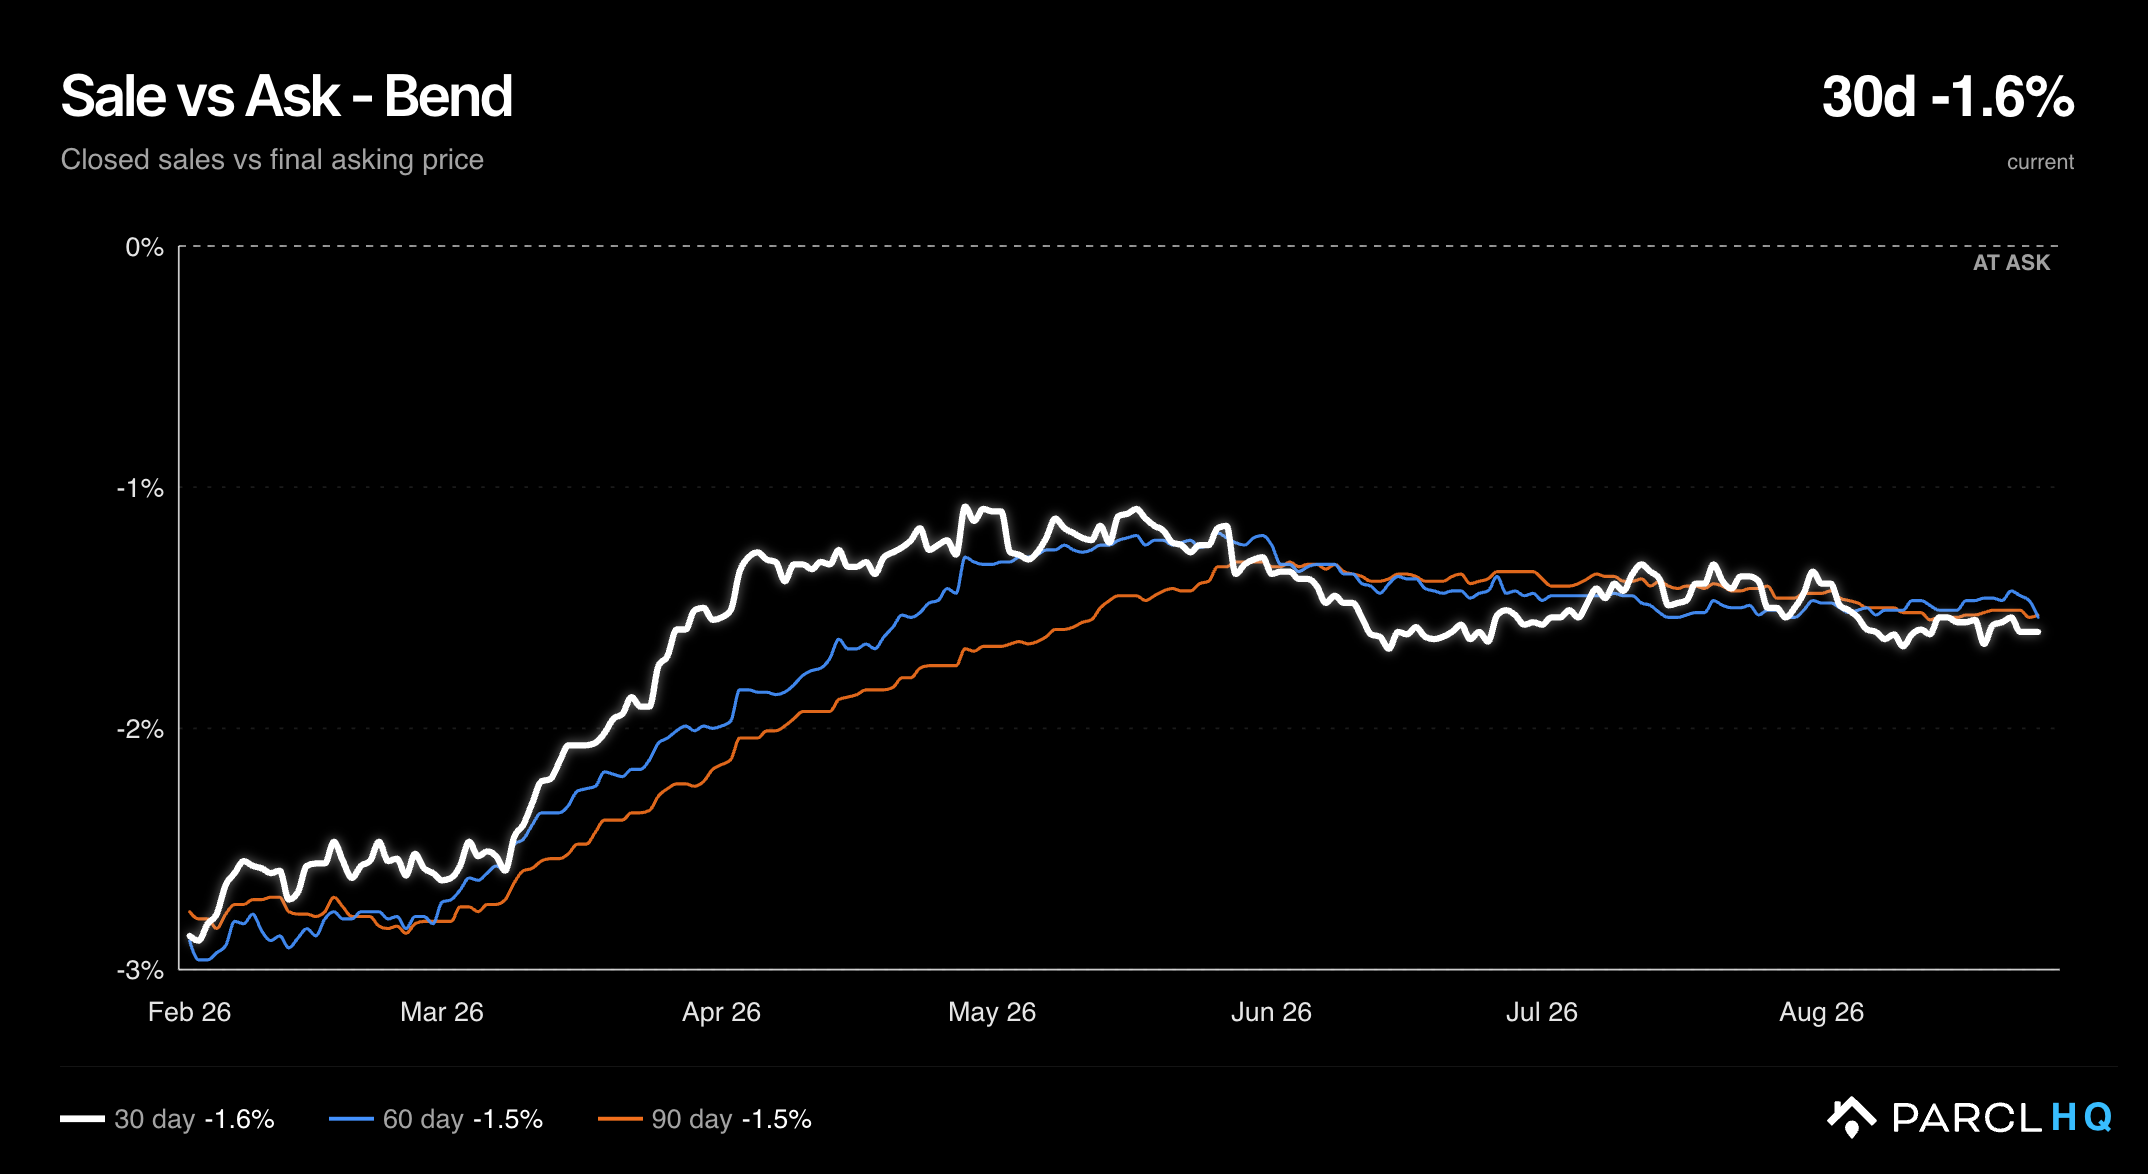
These views turn pricing from a debate over a theoretical number into an objective conversation about competition, tradeoffs, and expected outcomes. Agents consistently tell us that seller-motivation data is especially valuable in difficult pricing conversations because it helps clients see the market as it is. That honest, data-driven perspective can help an agent win the listing, align the strategy with the seller's goals, and calibrate pricing as conditions change.
Use Case #3: Find New Opportunities and Leads
Property-level data can help agents win the listing in front of them. It can also help find the next one by highlighting owners whose plans may be changing. Across Parcl, specialized tools let agents search, filter, and analyze property data using criteria tailored to their strategy and ideal client. They can then access or download the resulting lead list in the format that best fits their workflow.
Find Sellers Who May Need a New Strategy
Start with active listings showing high seller motivation, repeated price cuts, or long days on market. These patterns can identify owners whose current approach is falling short and who may be open to a different one.
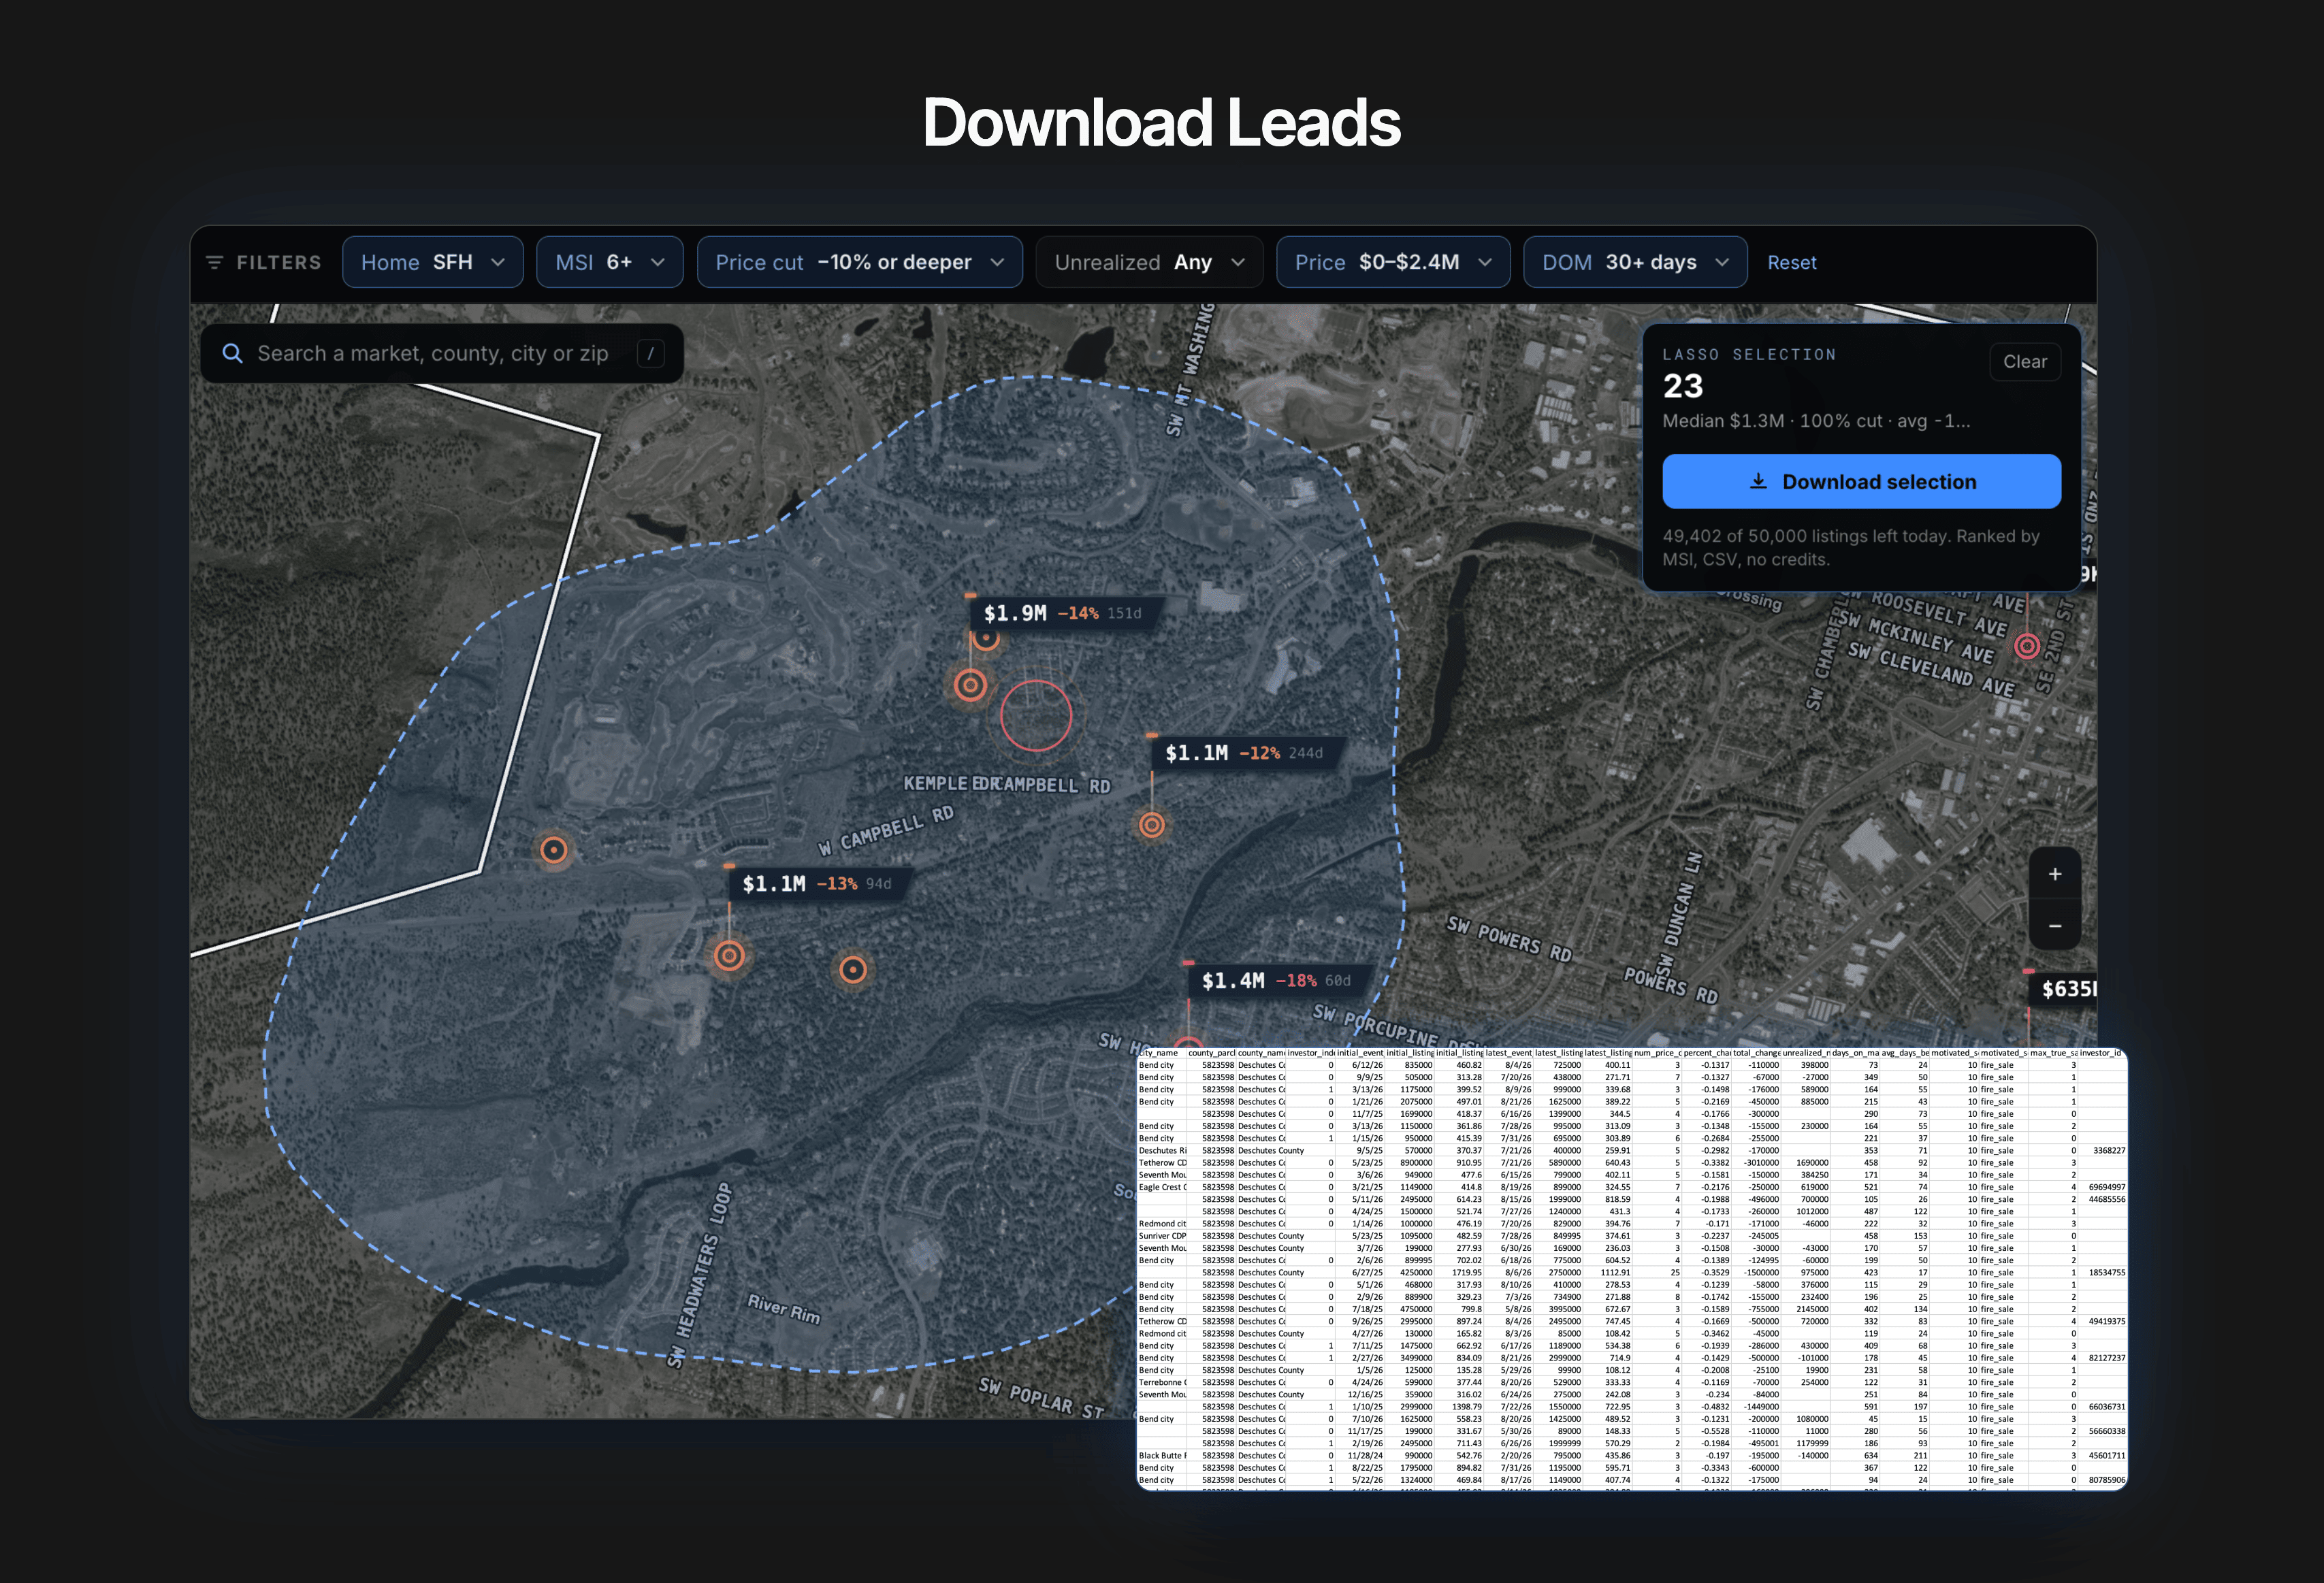
Re-lists, failed listings, and accidental landlords provide another view into changing plans. Agents can find homes that were removed without selling, pulled and relisted, or moved to the rental market after an unsuccessful sale attempt. Each behavior creates a timely reason to begin a conversation.
Focus on the Seller Groups You Know
Agents who work with investors can use to see which owners, from small local investors to large institutional portfolios, are selling down or bringing homes to market.
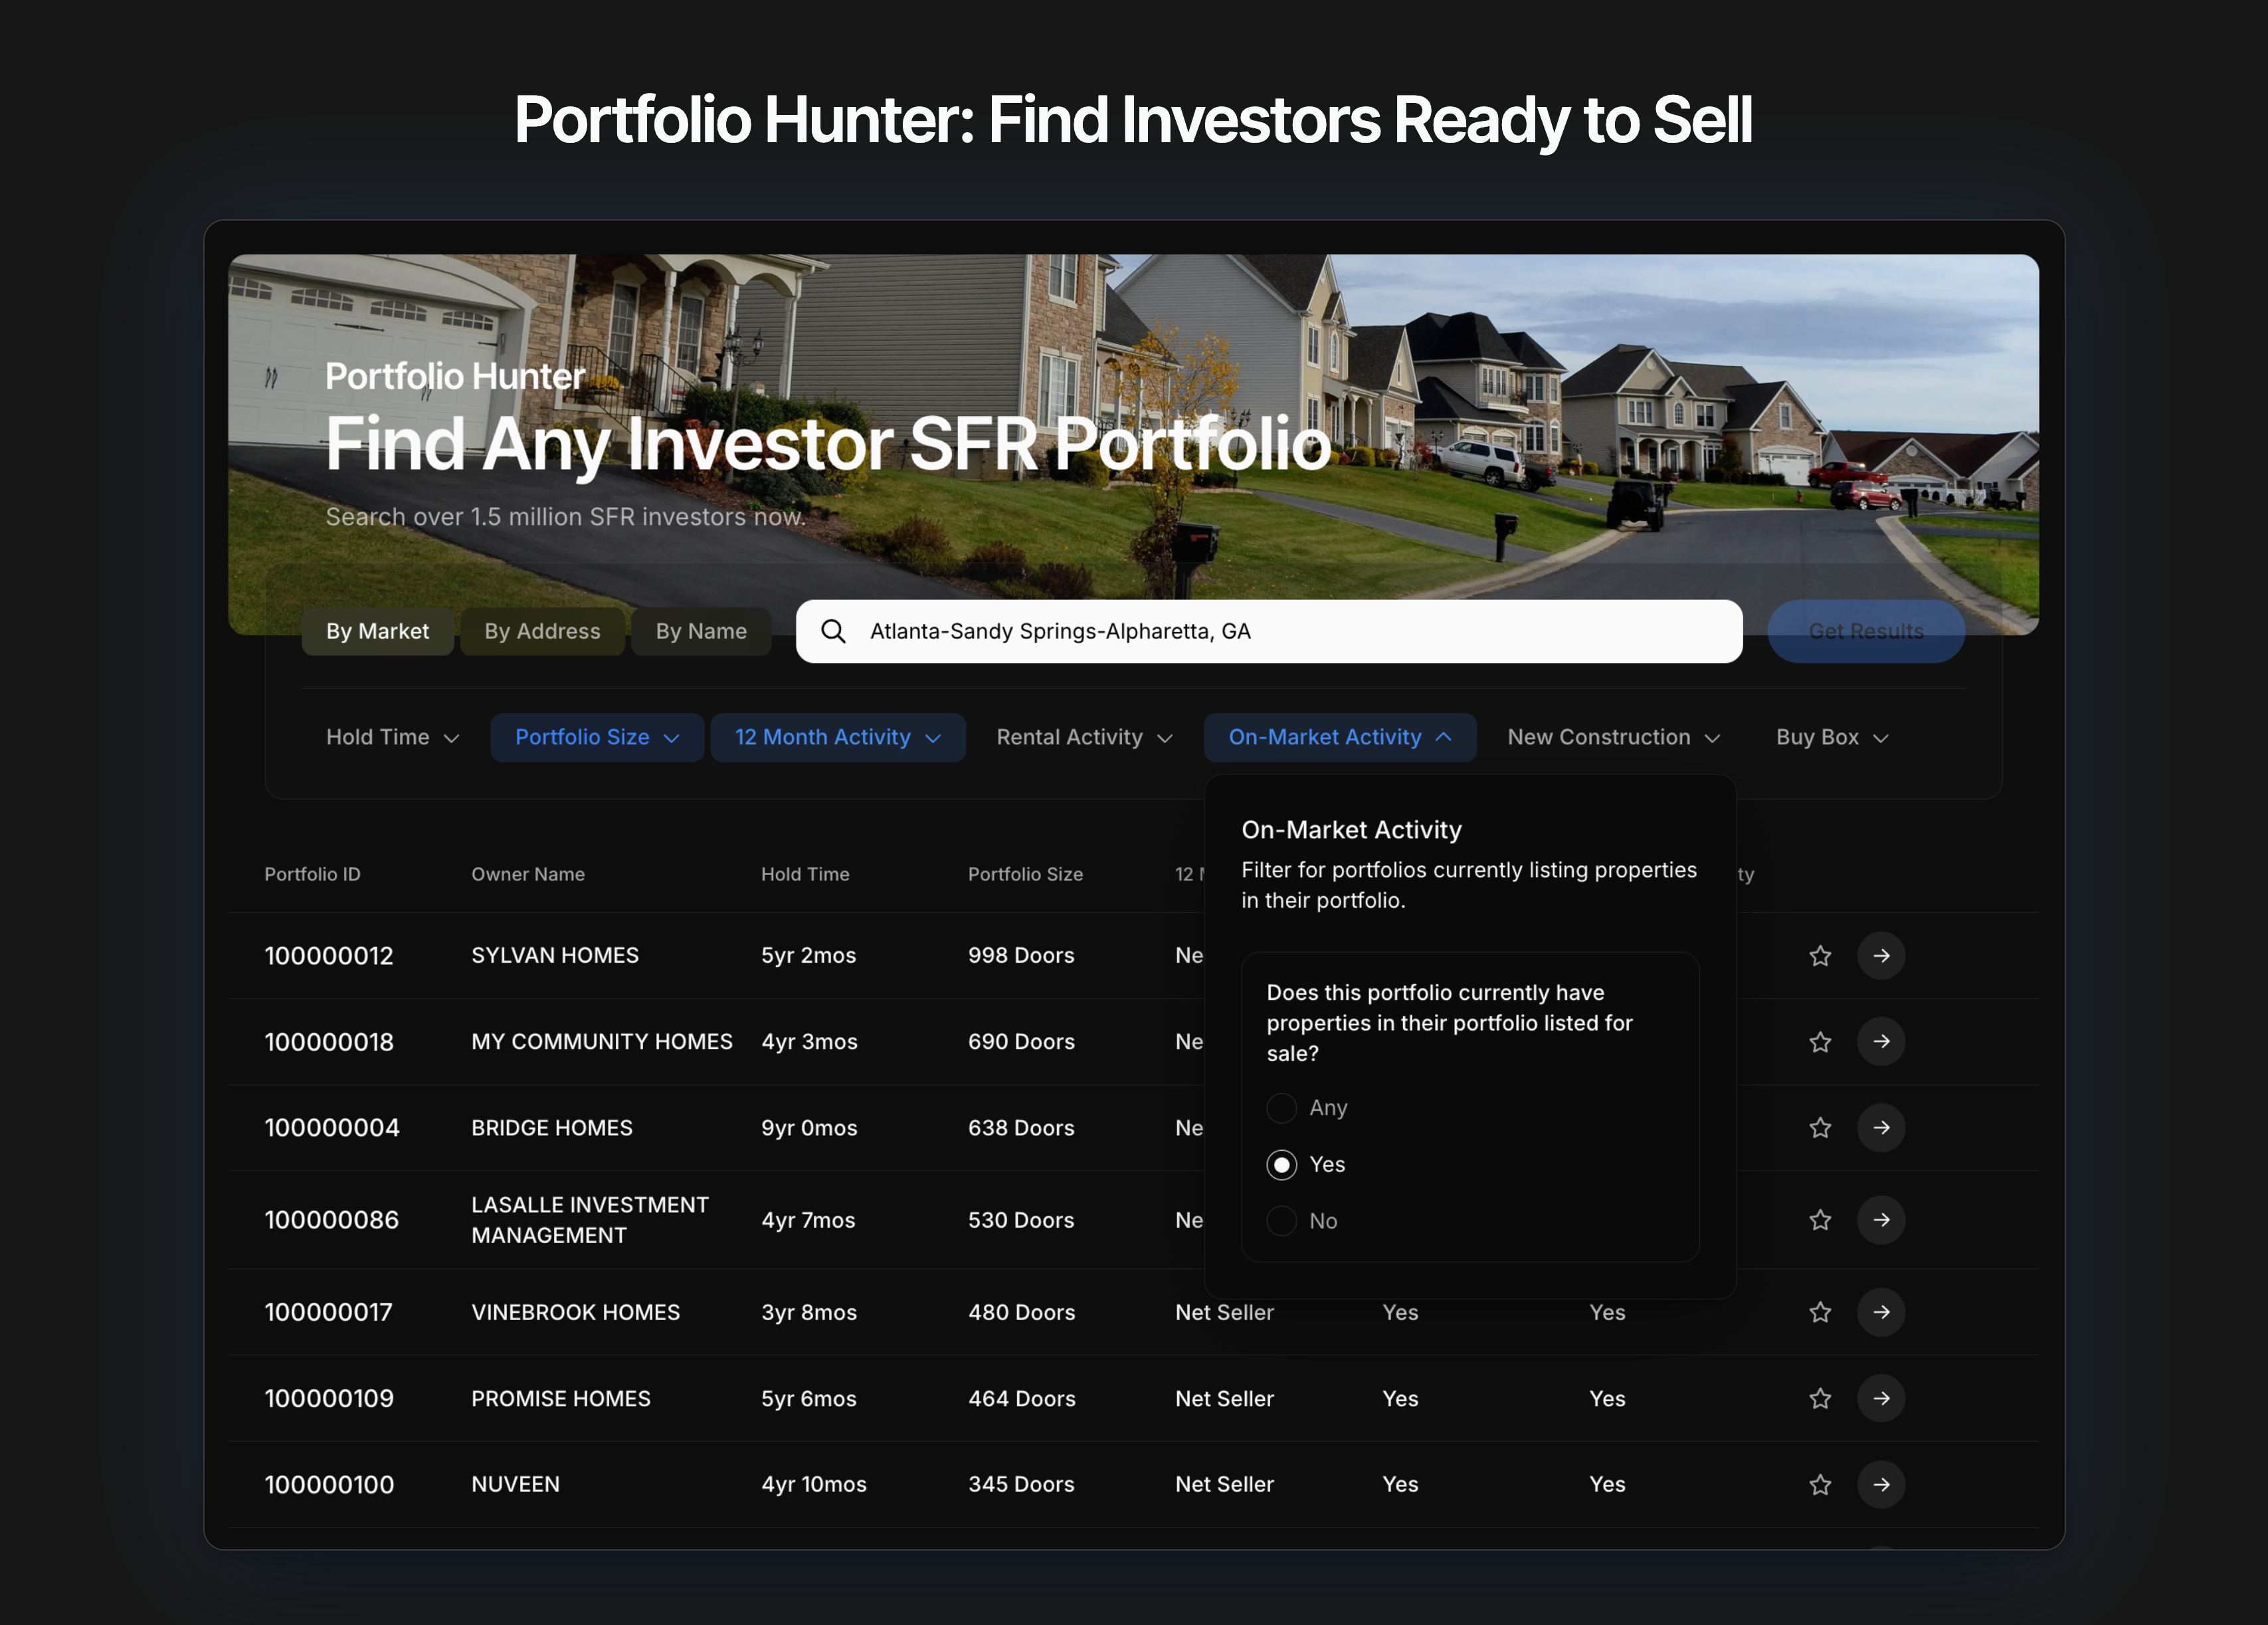
For brokers focused on new construction, homebuilder insights shows where new communities are taking shape, which builders are behind them, and how their inventory and pricing are changing. These insights help agents identify the owners and businesses most relevant to their specialties.
Build a Lead List You Can Act On
Curate the opportunity around the geography, property type, seller behavior, or owner group that fits your business. Access the results through the Parcl interface, download them as a CSV, or use AI Connect to shape a more specific search.
The resulting data includes ownership insights, making it easier to move from research to focused outreach. The goal is a practical list of sellers you are equipped to serve and a relevant reason to start the conversation.
Use Case #4: Create Marketing Content That Sets You Apart
Most agents rely on data and charts supplied by their brokerage or local MLS. When every agent in an office and across the local market uses the same sources, the resulting marketing tends to look the same.
Parcl gives agents a way to own the local market narrative and differentiate themselves from competing brokers recycling the same old content. By pairing real-time housing intelligence with compelling visualizations, agents can create data-driven marketing that commands attention and establishes them as the source clients turn to for answers.
Turn Any Chart Into a Branded Story
Data visualization is central to how we communicate at Parcl. We have taken what we learned from presenting our own research into the product, with a focus on making complex housing trends clear, engaging, and easy to share.
Any HQ chart can expand into Turbo chart mode, a clean view designed for presentations and marketing. Annotate lets you add arrows, text, and callouts before taking a screenshot for a listing presentation, newsletter, or social post.
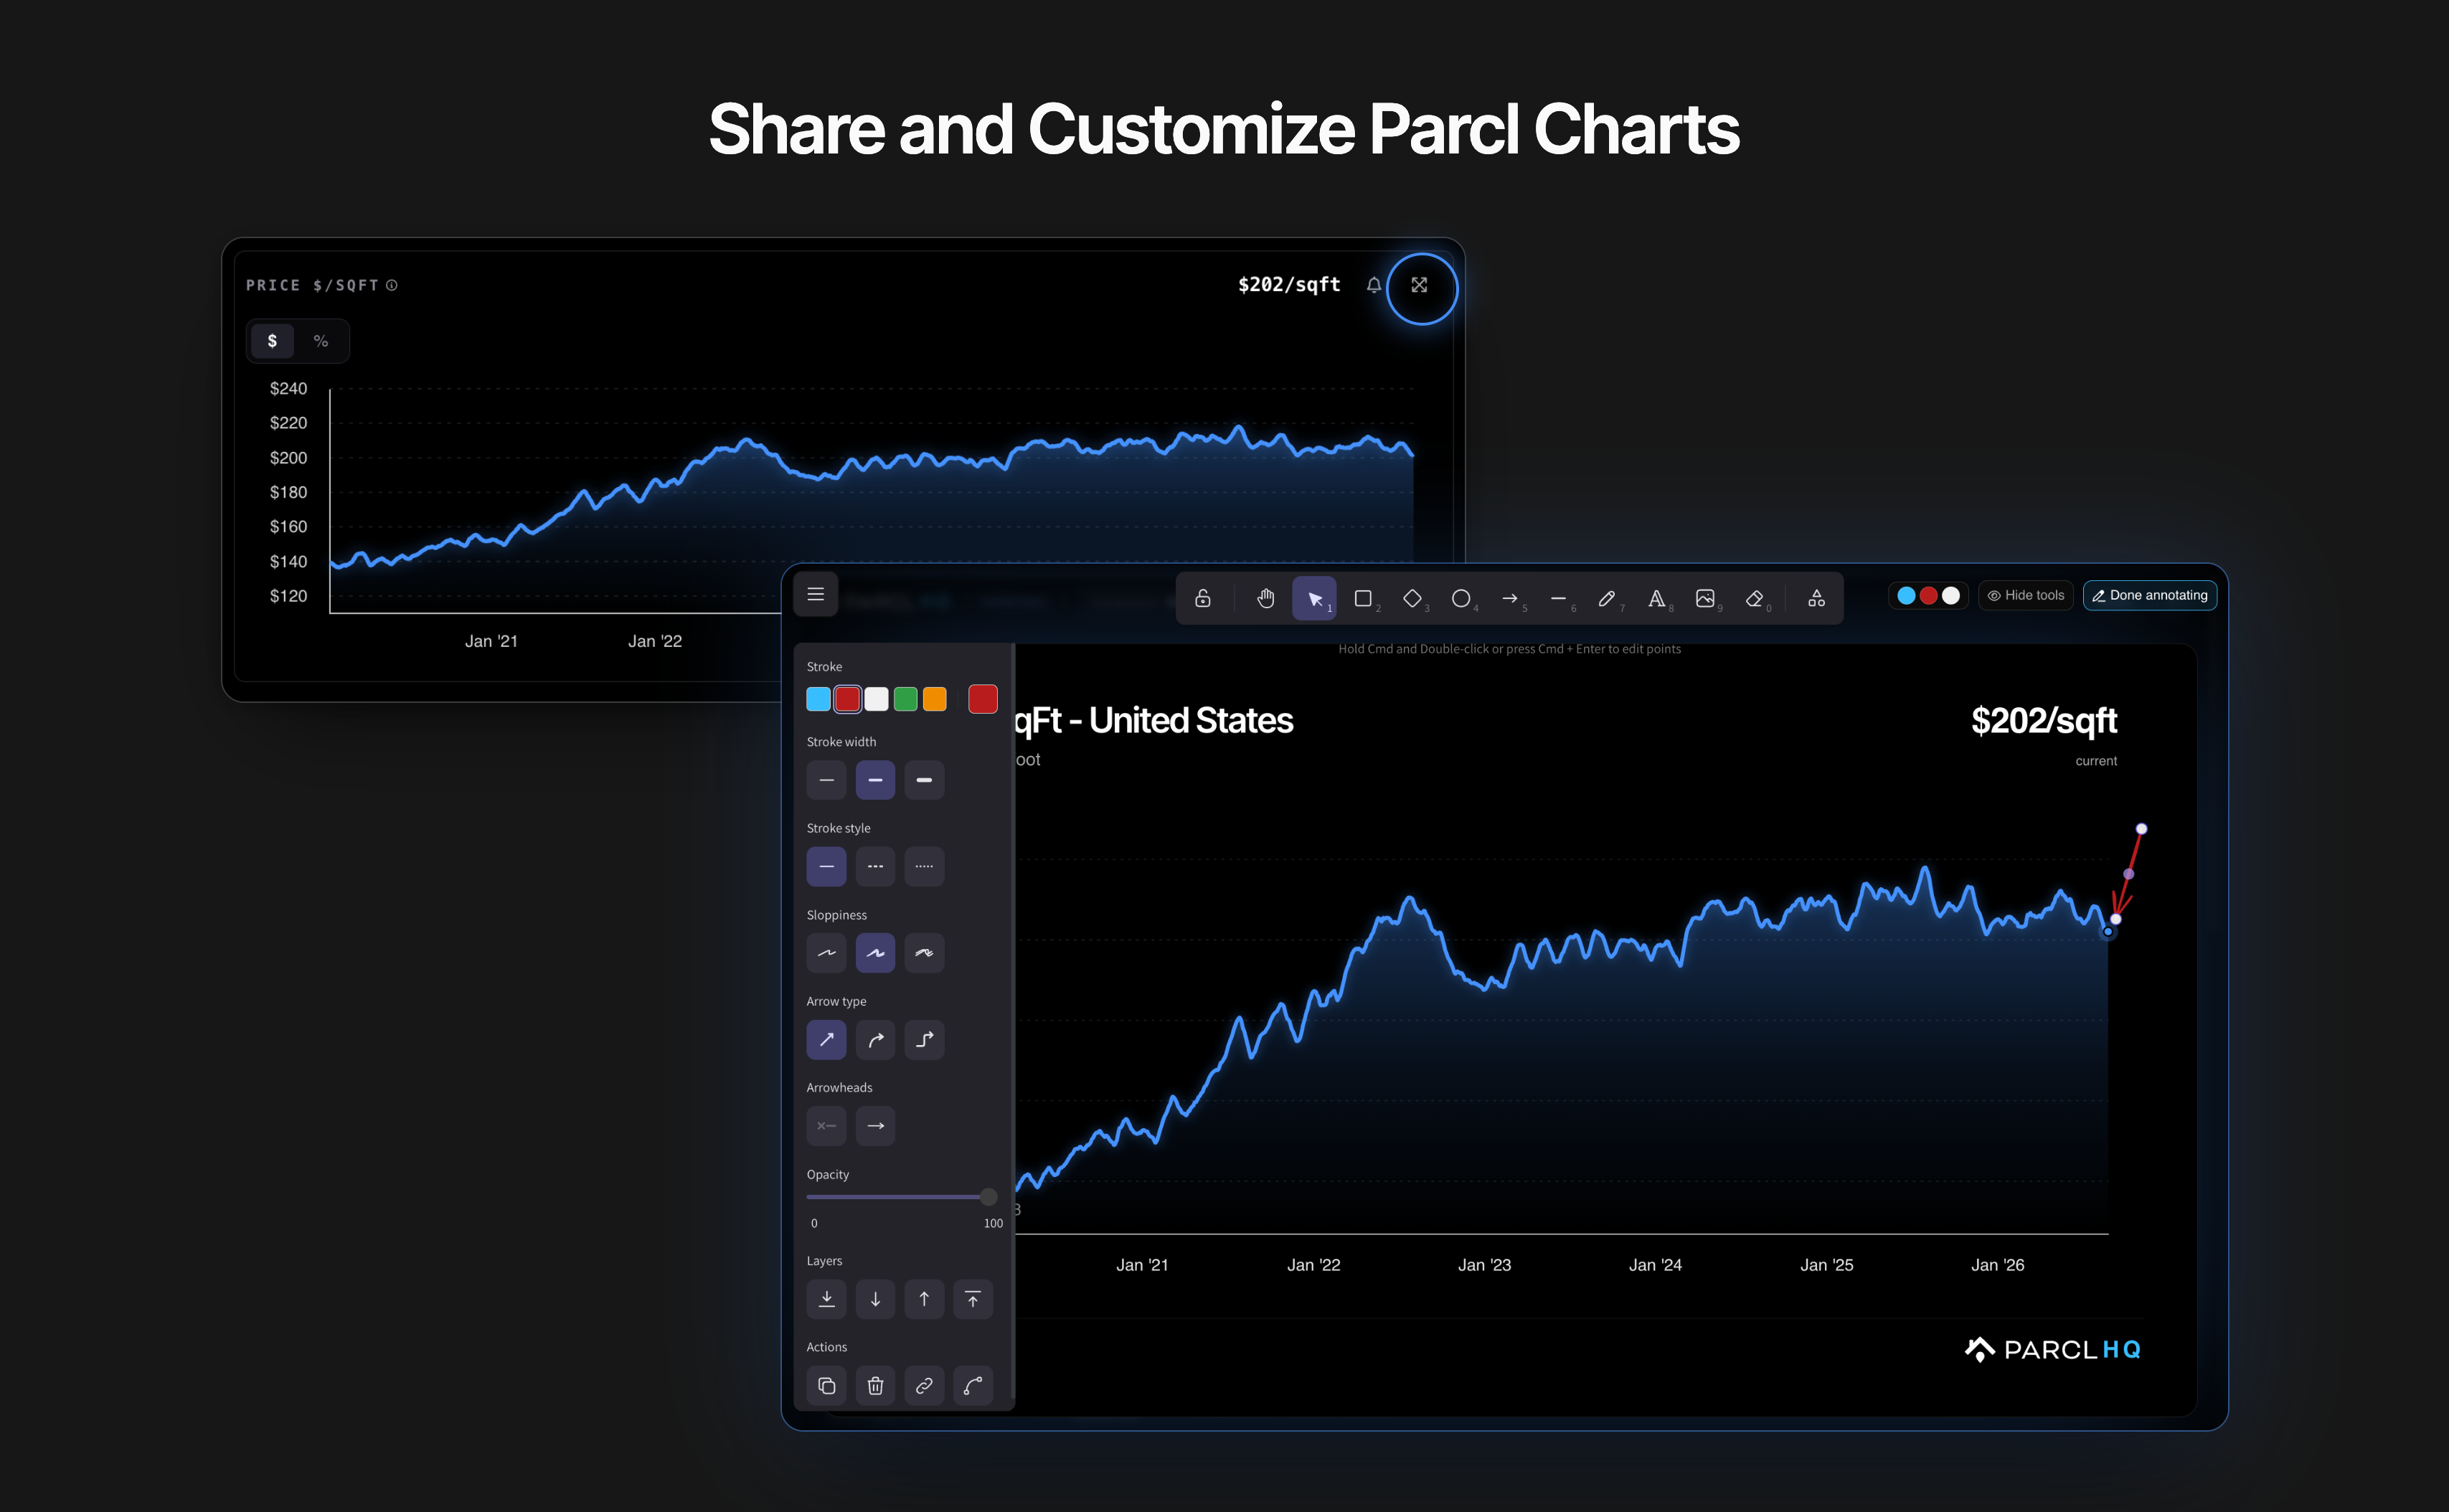
Use those tools to give the chart a point of view. Highlight the change your audience should notice, explain its local relevance, and connect it to the questions buyers and sellers are asking.
Add Live Market Intelligence to Your Website
HQ's Share and Embed tools turn any view into an interactive feature for your personal website. Choose the geography, metric, frame size, and brand mark, then copy the embed snippet.
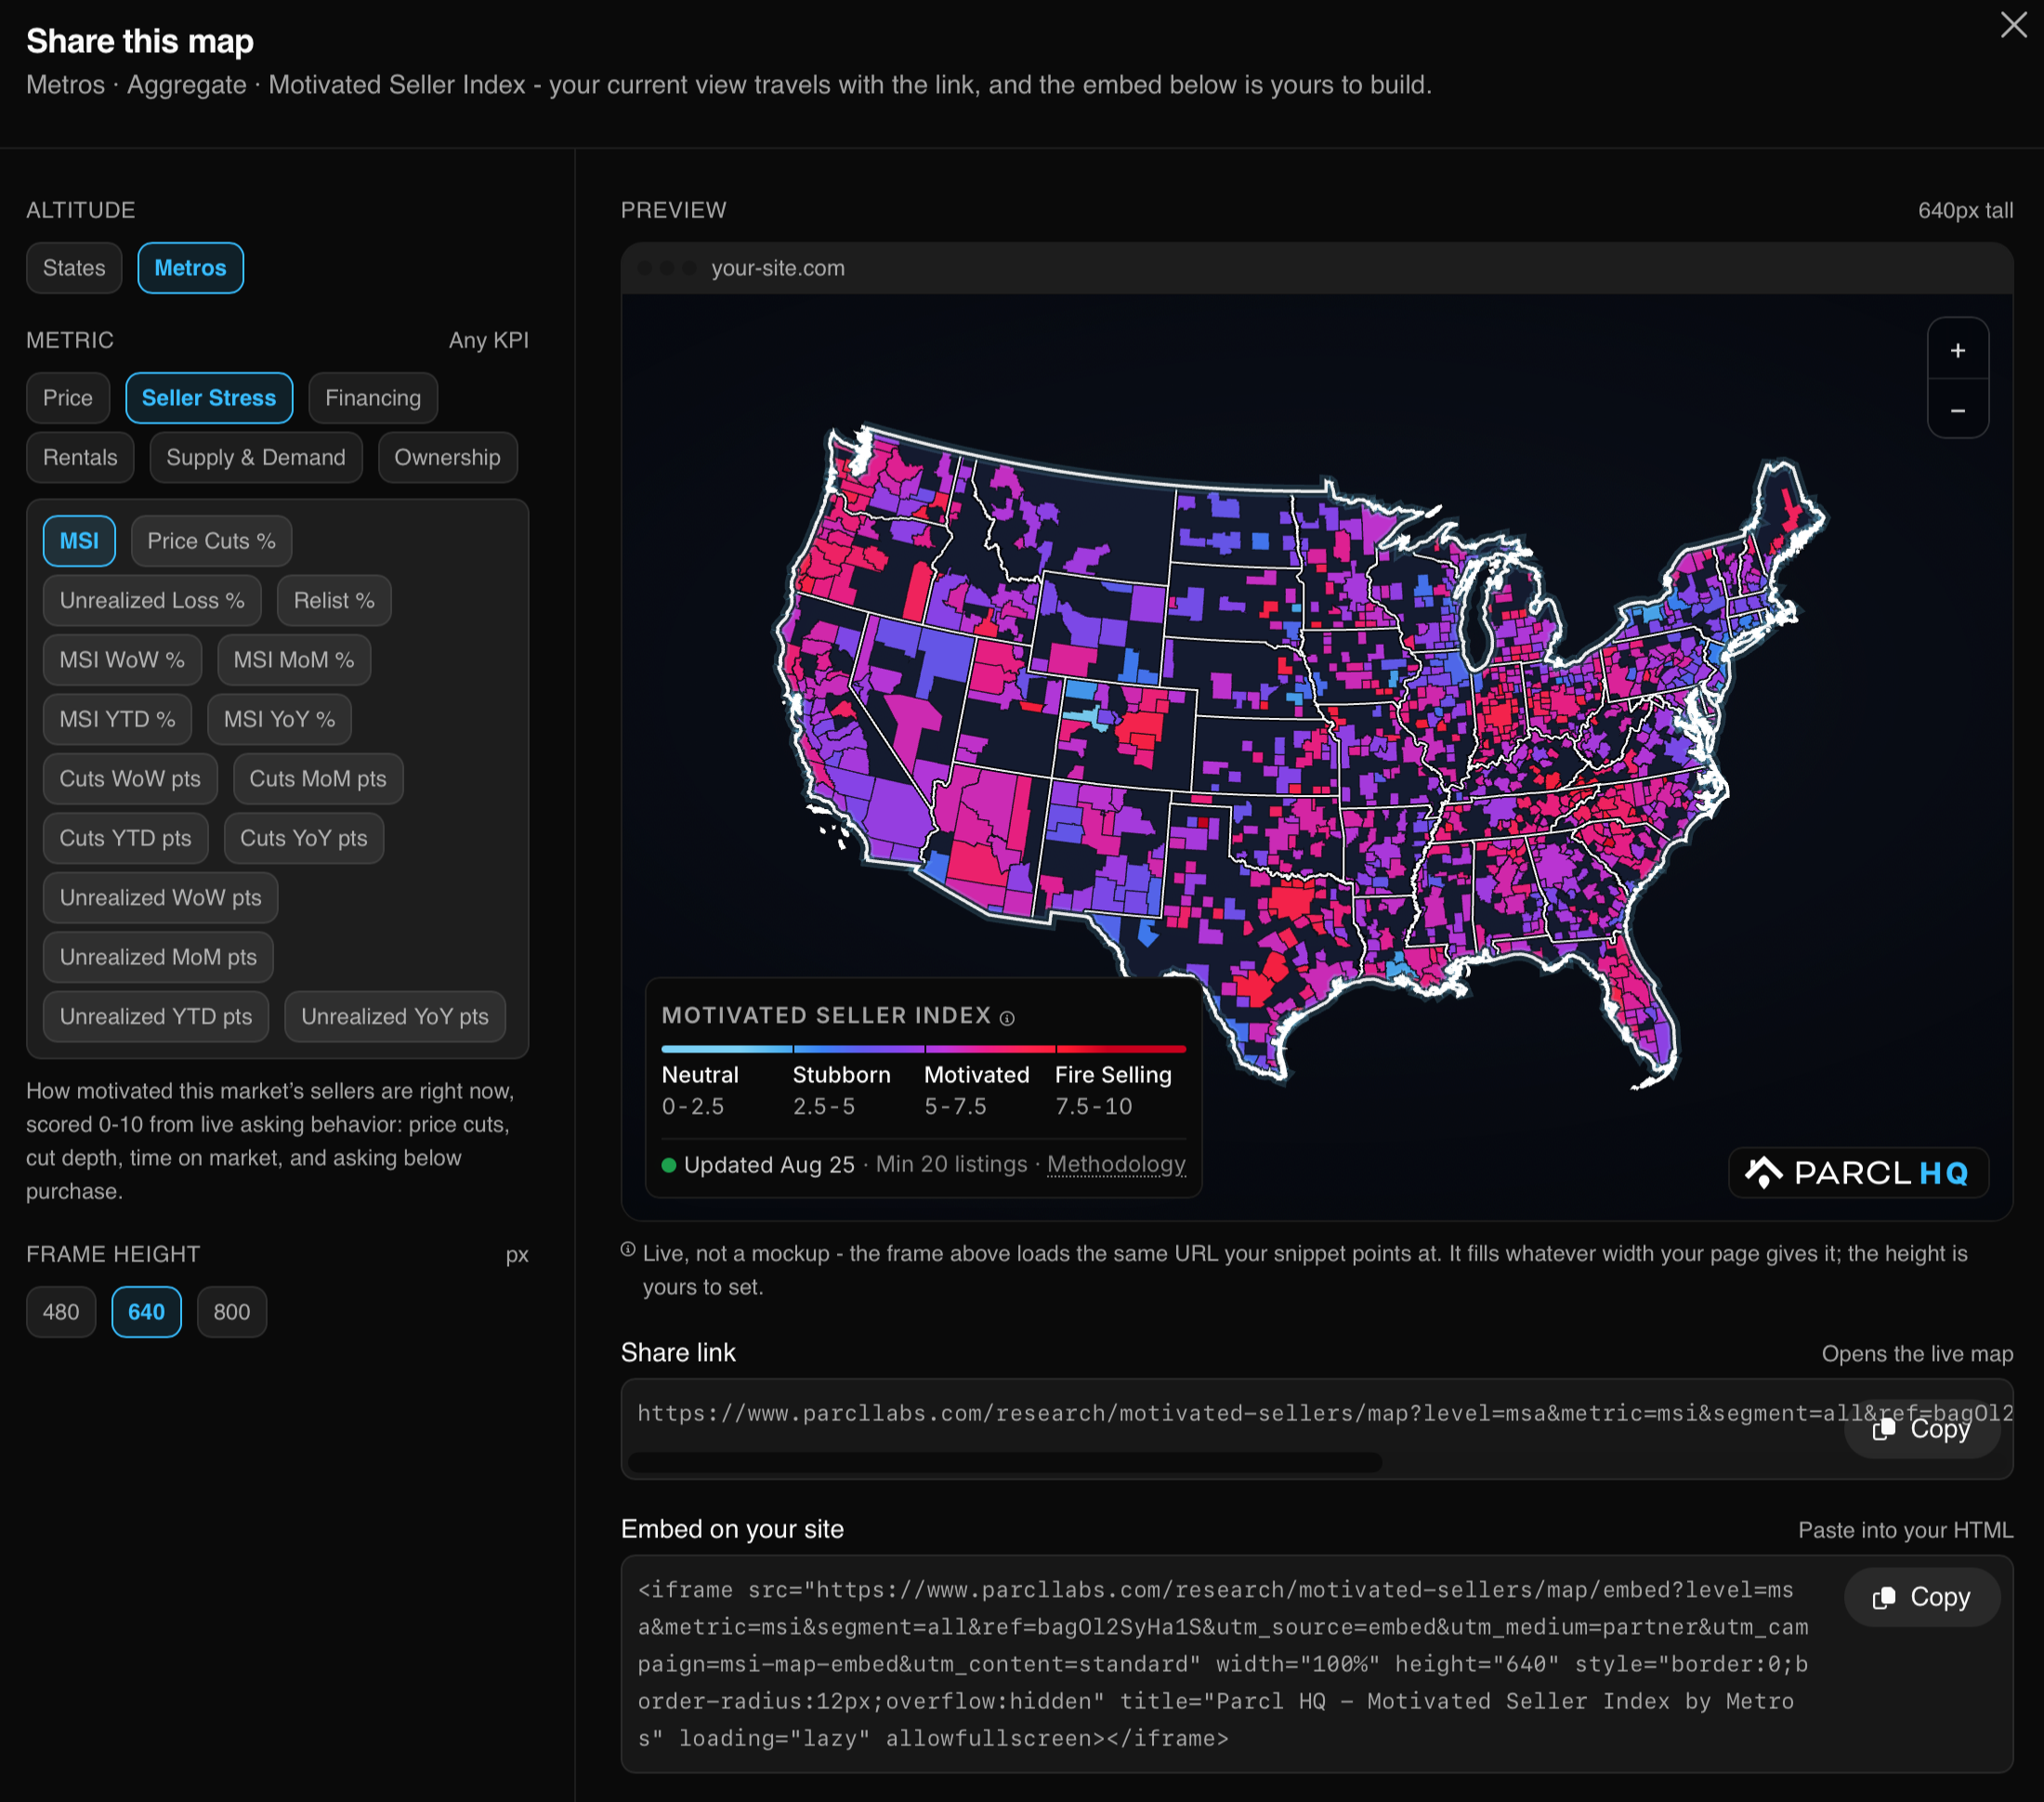
The embedded map refreshes with the underlying information and includes its legend and methodology. Visitors get an engaging local resource they can explore whenever they return to your site.
Create Polished Marketing Materials With AI Connect
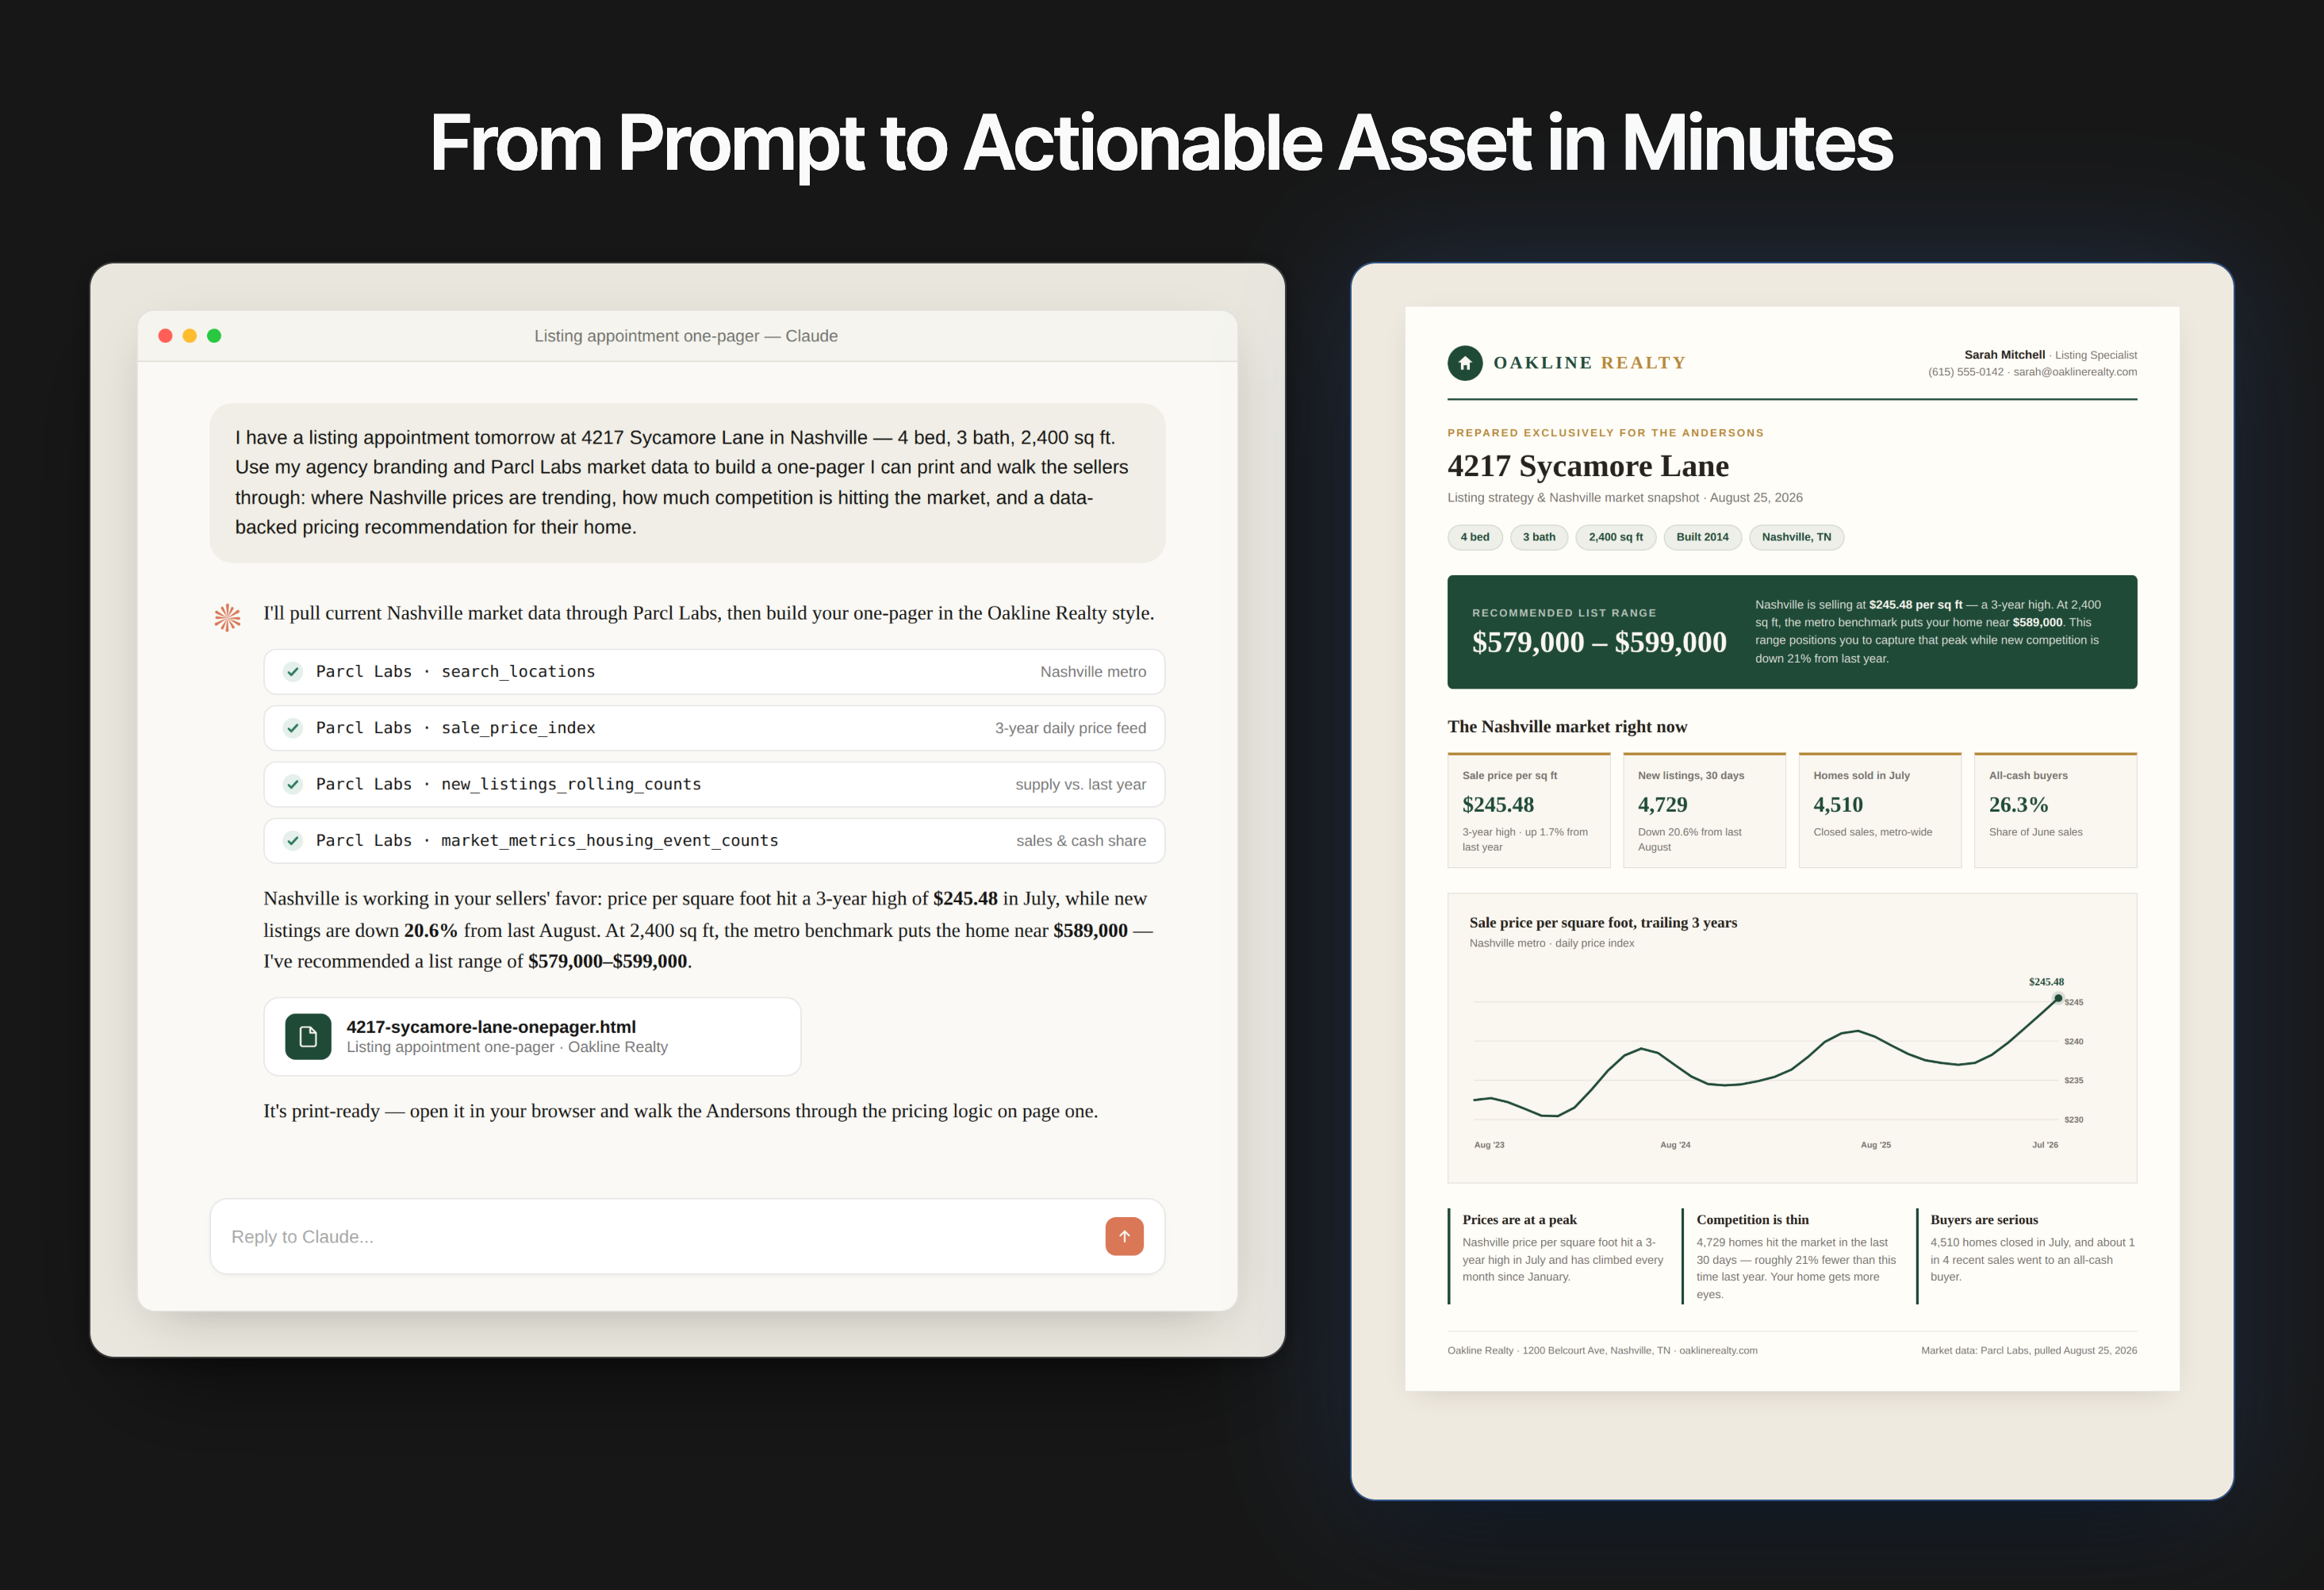
AI Connect brings Parcl's real-time housing data directly into Claude and ChatGPT, making it easy to move from a market question to finished marketing material in one prompt. An agent can ask their AI to pull key price and inventory trends and current seller-motivation data for a client's neighborhood, compare them with the metro, identify the story, and organize the findings into a clear, branded listing presentation.
That analysis can also become a seller handout, neighborhood social post, or recurring email update. Instead of piecing together data and copy across several tools, agents can create polished, on-brand content built on timely, local data.
Many of our agent clients have turned this process into custom AI skills they can refresh on demand. They tell us the Parcl-powered materials are better and more specific to the client, while taking a fraction of the time to produce.
Use Case #5: Pair Frontier AI With Trusted Housing Data
AI is becoming part of how agents research markets, prepare for clients, and run their businesses. During Parcl onboarding, many agents tell us they want to work with housing data directly through Claude or ChatGPT.
Frontier models can analyze large datasets, identify patterns, test claims, and present complex findings in plain language. Their output, however, is only as good as the information going in. General-purpose AI may draw from scattered, stale, or unreliable web sources, making citations difficult to follow and confident errors harder to detect.
Give the Model Better Housing Data
AI Connect pairs Claude and ChatGPT with the data behind Parcl HQ. That includes proprietary, granular intelligence across markets, properties, listings, ownership, financing, rentals, and investor activity that a general web search cannot reliably reconstruct.
Parcl's Model Context Protocol connection is designed specifically for AI analysis. It delivers structured data with clear sourcing, allowing the model to spend its tokens interpreting the market rather than locating, cleaning, and decoding raw inputs.
That combination improves reliability and expands the analysis agents can perform. They can compare markets, connect property activity with broader trends, investigate an address, or turn a complex dataset into a clear client takeaway.
Try Asking AI Connect
Compare seller motivation, price cuts, and inventory across [ZIP code A], [ZIP code B], and [city]. Which market is softest today, what is driving the difference, and what are the three takeaways my clients need to hear?
I am meeting with the owner of [address]. Pull the property's full listing and sale history, show me its current competition, and explain how conditions in its ZIP code compare with the metro.
Here are the addresses from past listing appointments. Identify the homes that still have not sold and remain with the same owner, summarize what has happened since, and prioritize the strongest re-engagement opportunities.
A local headline says home sales in [metro] fell [X%]. Verify the claim against monthly closed sales, show the math, explain any discrepancy, and give me a sourced correction I can share with clients.
AI Connect combines frontier reasoning with housing intelligence designed for the task, giving agents analysis that is faster, traceable, and far more useful than a generic answer. Ready to try it? Follow the AI Connect setup guide in Data Vault to connect Parcl to Claude or ChatGPT and start asking questions.
Turn Better Market Intelligence Into Your Edge
Real-time, granular housing data becomes a competitive edge when agents put it to work every day: spotting local shifts early, pricing with confidence, identifying sellers who need their help, and giving clients the local context generic market reports miss.
You can get started for free in Parcl HQ. When you are ready to go deeper, starts at $50 and unlocks full market access at every geographic level, property analysis, and AI Connect.
We are excited to see more agents adopt Parcl, and their feedback continues to shape what we build. We are also onboarding teams and brokerages that want to equip every agent with these capabilities. To bring Parcl to your team, email team@parcllabs.com.
Authors

Follow Us for More