
Fire Sale or Strategy: Inside One Institutional Investor's SFR Sell-Off
Jun 18, 2026 · 12 min read
A major institution has 8% of its SFR portfolio for sale. See who it is, what they're selling, and what the strategy shows.

Executive Summary
VineBrook Homes has ~1,575 homes on the market, 8% of its portfolio. No SFR operator we track has more homes actively listed as of mid June 2026.
Their selling is concentrated. Seven markets have 10% or more of VineBrook's local holdings listed, led by Atlanta at 22%. What's listed is the oldest slice of their portfolio.
Where it sells, VineBrook is a measurable share of the local supply market. VineBrook accounts for 10 to 19% of sub-$200K active listings in several metros and ~1 in 4 active listings in its densest ZIPs.
VineBrook's pricing strategy varies by market. Atlanta is the market to watch. Across its listings, VineBrook shows a 9.5% fire-sale rate versus 4.3% for the broader market, with faster and deeper price cuts. The pressure is most visible in Atlanta, where its listings run at more than 5x the metro fire-sale rate. That points to a targeted effort to reduce exposure in the country’s most concentrated institutional SFR market.
VineBrook appears to be using sale proceeds meet debt obligations and fund BTR acquisitions. Parcl Labs data identify new VineBrook BTR communities outside the tertiary Midwest markets that have historically anchored its portfolio. The shift also improves its regulatory position: the 21st Century ROAD to Housing Act’s proposed acquisition restrictions carve out BTR.
The next question is whether this remains contained or becomes a broader playbook. We are watching two signals most closely: whether VineBrook prices aging listings more aggressively, and whether other large institutional owners begin using similar scattered SFR disposition programs to fund BTR acquisitions. You can track both with us in Portfolio Hunter and the Data Vault.
The Backdrop: Institutional Investors Under a Microscope
Every large single-family rental operator in America is trying to answer the same question: what comes next? The 21st Century ROAD to Housing Act, even with its carveouts, puts hard limits on how these institutions can grow.
Parcl Labs has been at the forefront of tracking who the new rules capture and how the industry is reacting. In February, we showed investors were shifting toward selling across many major metros and identified Atlanta as the market to watch. In March, within hours of the Senate putting the 350-home threshold into the Road to Housing Act debate, we mapped the investor universe it would capture.
We track real-time listing, pricing, and transaction signals for every top operator to get early reads on who is making moves. Right now, one name stands out: VineBrook Homes. It is not the first time. In December 2023, Parcl Labs data broke the story on the surge in VineBrook’s for-sale activity. At the time, the sell-off was widely reported to be driven by the company's need to boost liquidity ahead of maturing debt.
VineBrook is a portfolio in transition, and what it is doing now looks to be driven both by balance sheet and strategy. We have the data. Here is what we found.
8% of VineBrook's Portfolio Is For Sale
VineBrook owns ~20,000 single-family homes. The company is focused on workforce housing and built its book in tertiary markets most institutional capital passed over: Cincinnati (2,492 homes), Dayton (1,985), St. Louis (1,693), Columbus (1,559), Indianapolis (1,182), and Memphis (961).
As of mid June 2026, 1,575 of those homes are on the market, 8% of the company's portfolio. No institutional SFR operator we track has more homes actively listed.
Every Home VineBrook Owns, and Every Home It Is Selling
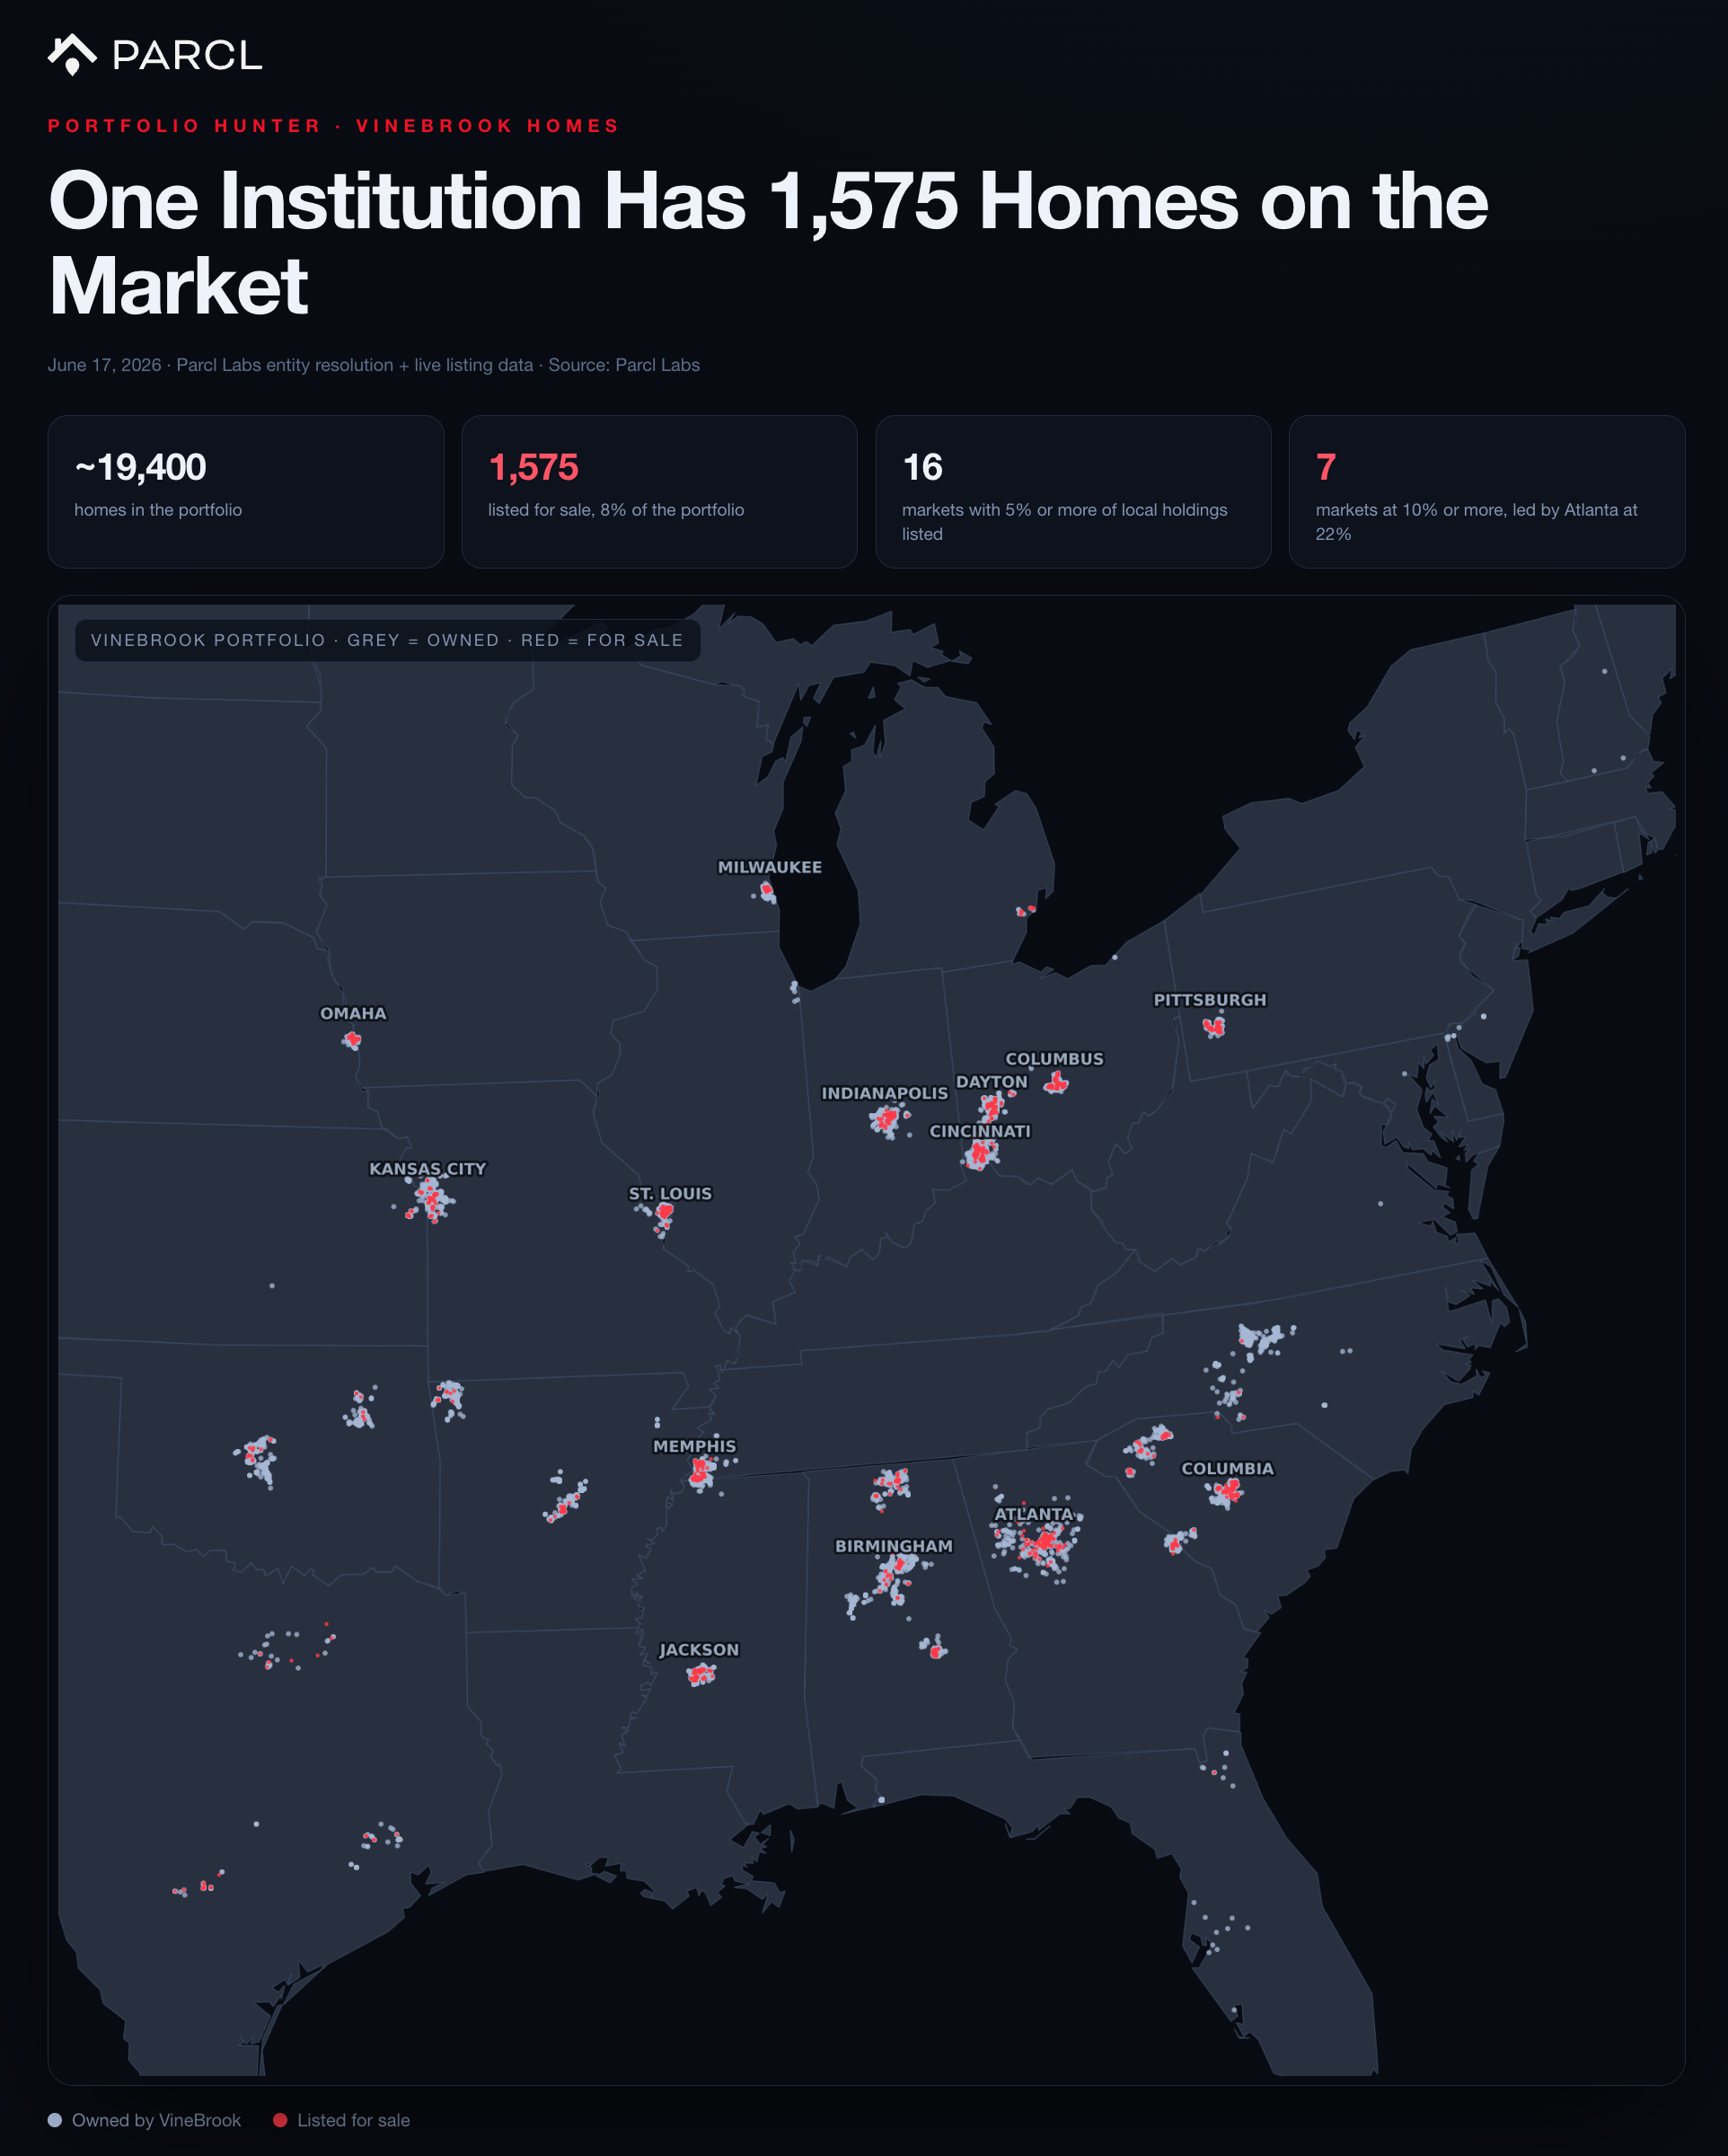
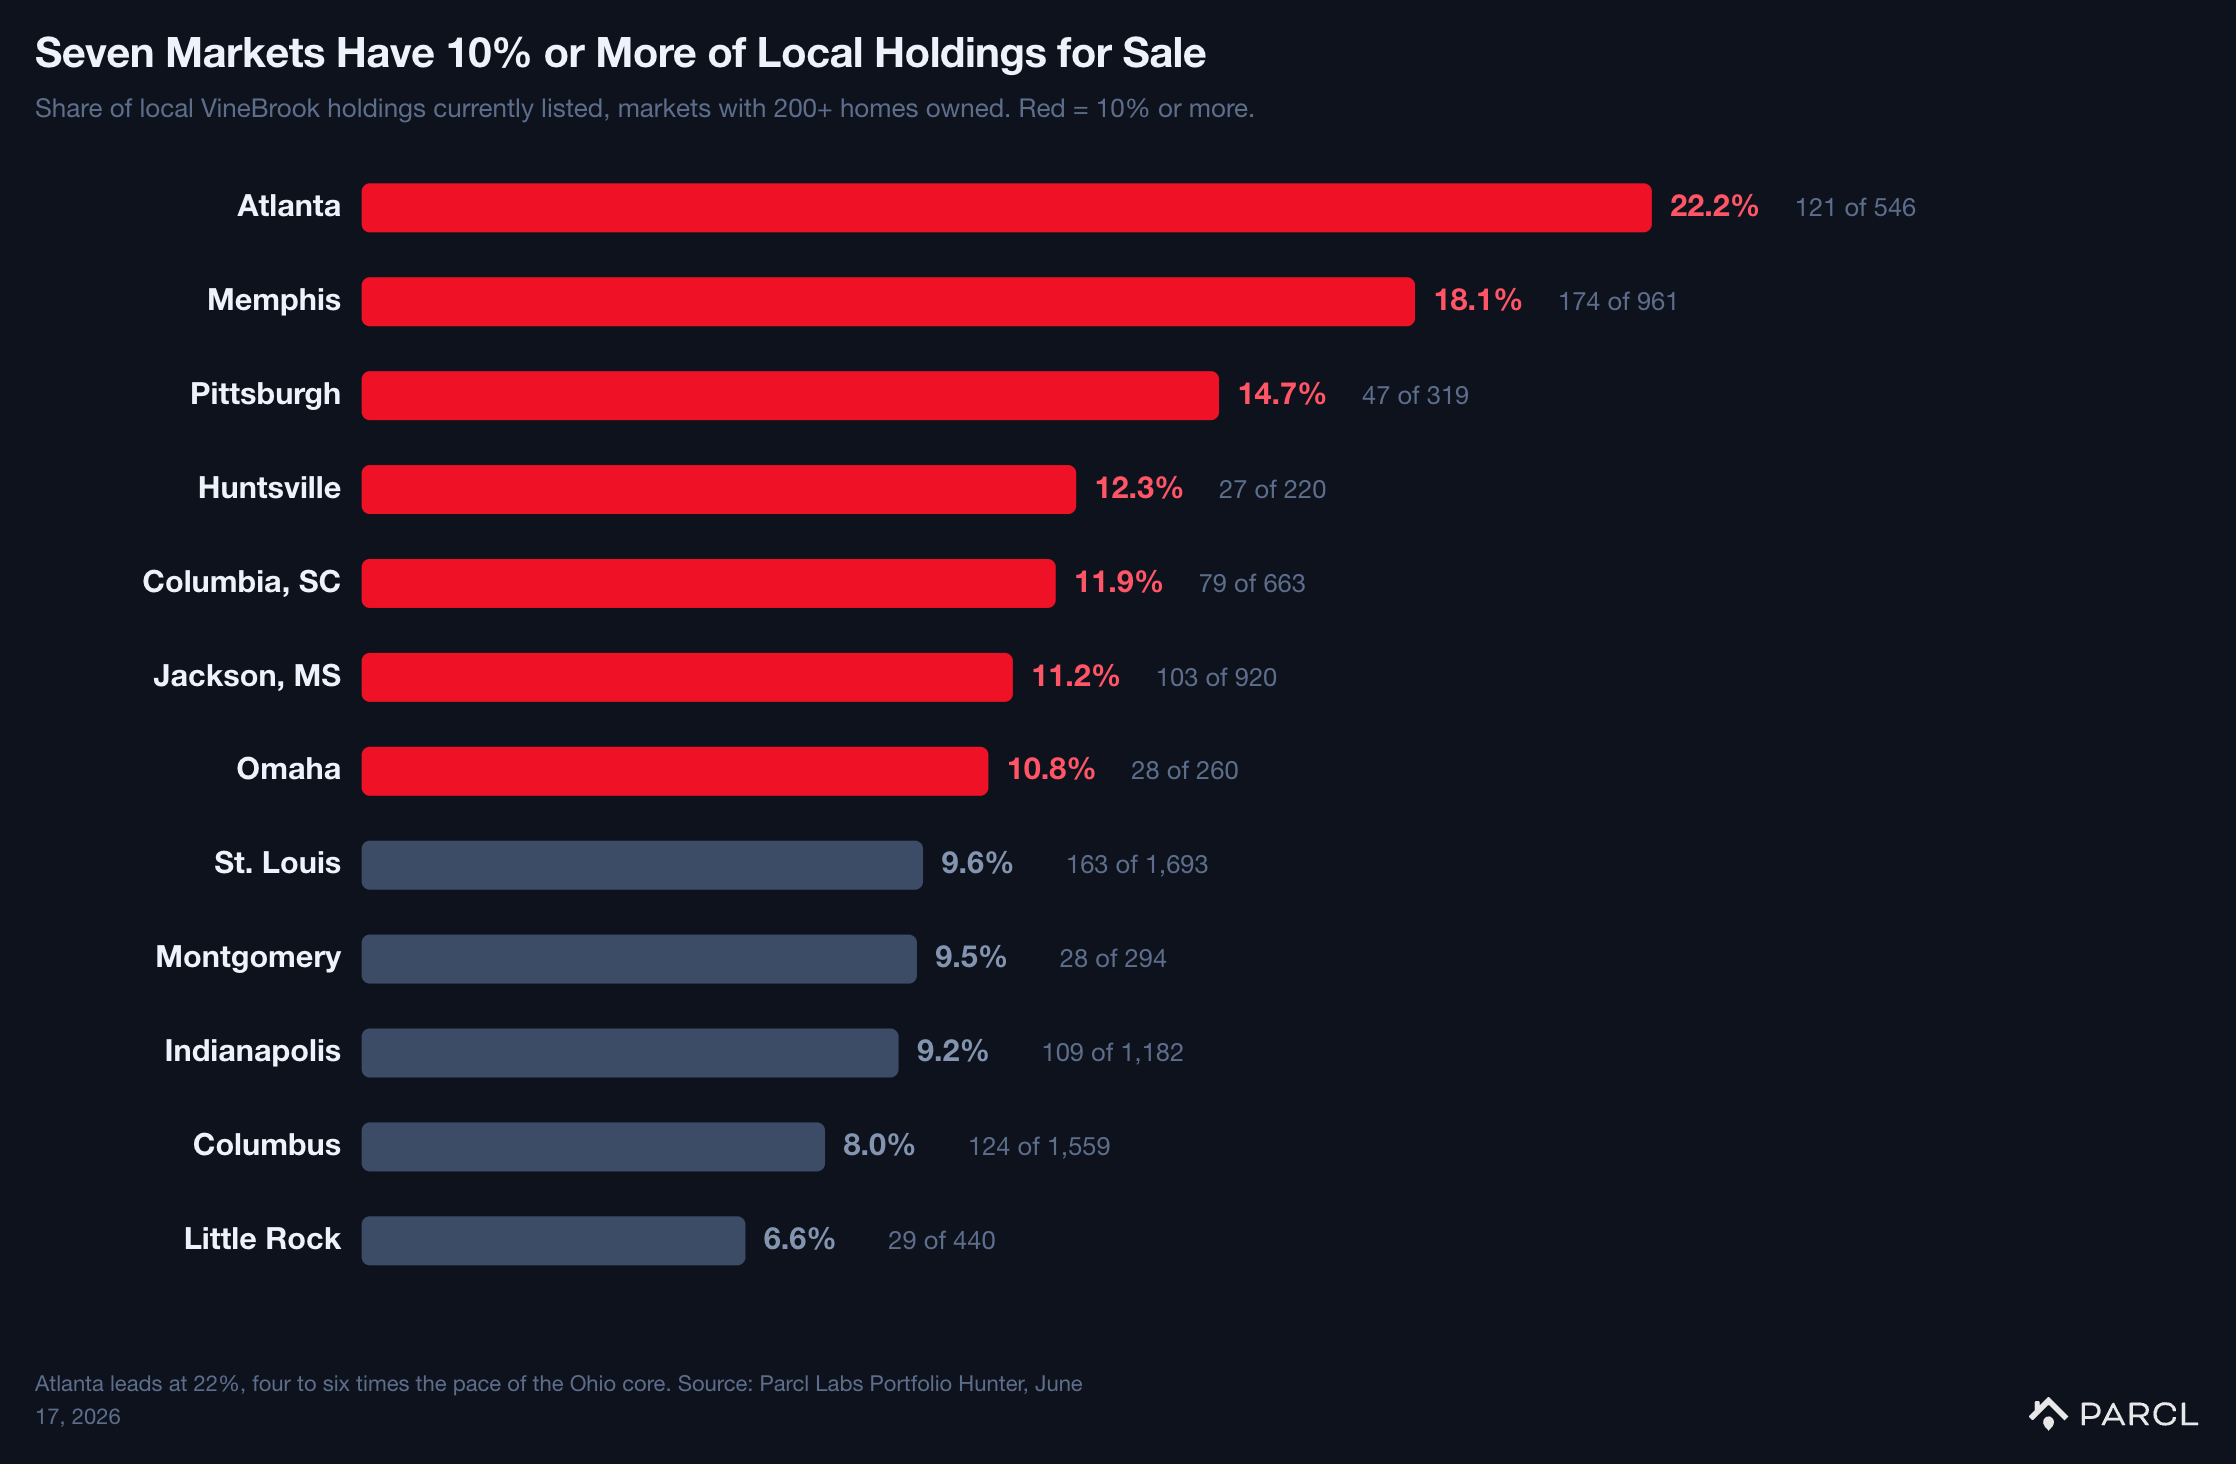
The selling is not evenly spread. In seven markets, VineBrook has 10% or more of its local holdings listed: Atlanta (22%), Memphis (18%), Pittsburgh (15%), Huntsville (12%), Columbia, SC (12%), Jackson (11%), and Omaha (11%). The Ohio core, the heart of the portfolio, holds at 4 to 6%.
Seven Markets Have 10% or More of Local Holdings for Sale
Geography shows where VineBrook is selling. The listing-level property details show what it is selling: older, smaller, lower-priced homes. The typical VineBrook listing is a 1960 build, 1,250 square feet, with three bedrooms and one and a half baths, asking $144,900, or $117 per square foot. By comparison, the median active single-family listing across VineBrook’s core markets was built in 1987, spans 2,032 square feet, and lists for $176 per square foot. In other words, VineBrook is selling homes that are about 25 years older, roughly two-thirds the size, and a third cheaper per square foot than competing listings nearby.
VineBrook's Sell Box
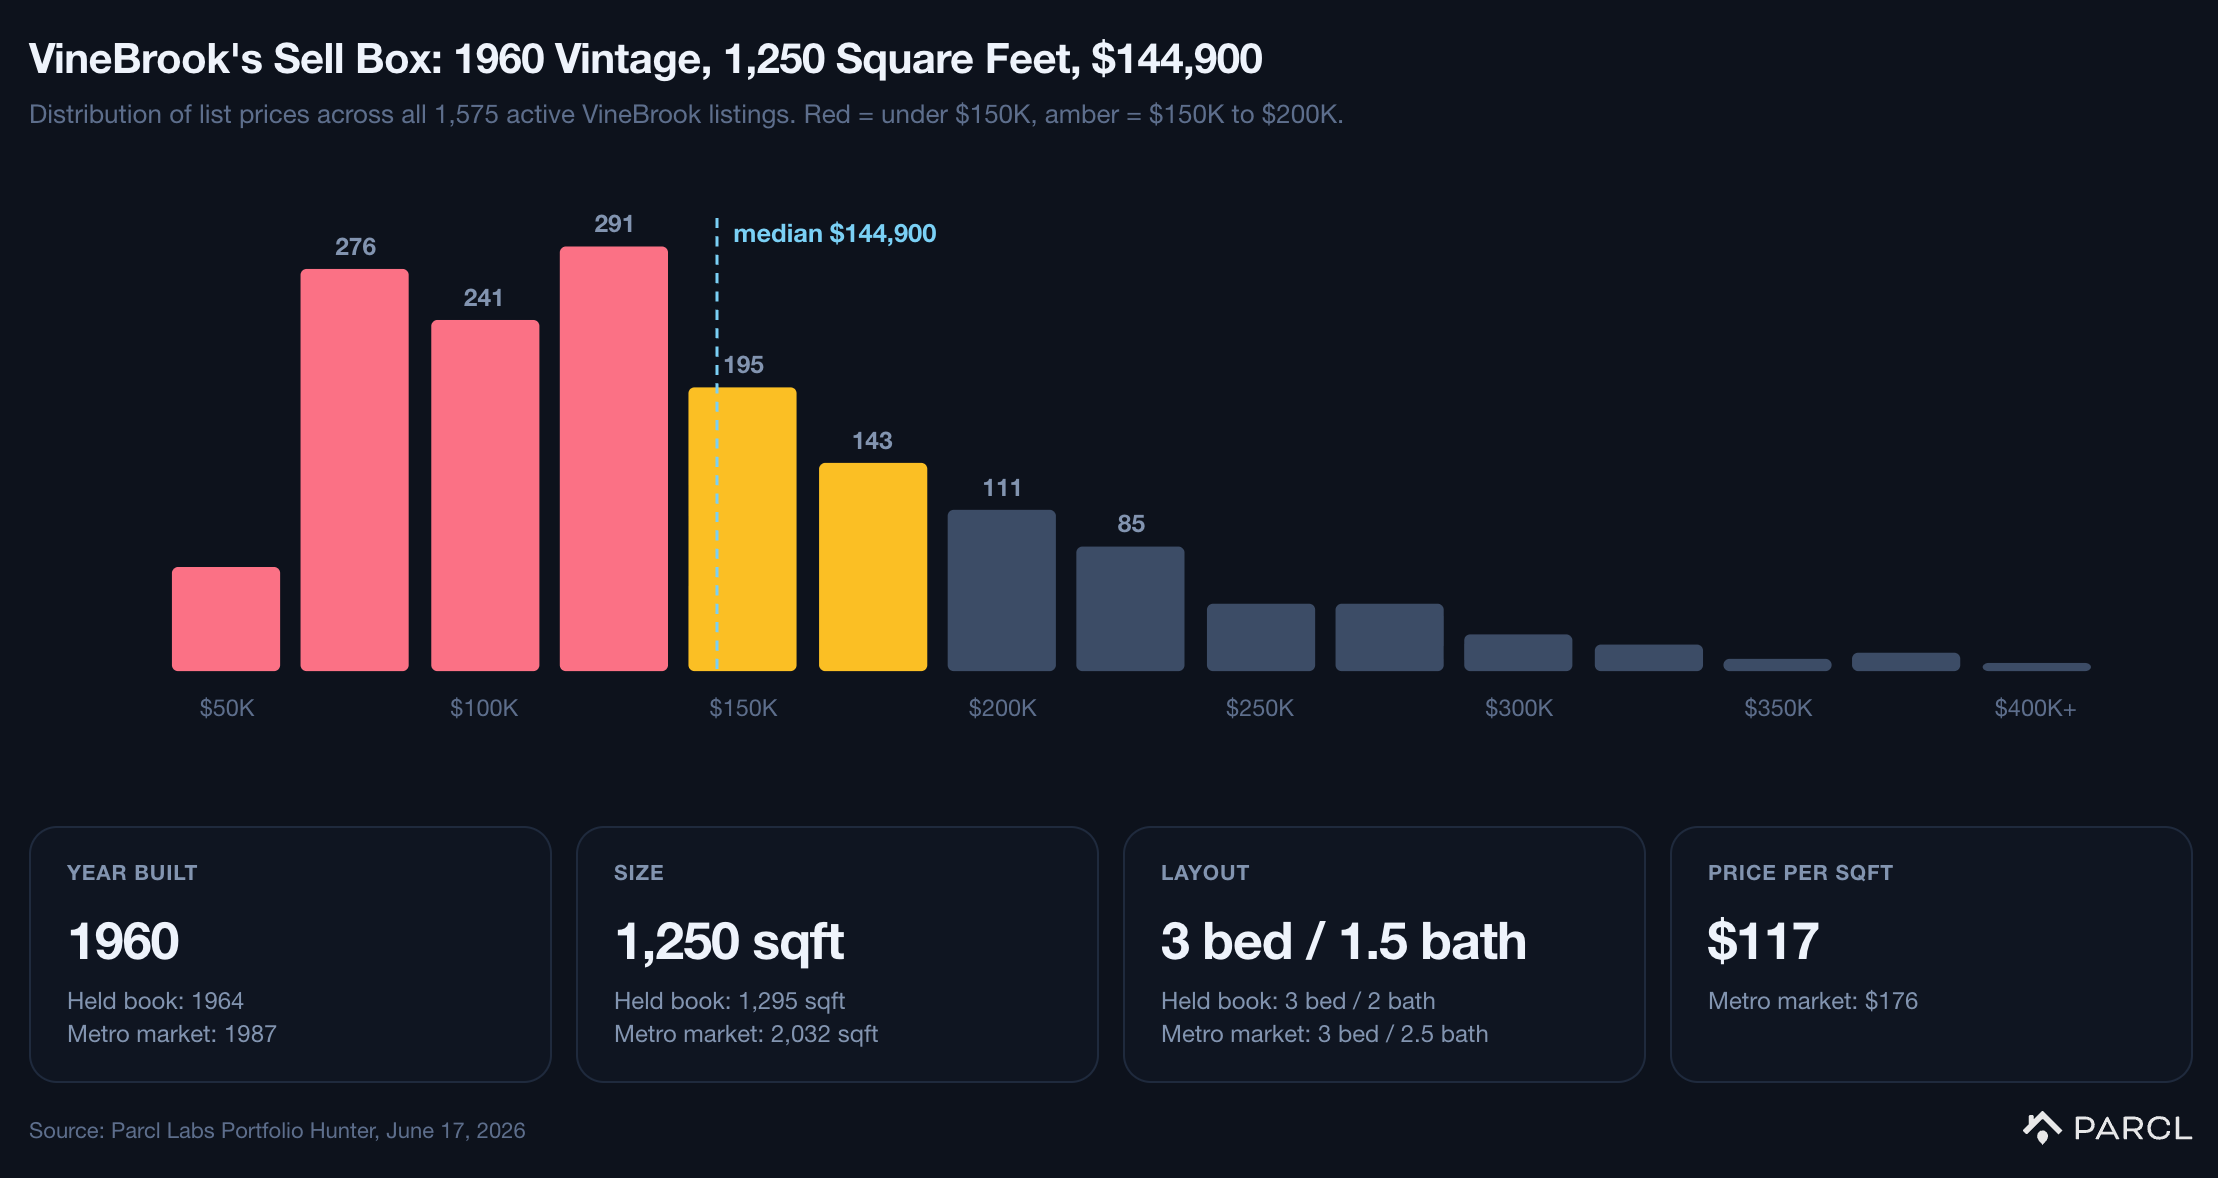
This sell box is the oldest portion of VineBrook’s own book. The homes it has listed run older than the homes it continues to hold, and the 2000s-and-newer stock it owns barely appears in the listings. VineBrook seems to be high-grading its portfolio in real time.
Can VineBrook Move the Market?
What does VineBrook's increased for sale activity mean for the housing market? Our research on institutional scale is consistent. The entire 350-home-plus cohort owns ~0.66% of US single-family stock, too small a footprint to impact prices or supply nationally.
We have been equally consistent about the flip side: these operators are highly concentrated. They own specific product in specific places, and when a larger operator moves decisively, it can meaningfully shift hyperlocal market dynamics, at least in the short term.
VineBrook is demonstrating this right now by putting a large number of homes on the market at once in one narrow segment.
Where the Selling Concentrates
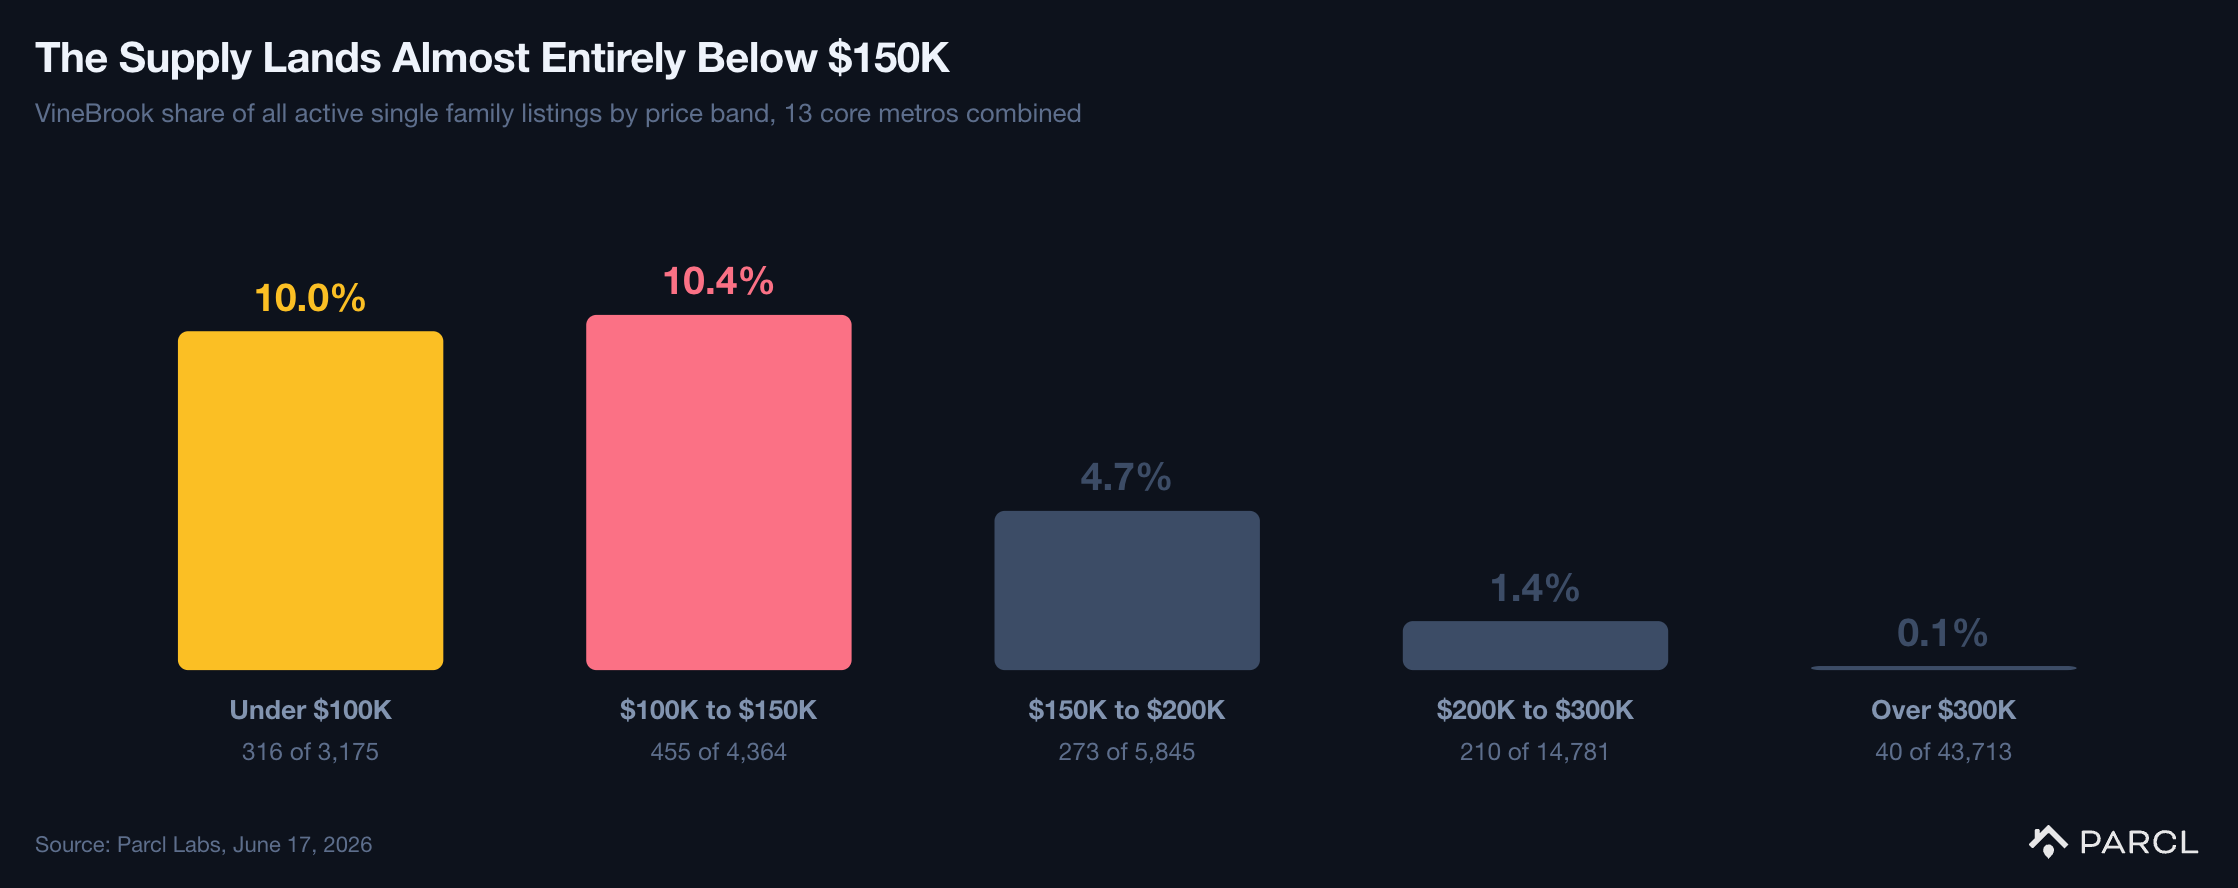
Start with price. Across its 13 core metros combined, VineBrook accounts for 10% of all active single-family listings under $100K and 10.4% of everything between $100K and $150K. Above $300K, its share is 0.1%.
VineBrook Share of All Active Single Family Listings by Price Band in Core Markets
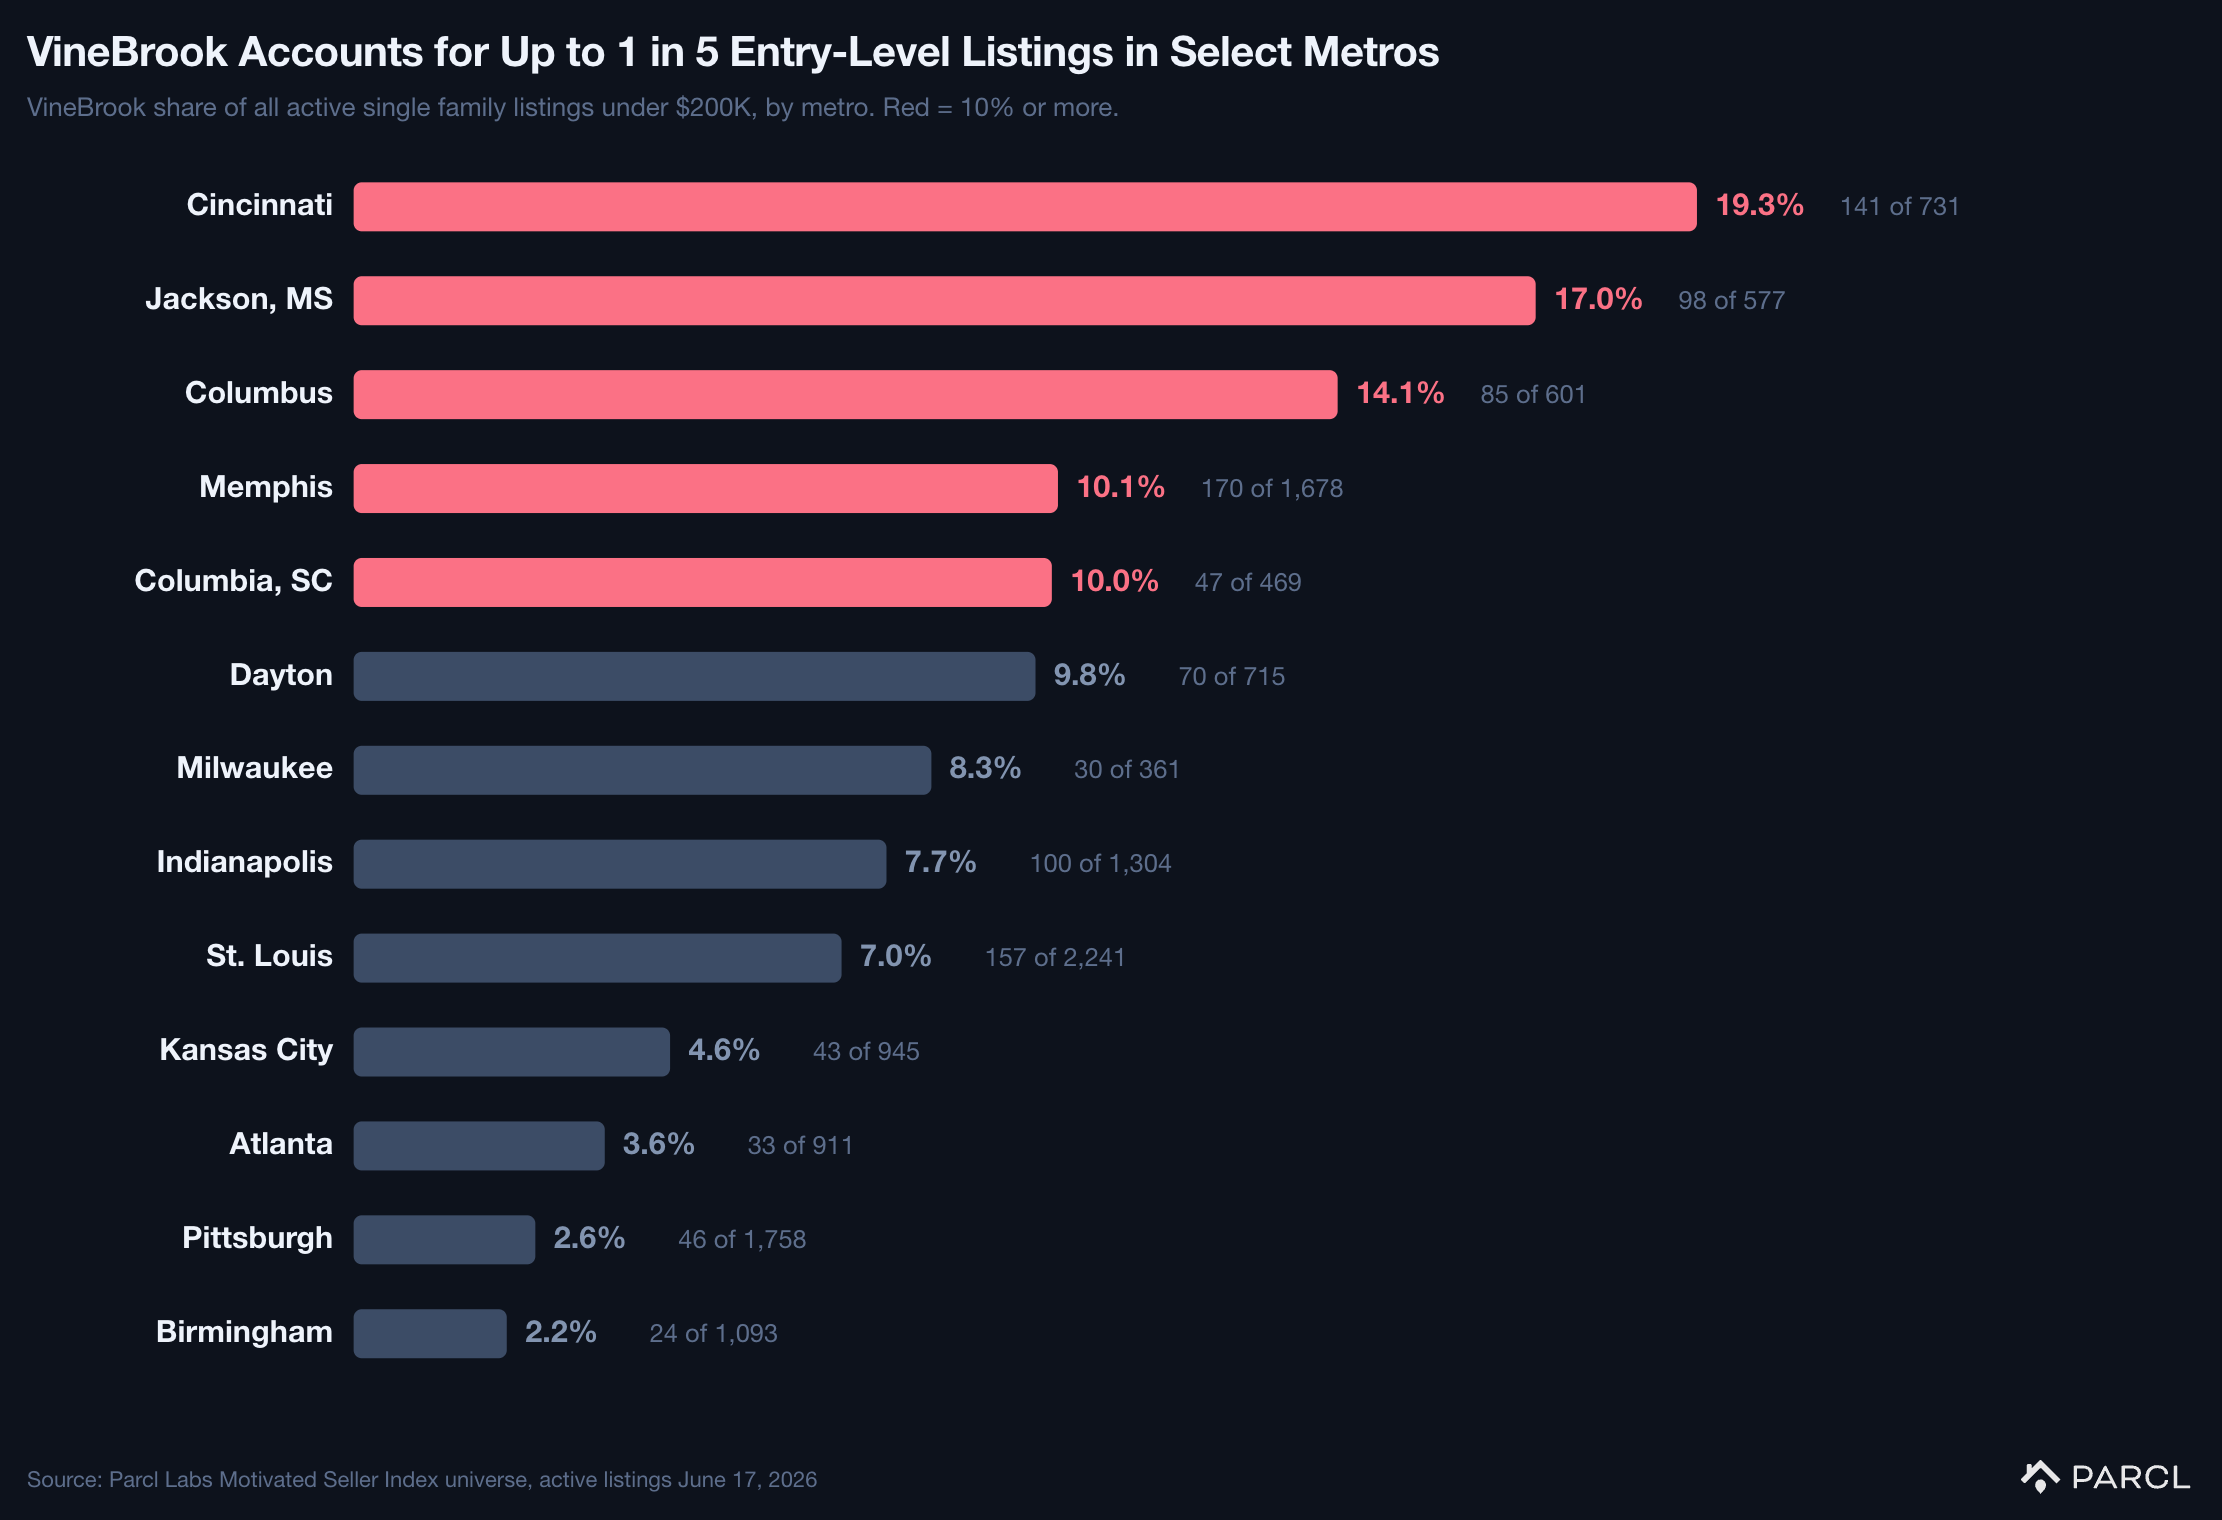
The concentration is even clearer at the metro level. Measured as a share of all active single-family listings under $200K, VineBrook accounts for 19.3% of the market in Cincinnati, 17% in Jackson, 14.1% in Columbus, 10.1% in Memphis, and 10% in Columbia, SC.
VineBrook Accounts for Up to 1 in 5 Entry-Level Listings in Select Metros
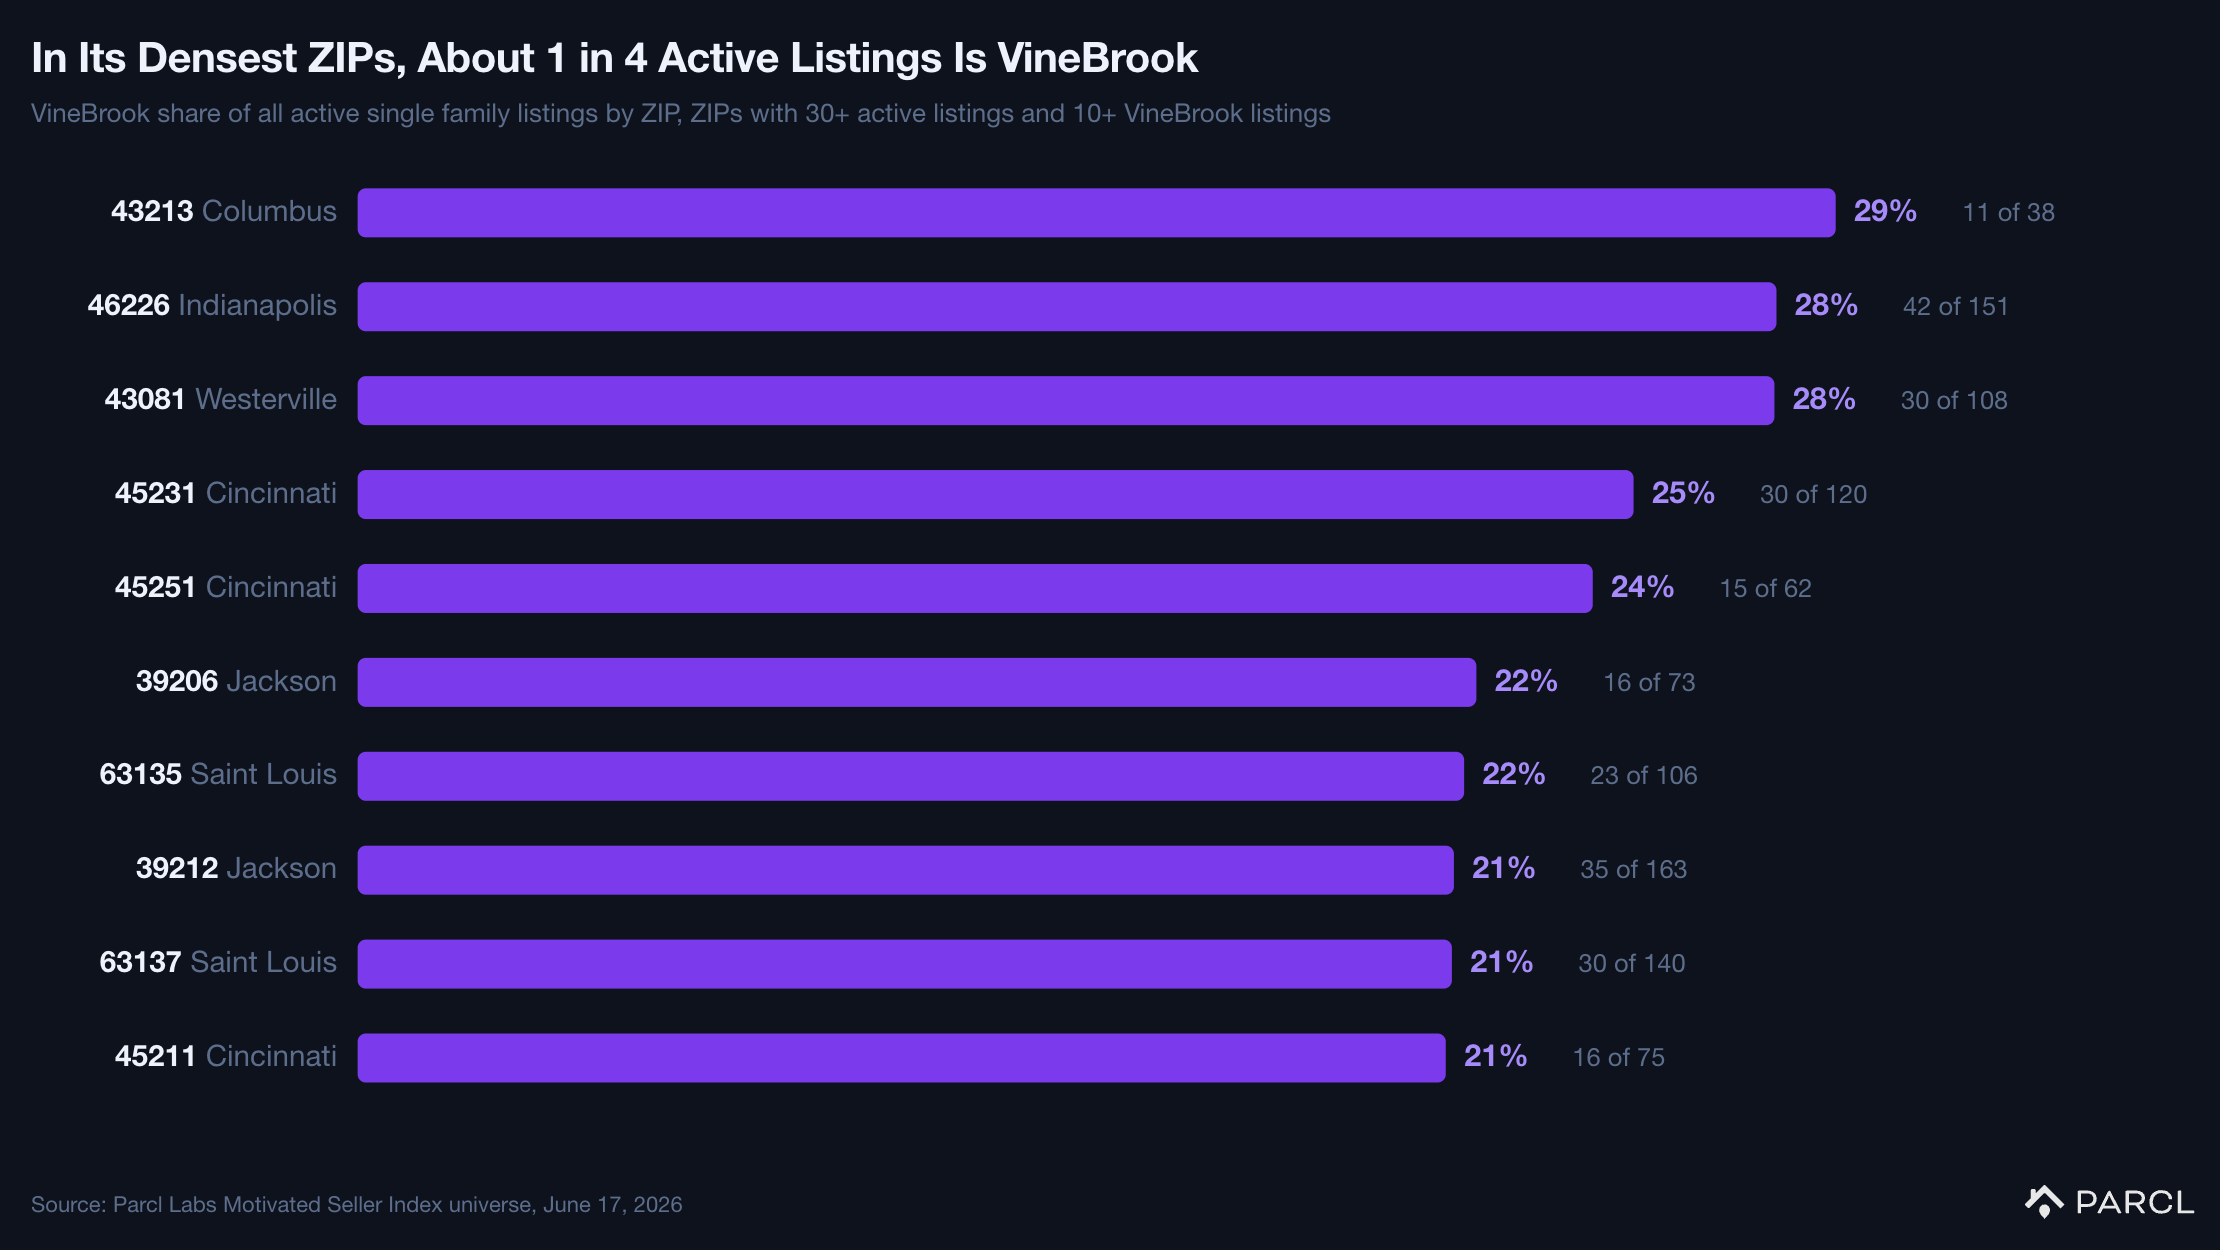
Concentration peaks at the ZIP level. Among ZIPs with at least 30 active listings, VineBrook accounts for ~28% of all active single-family listings in Indianapolis's 46226 and in Columbus's 43213. In its densest submarkets, close to one in four active listings belongs to VineBrook.
In Its Densest ZIPs, About 1 in 4 Active Listings Is VineBrook
We have seen this pattern before. In 2023, VineBrook concentrated supply in a handful of ZIPs, priced aggressively, and cut until it cleared. That establishes the scale and the concentration. The next question is how VineBrook is pricing it.
Priced and Motivated to Leave
Pricing behavior separates routine portfolio management from a distressed exit. We measure that behavior directly with the , or MSI. MSI scores every active listing from 0 to 10 across four signals: time on market, price-cut frequency, price-cut depth, and price-cut speed.
Compared with other active listings in its core markets, VineBrook’s listings show more aggressive seller behavior across key pricing metrics: a 9.5% fire-sale rate (listings scoring MSI of 7.5 or higher) versus 4.3%, faster price cuts, and a 7.7% total discount versus 4.3% once price cuts begin.
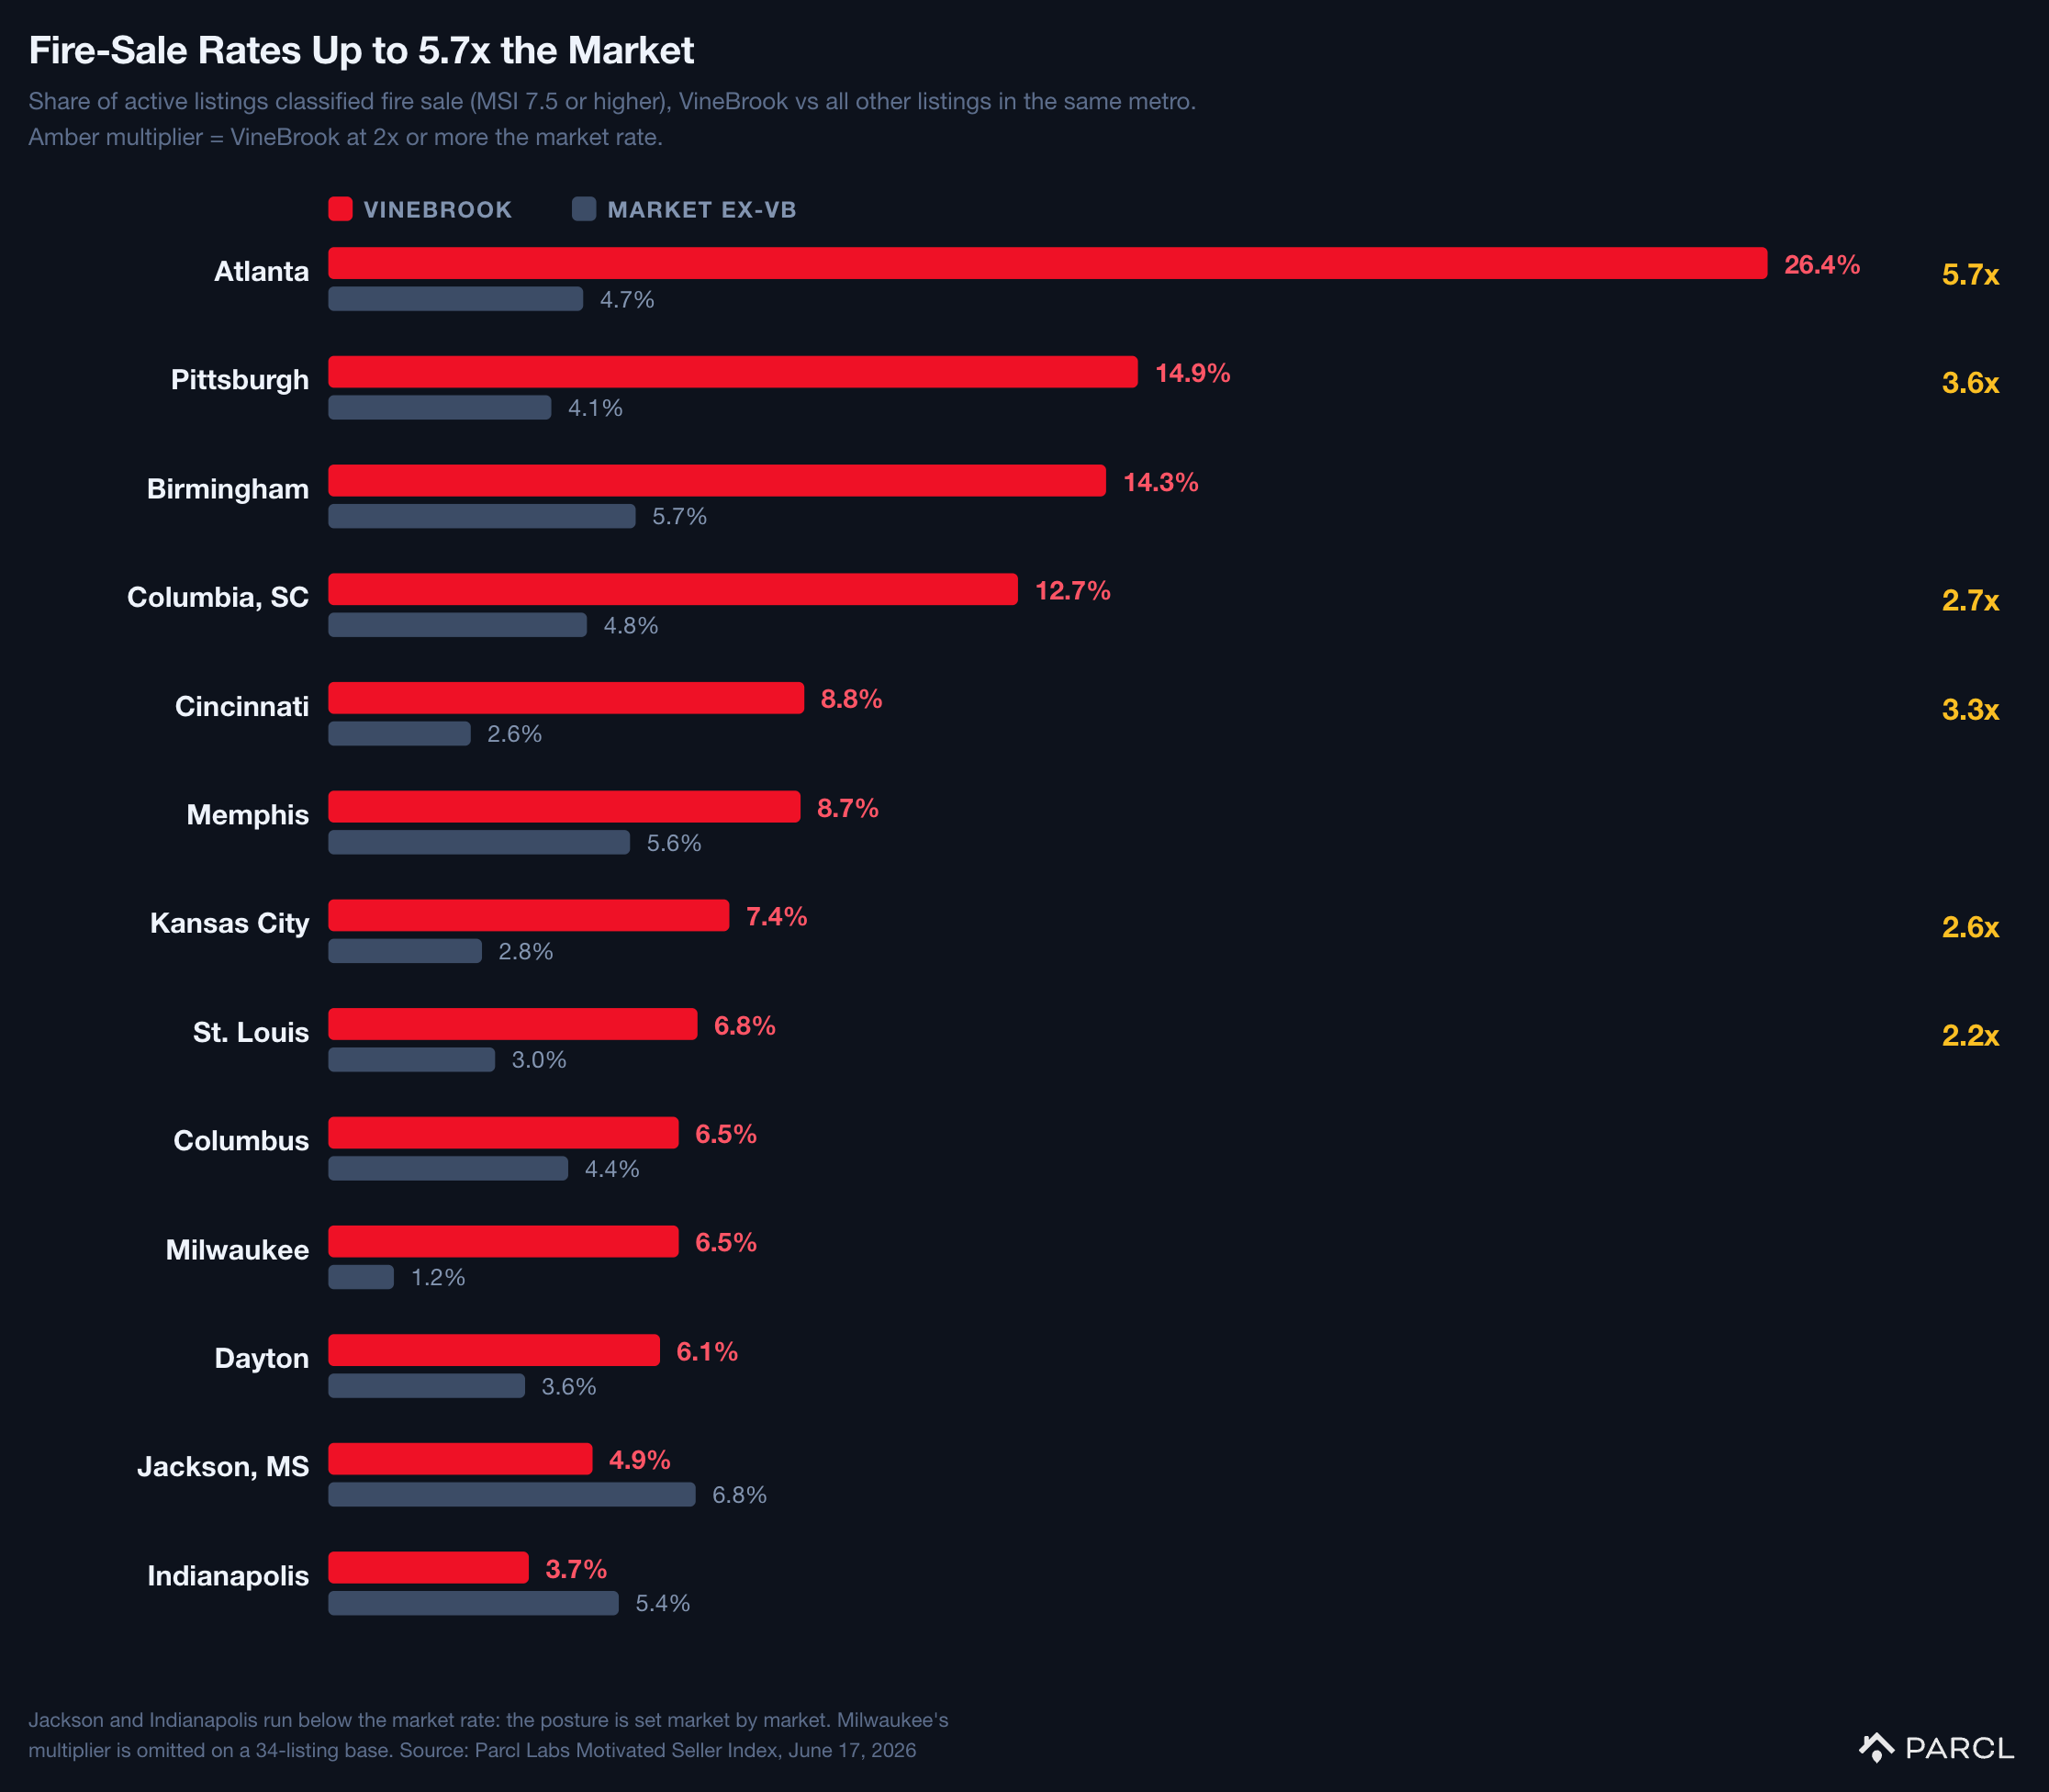
Market-level MSI scores show that VineBrook’s strategy is not uniform. In some metros, the company is more patient: in Jackson, its listings average an MSI of 1.18 versus 2.33 for the market; in Indianapolis, 1.56 versus 1.84. In other metros, VineBrook is far more aggressive, with fire-sale rates running at multiples of the market.
Fire-Sale Rates More Than 5x the Market
No market shows the aggressive end of that posture like Atlanta.
Atlanta Is the Market to Watch. Again.
Atlanta is the first place we look for any institutional housing story. Our 350-home ownership map shows why: no metro in the country is more concentrated, and in Atlanta's densest ZIP codes, investors holding 350+ homes own more than one in ten homes.
Atlanta Is the Country's Most Concentrated Institutional Market
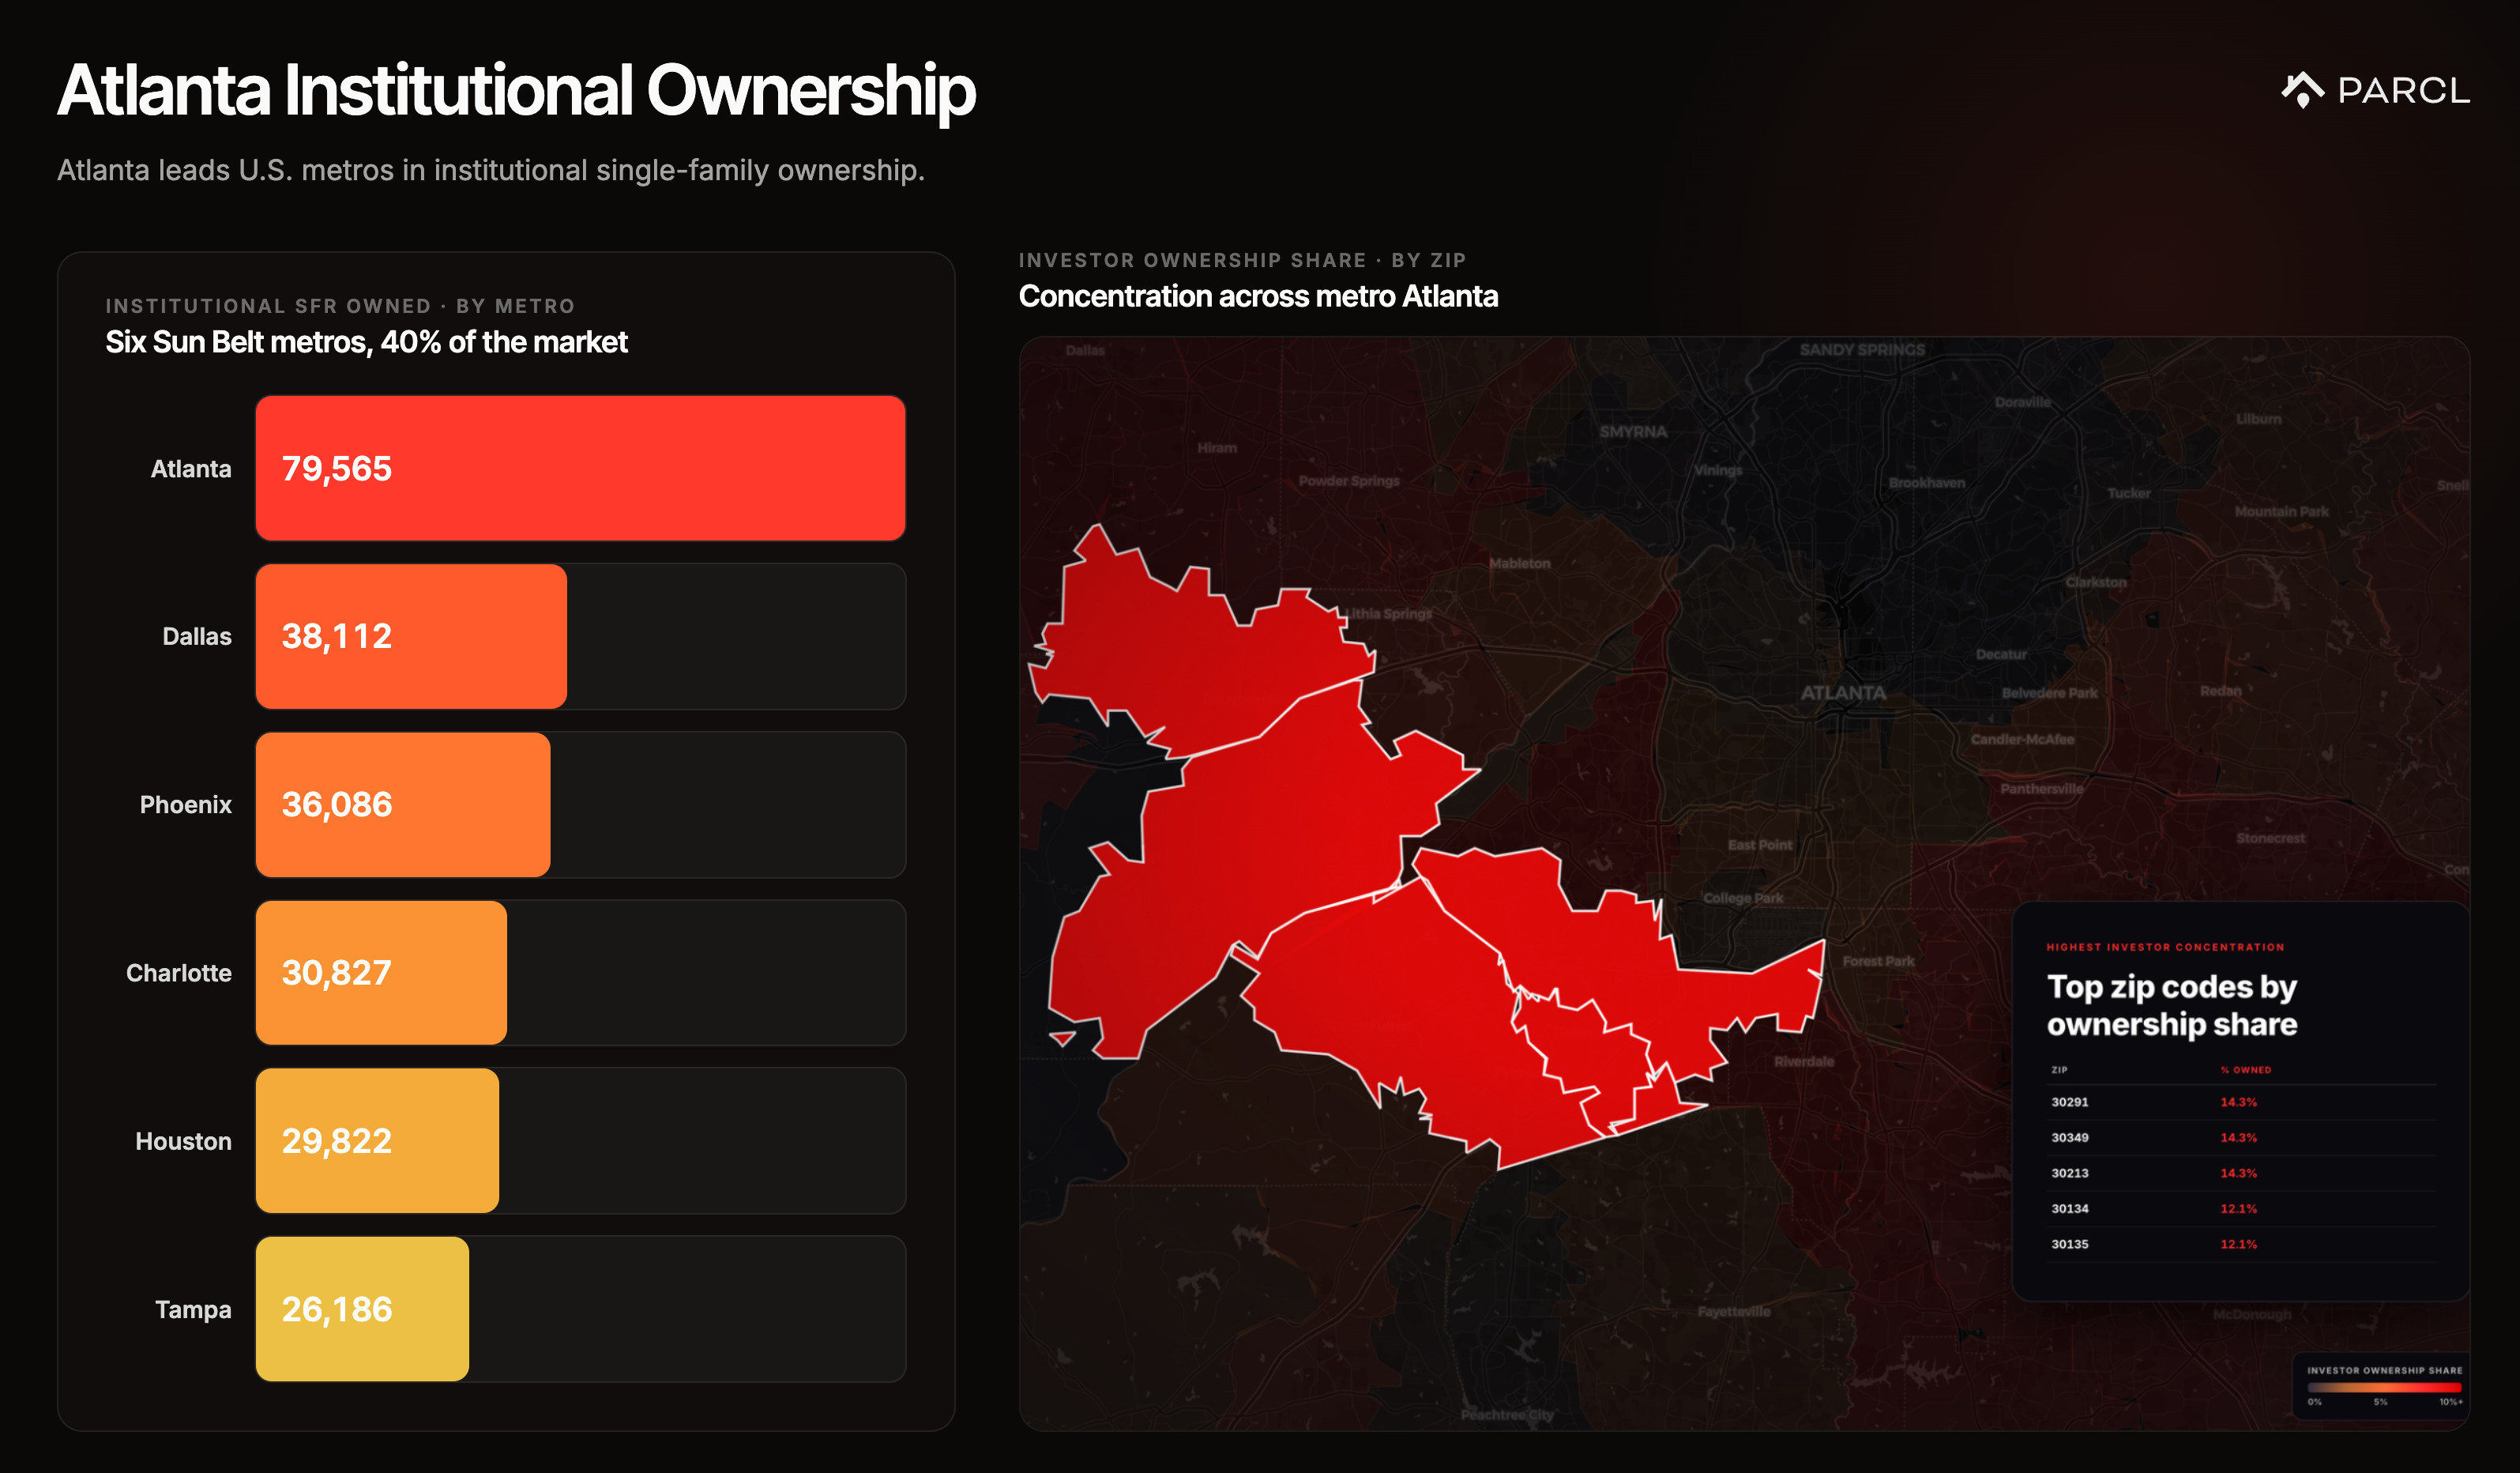
We have been watching for signs that this concentration is turning into selling. Our analysis of the 21st Century ROAD to Housing Act found that Atlanta's investors have shifted decisively to net selling as a cohort, and that the for-sale activity of the largest 350-home operators clustered exactly where their ownership is densest: the suburbs south of the city.
It is now clear VineBrook is driving a share of that institutional selling, and doing it more aggressively in Atlanta than anywhere else in its portfolio. The company has 22% of its Atlanta holdings on the market, its highest share in any market. Those listings carry an average MSI of 3.52 against 1.89 for the metro. One in four is a fire sale, more than 5x the market rate, the median sits 82 days on market versus 56, and 59% carry a price cut versus 34%.
Atlanta: More Than One in Five VineBrook Homes Is on the Market
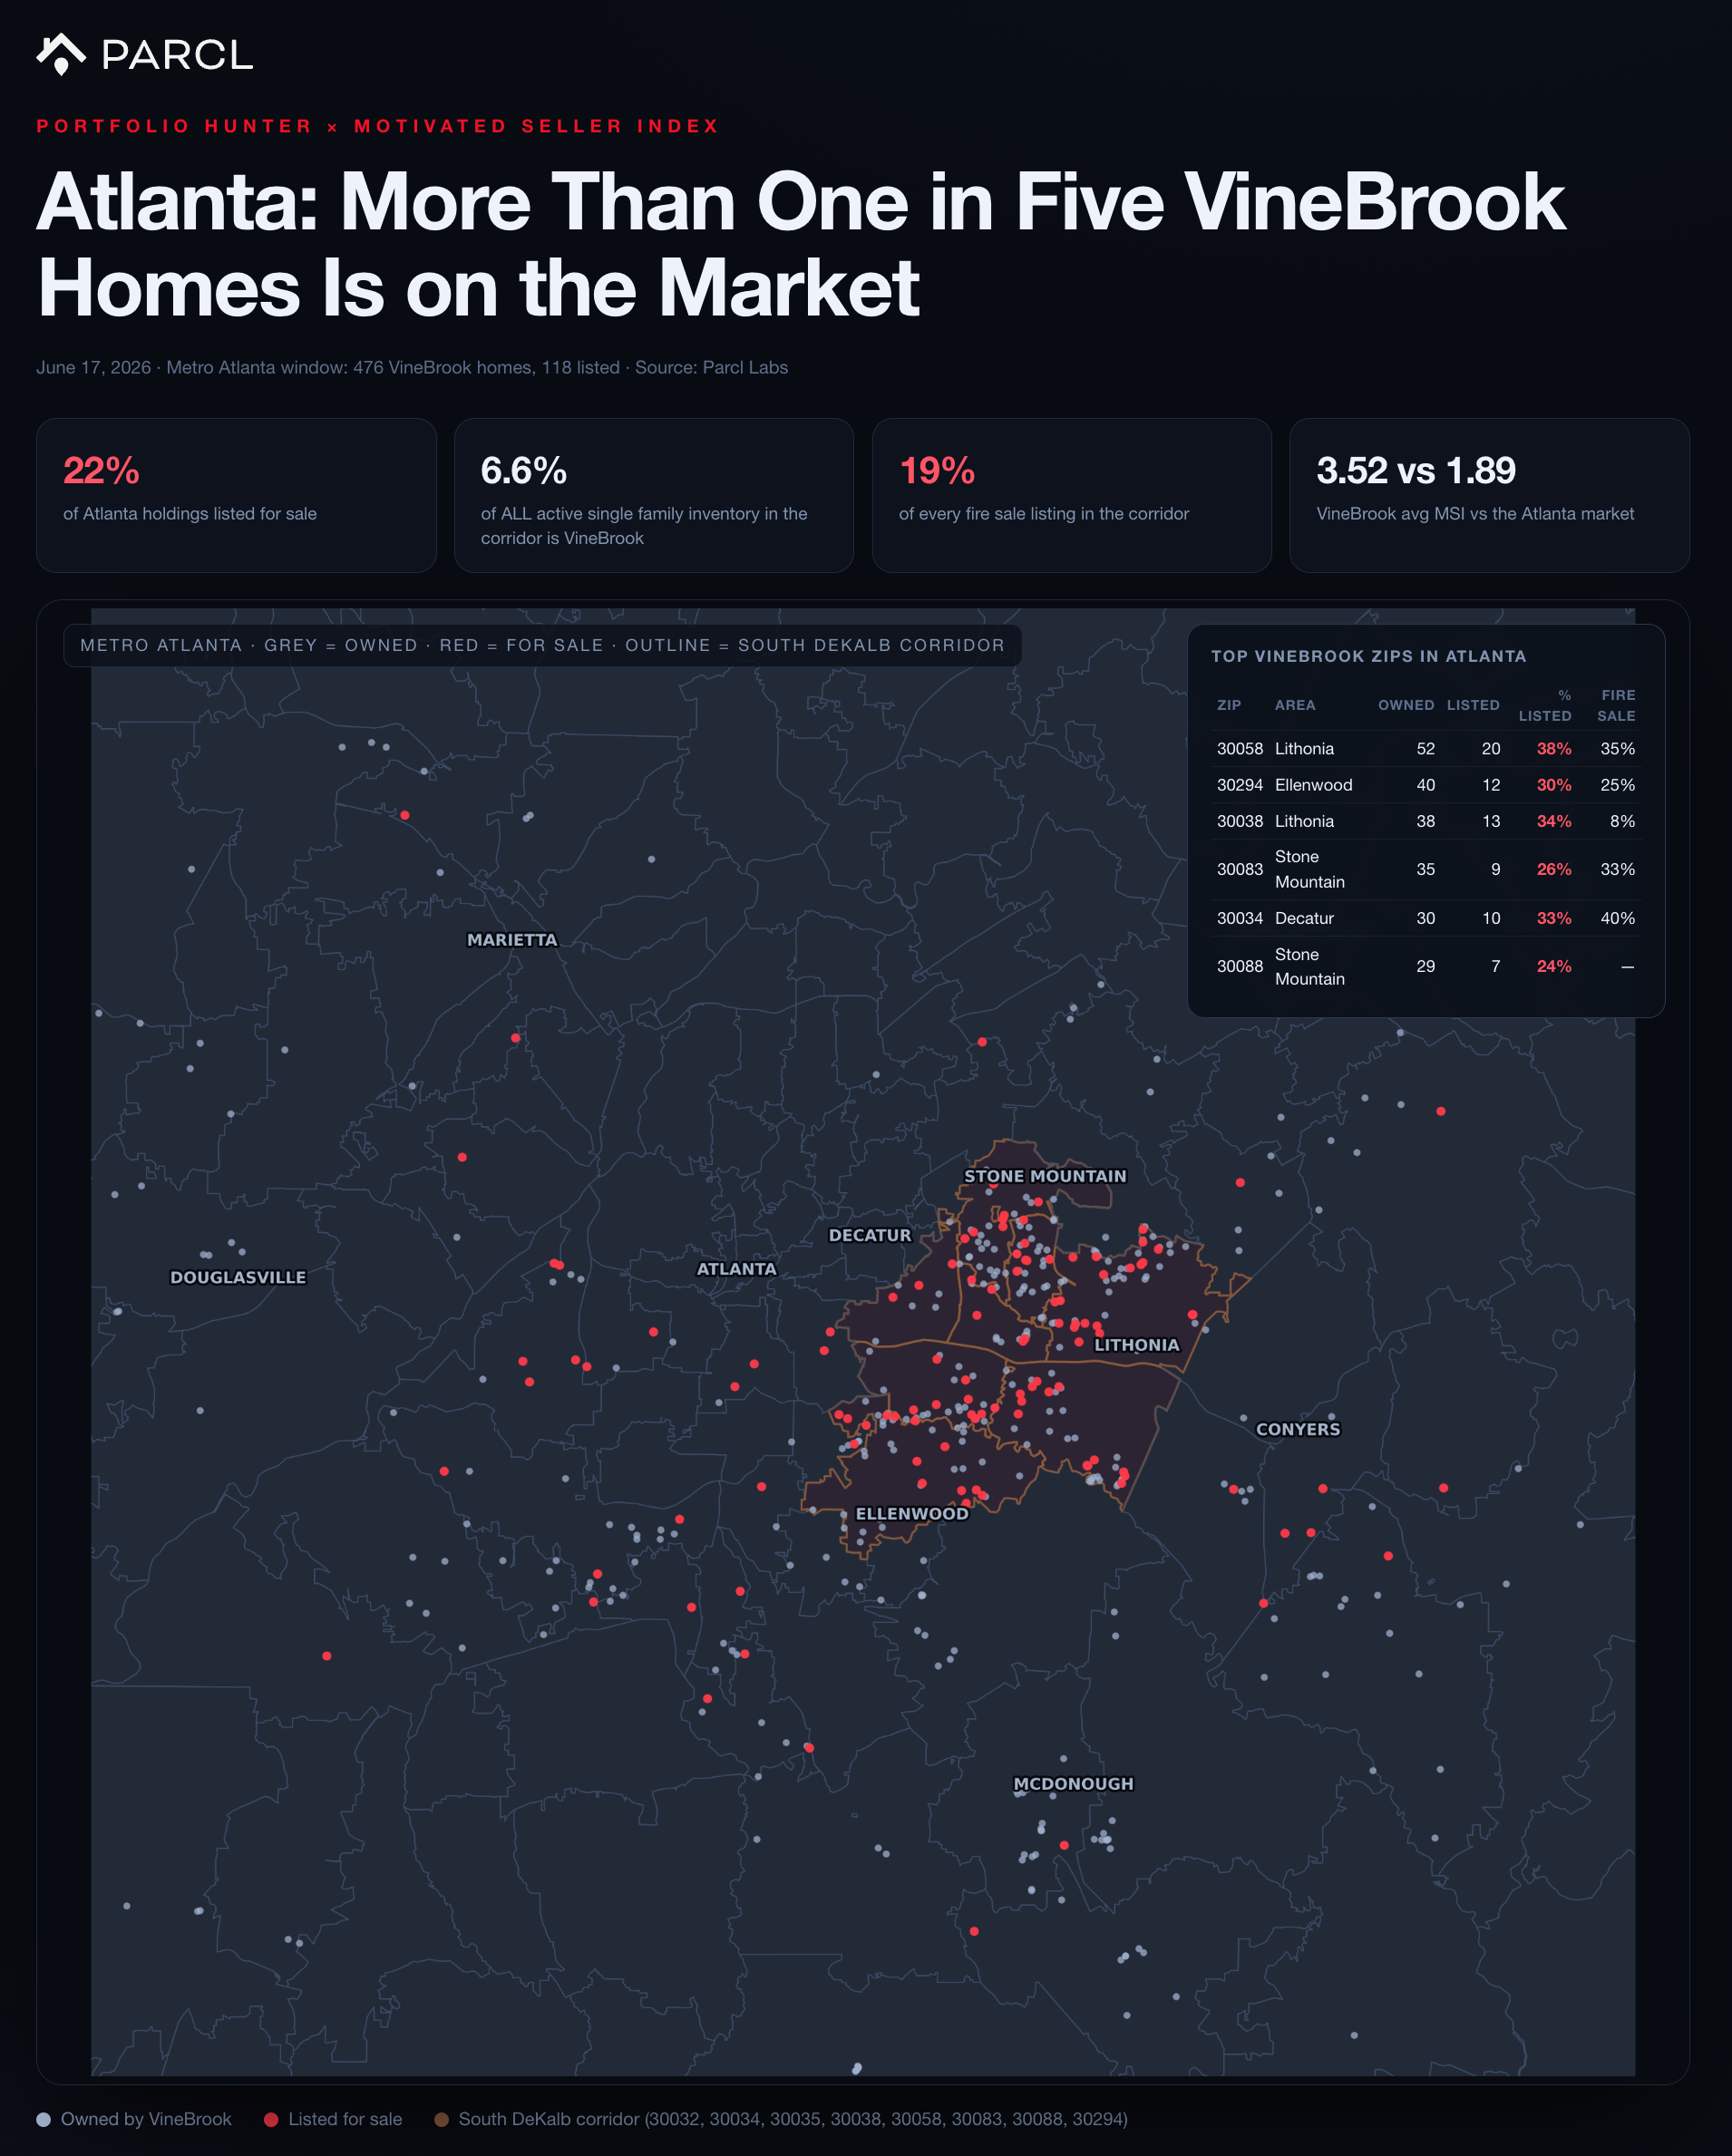
The map shows how local the exit is. VineBrook's Atlanta holdings sit southeast of the city, and its listings concentrate inside the South DeKalb corridor: Decatur, Lithonia, Stone Mountain, and Ellenwood. There, VineBrook alone accounts for about 6.6% of all active single-family listings and roughly one in five fire-sale listings, and in its top corridor ZIPs a large share of everything it owns is on the market. It is the same stretch of the metro where institutional ownership is densest, and VineBrook's exit is concentrated right inside it.
The Other Side of the Trade: Rotating Into BTR
VineBrook’s for-sale wave is only part of the story. The company is in the middle of a broader transformation, and the selling makes sense alongside what it is buying.
Information about VineBrook’s strategy is public in its filings. In late 2025, the company externalized its operations, handing day-to-day property and asset management to Evergreen. It also told investors it would dispose of lower-yielding homes while acquiring BTR assets.
It is a real pivot. VineBrook built its book on old, cheap, scattered houses. BTR is the opposite: new construction, bought a whole community at a time.
Our data show this change playing out live at the property level. In Pensacola, Florida, VineBrook recently acquired Walker Heights, a 77-home BTR community, from D.R. Horton for $18.3 million.
The company's filings also point to a second driver: "significant debt obligations" over the next year that its own disclosures say current liquidity cannot fully cover, with home sales named as one of the ways it plans to bridge the gap.
VineBrook’s new buy box contrasts with its sell box. It is adding new construction in Sun Belt markets like Florida, while selling older scattered-site home across its tertiary Midwest markets.
These moves help position VineBrook for the regulatory regime taking shape: the proposed acquisition restrictions discussed earlier carve out BTR.
What We're Watching
What's next for VineBrook? Parcl Labs data updates in real time, so we will continue to track VineBrook’s trades as they happen and measure how the company executes. Right now, its for-sale activity appears to be still building. The question now is whether the process remains an orderly rotation or starts to look more forced.
Key signals we will be monitoring:
The pace of the selling. Is this the peak, or another step up? Their new listings rose sharply into the spring and hit their highest month yet in May.
How VineBrook prices what does not sell. As listings age and debt comes due, does the company hold its prices or chase the market down with faster, deeper cuts? The Motivated Seller Index will show whether they start to price more aggressively to clear out these positions.
Whether the supply moves local prices. In the ZIPs where close to one in four active listings is VineBrook's, does this much inventory pull down comps?
Whether the playbook spreads. As the policy landscape becomes clearer, BTR looks better positioned. We will watch whether other institutional owners adopt a similar approach: dispose of scattered-site homes one by one and use the proceeds to fund BTR expansion.
How to Track What Happens Next
You can track VineBrook along with us.
maps true ownership so you can watch VineBrook directly: every home it owns, every active listing, and historical and real-time transactions.
The analyzes the listings themselves, showing how institutions like VineBrook are pricing and selling against the broader market.
You can tap into this data through the Portfolio Hunter interface, or go straight to the ownership, listing, and transaction data underneath in the .
VineBrook's next move will show up here first.
Methodology
All listing and portfolio figures reflect the June 17, 2026 snapshot.
"Largest active listing wave": largest count of active for-sale listings among institutional SFR operators tracked by Parcl Labs as of June 17, 2026.
Active-listing universe: Motivated Seller Index, 13 metros, 85,548 listings from all sellers, June 17, 2026. The 13 are the metros where VineBrook's selling concentrates. All market-comparison figures (shelf shares, price bands, ZIP shares, MSI behavior, market medians) use this universe; all VineBrook-only figures use the full portfolio.
MSI: 0 to 10 on days on market, cut frequency, cut magnitude, cut velocity; fire sale = 7.5 to 10.
Segment and ZIP shares: share of active single-family listings; ZIP figures restricted to ZIPs with 30+ active listings, counts shown inline.


Follow Us for More