From Quit to Cut: Summer 2025 Sellers Change Strategy
Sep 19, 2025 · 8 min read
What happened to 3 million summer listings? New data shows a market in transition with sellers adapting and regional divides emerging.

It's consensus: home sellers outnumber buyers nationally right now.
The real question is what do sellers do in a challenging market? Give up? Cut prices to find buyers? Pivot to rentals? Until now, that was guesswork.
gives you answers. We track every property through its complete lifecycle - from initial listing through price changes, sales, and rental conversions - then aggregate the data so you can see what's happening at the market level.
This analysis compares the fate of on-market listings from Summer 2025 versus Summer 2024:
National trends showing how seller behavior shifted year-over-year
Regional patterns breaking down where sellers are under the most pressure vs. still have power
Accidental landlord update tracing failed sellers who became reluctant rental landlords
The data tells a clear story: seller behavior flipped from "give up" in 2024 to "find the market" in 2025. Here's how that played out nationally, then regionally.
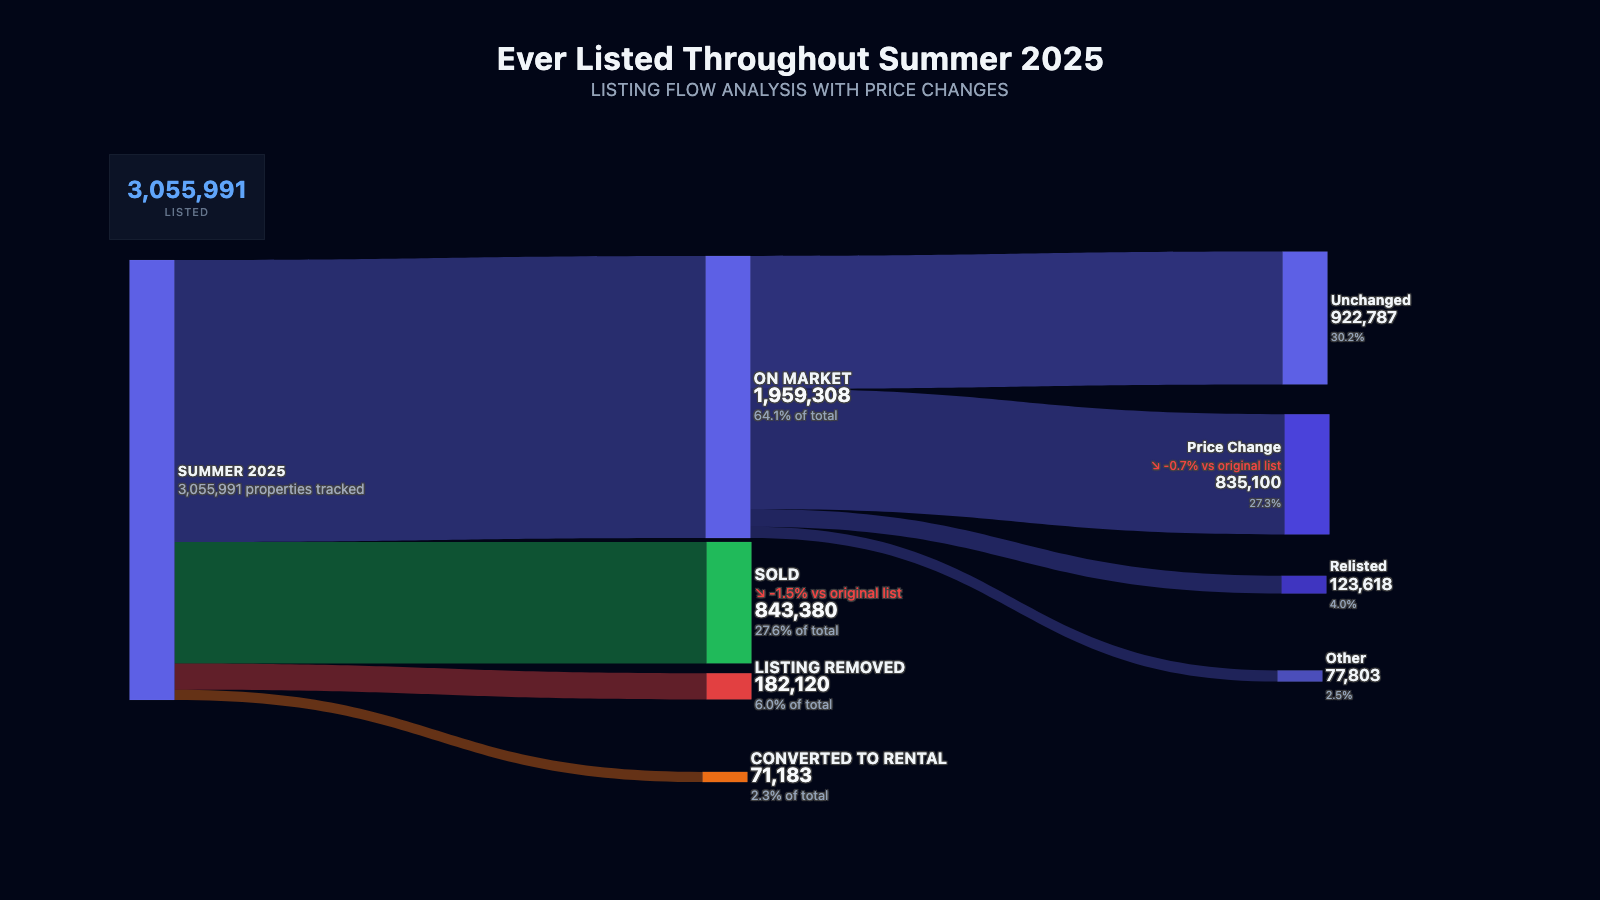
Summer 2025 Listing Flow:
National Trends: Sellers Change Strategy to Meet The Market
Nationally, more homes hit the market this summer. Listings jumped to 3.06 million in Summer 2025 from 2.91 million in 2024 - a 4.9% increase.
With greater choice, homebuyers won bigger discounts. The list-vs-sale price gap widened to -1.5% this Summer from -0.8% last year.
But most listings didn't sell. Two-thirds (64.1%) of Summer 2025 listings remain on the market compared to 56.5% last year. That leaves 1.96 million homes still seeking buyers heading into fall - 312,000 more than 2024.
Sellers changed their behavior this year. Last Summer, frustrated sellers pulled listings when they couldn't get their price. This dynamic shifted in 2025. Pulled listings dropped to 6.0% from 12.6% - a 52% decline year-over-year.
Instead, sellers stayed listed and cut prices. Price-cut activity surged to 27.3% of all listings from 18.9% - an 8.4 percentage point jump representing 44% more cutting activity. The average price cut deepened to -0.7% this year from flat last year.
Figure 1: Summer 2025 Listing Flow
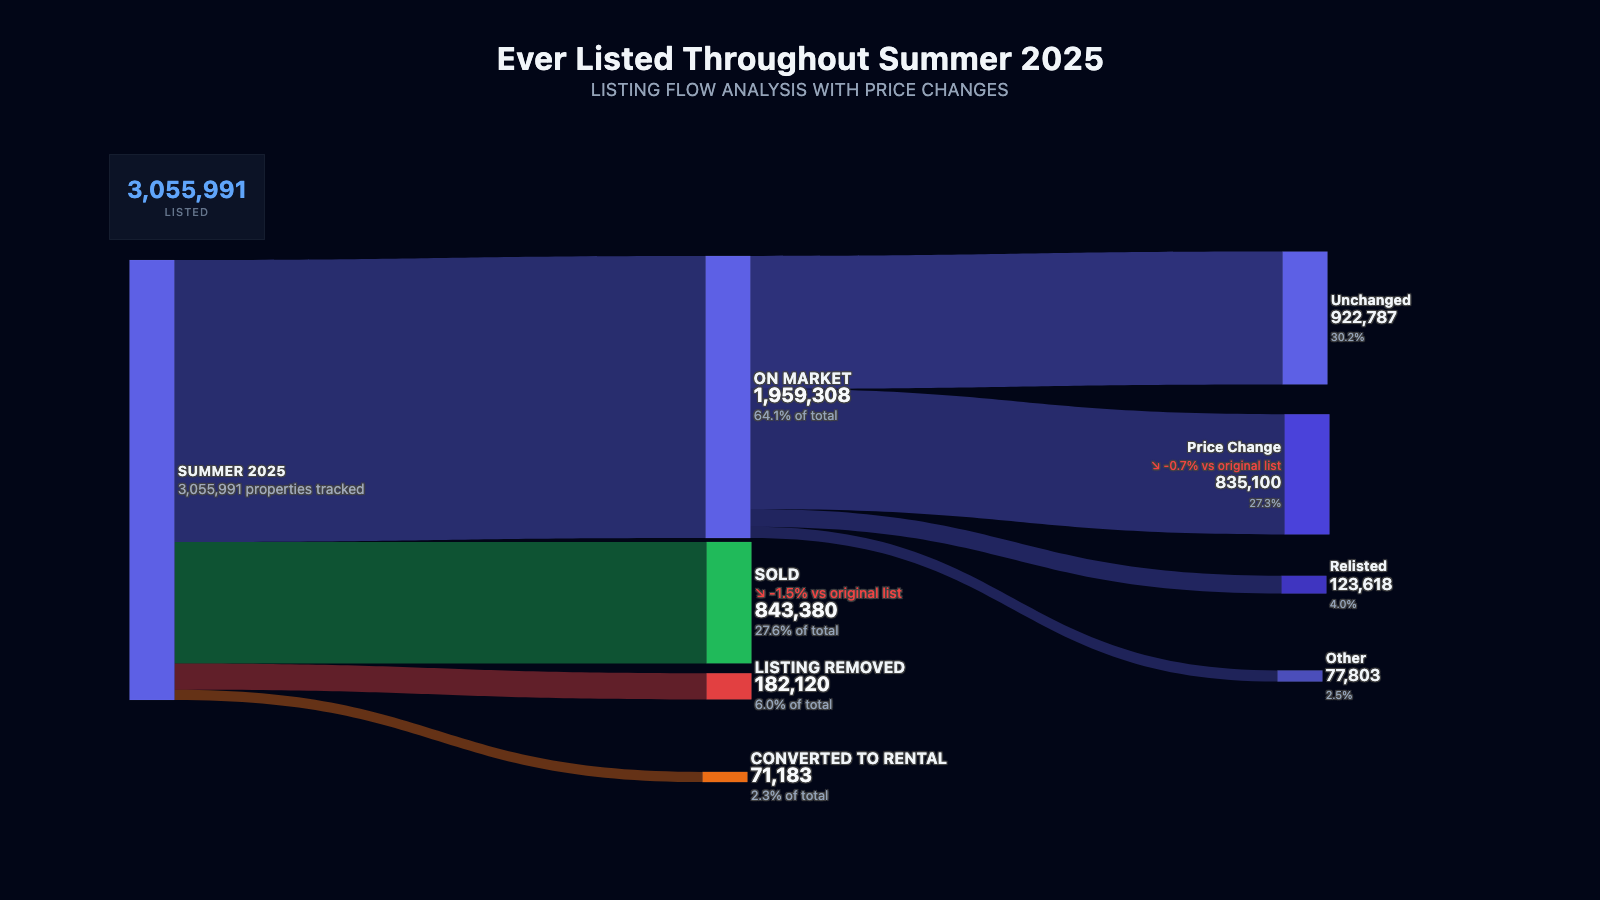
Figure 2: Summer 2024 Listing Flow
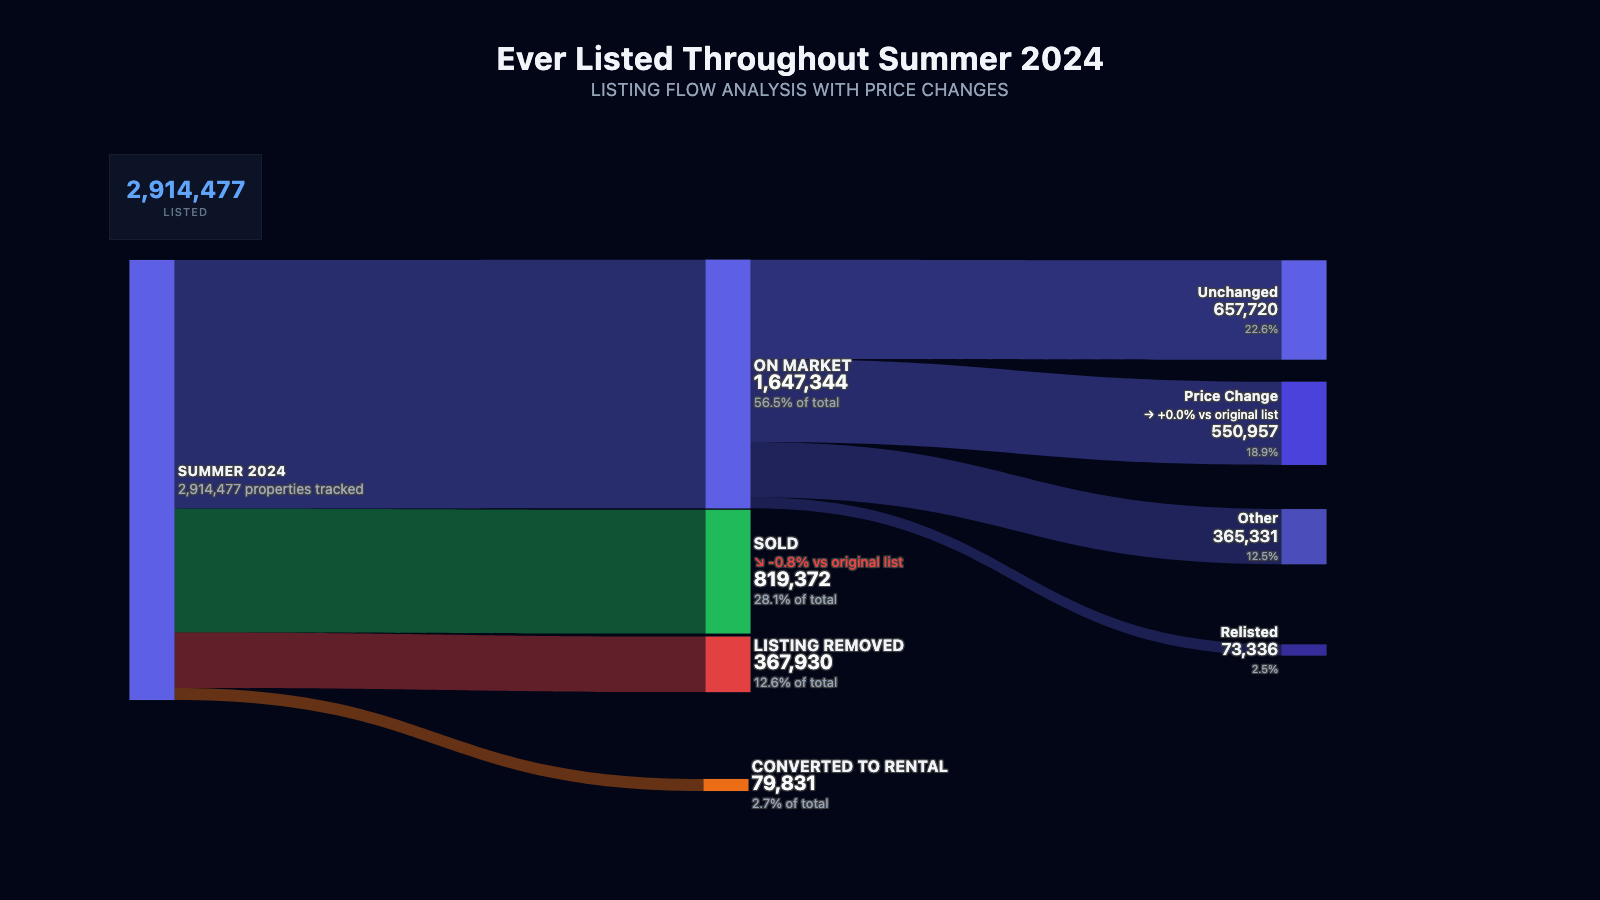
The national pattern is clear. Last Summer, sellers walked away when they couldn't get their price. This year, with inventory building and no clear timeline for improved market conditions, sellers abandoned the waiting strategy and are showing motivation to move properties - staying listed and cutting more aggressively.
The national trend masks large regional variation in seller behavior and listing outcomes.
Regional Divide Holds for Summer Listing Outcomes
Throughout 2025, Parcl Labs research has repeatedly shown strength in Northeast and Midwest markets while real pressure builds across the South and Sunbelt. This same regional bifurcation holds true for Summer 2025 listing outcomes.
Northern markets from the Midwest to Northeast show listings clearing efficiently.
Sunbelt markets tell the opposite story: particularly in Florida and Texas, summer listings piled up and sellers showed more willingness to cut prices to move properties.
Listing flows from the top 100 US metros by population confirm the divide.
Northeast and Midwest Markets: Summer Sellers Hold the Cards
Summer 2025 listing outcomes in Chicago, Columbus, Cincinnati, Milwaukee, Hartford, Grand Rapids, and Rochester exemplify the Northeast/Midwest advantage. For Summer 2025, they show the highest sell-through rates and lowest price-cutting activity among major U.S. housing markets.
Metro Market | Sold % | Still listed % | Price‑cut % |
|---|---|---|---|
42.2% | 50.1% | 15.7% | |
39.9% | 53.3% | 23.0% | |
37.8% | 53.2% | 19.8% | |
41.4% | 54.1% | 15.4% | |
43.7% | 51.7% | 11.0% | |
43.5% | 53.1% | 17.0% | |
42.5% | 52.9% | 10.8% | |
Weighted (cohort) | 41.4% | 51.7% | 16.7% |
National (’25) | 27.6% | 64.1% | 27.3% |
Hartford leads all top 100 metros with a 43.7% sell rate, while Rochester posts the lowest price-cut percentage at just 10.8%.
Figure 3: Rochester Summer 2025 Listing Flow
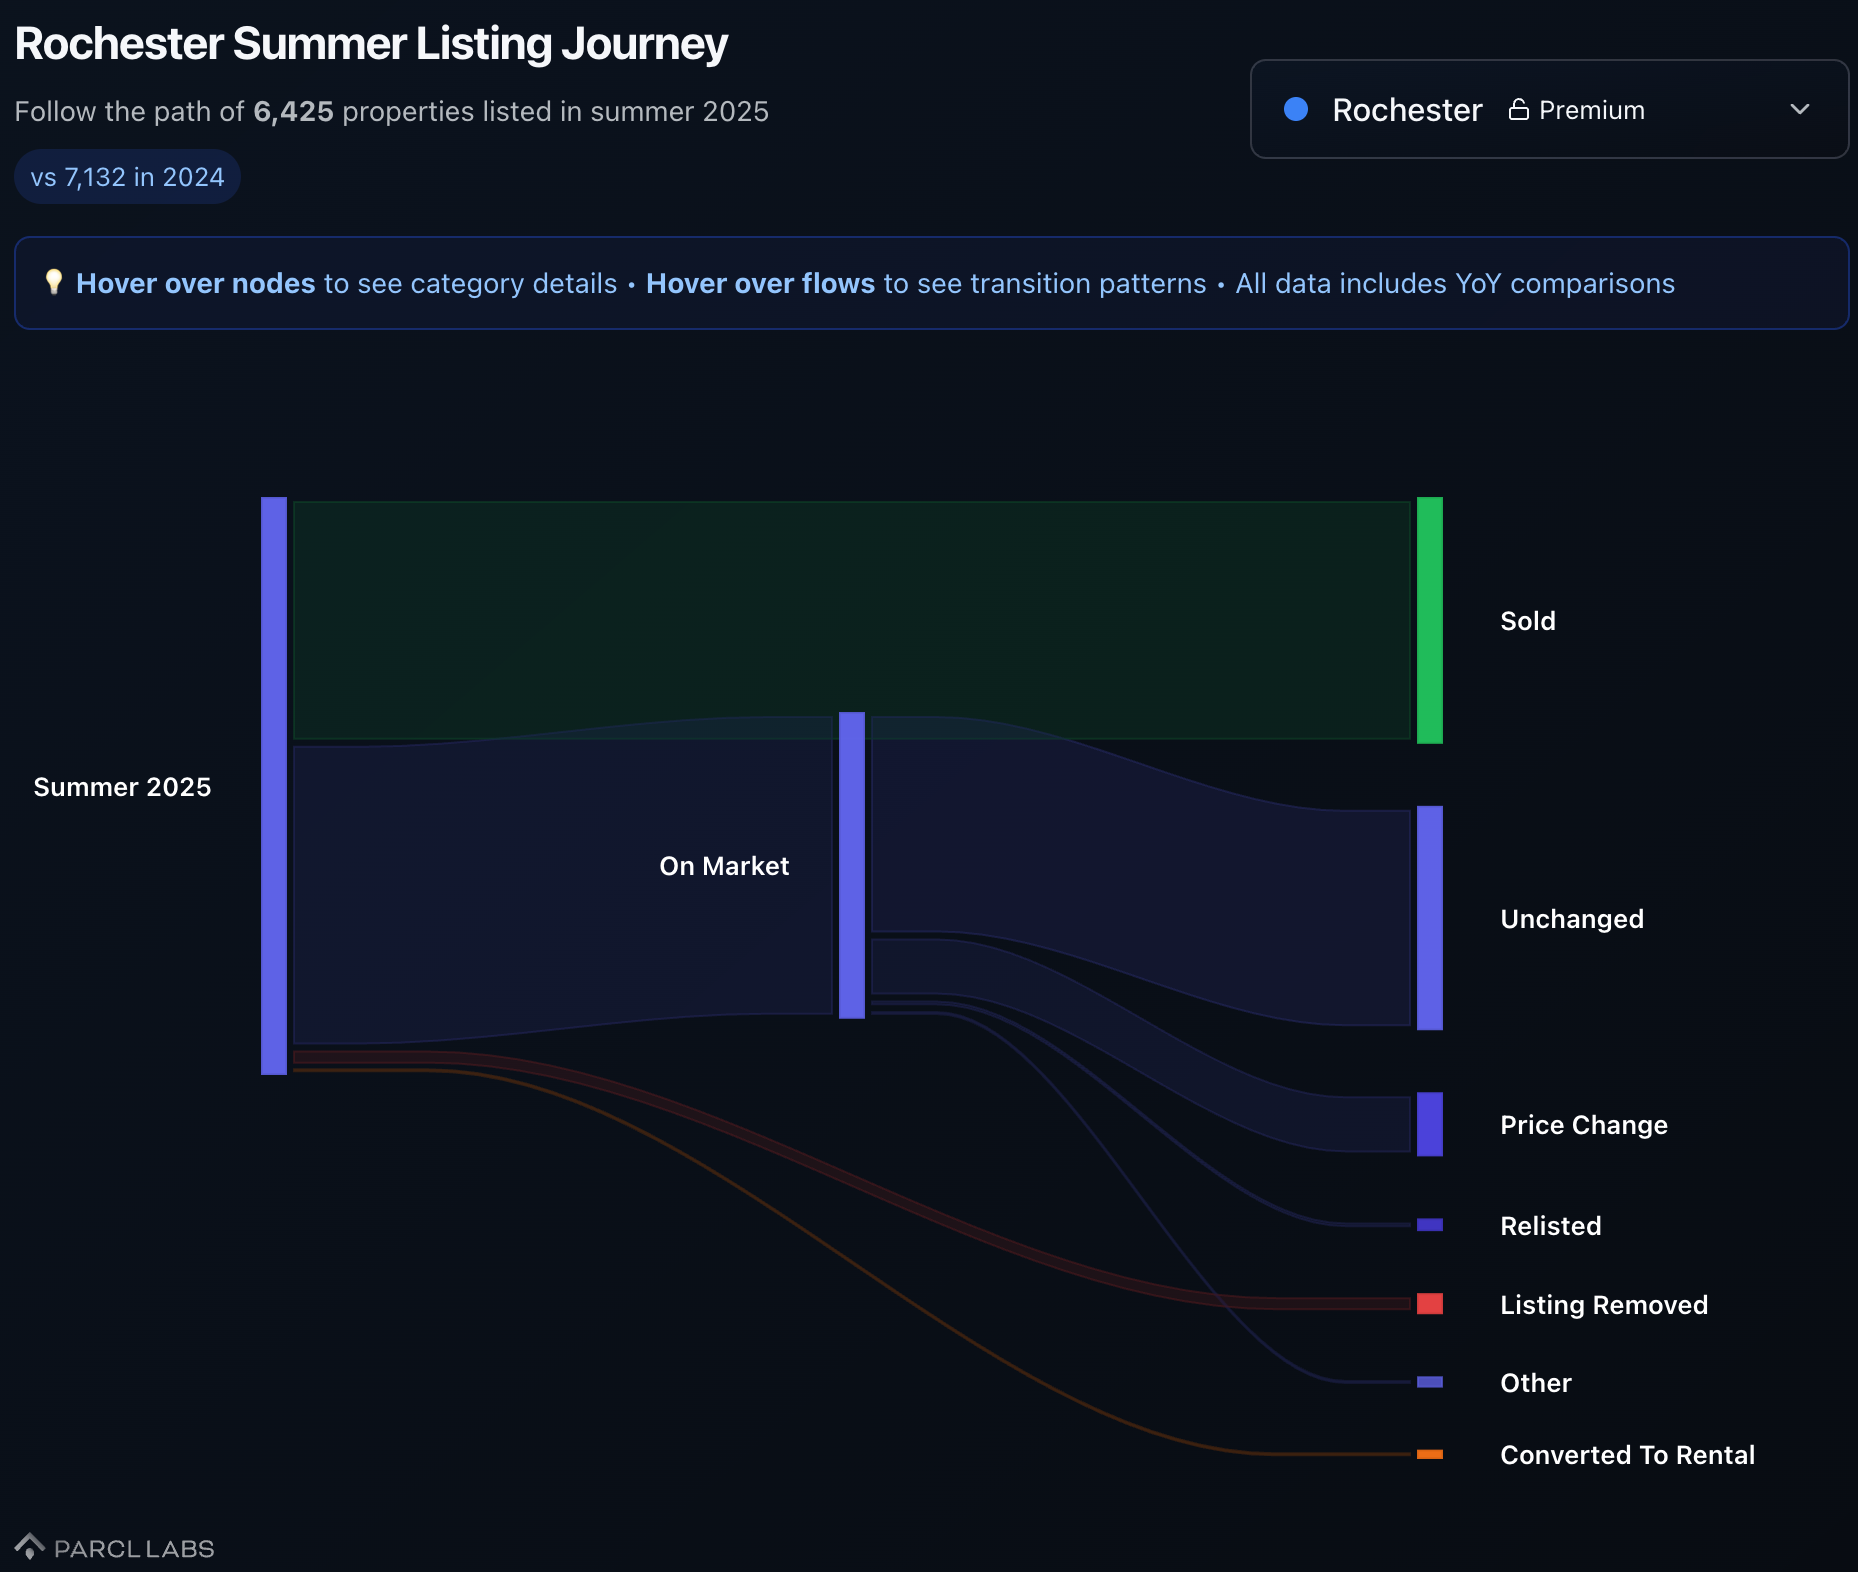
These standout performers highlight another pattern - secondary and tertiary Northeast markets are outperforming both national averages and many larger major markets.
Sunbelt Markets: Listings Build as Sellers Search for Price
Florida and Texas markets have been bellwethers for pandemic boom metros now facing reality as supply grows and demand weakens.
Summer 2025 listing outcomes in Miami, Tampa, Orlando, Jacksonville, Dallas, Houston, Austin, and San Antonio tell the story. These major Florida and Texas metros - scale markets investors watch closely - show some of the lowest sell-through rates and highest price-cutting activity in the country.
Metro Market | Sold % | Still listed % | Price‑cut % |
|---|---|---|---|
17.4% | 71.0% | 32.3% | |
23.7% | 68.2% | 36.8% | |
24.4% | 67.1% | 34.9% | |
23.2% | 67.2% | 37.5% | |
23.0% | 63.9% | 34.3% | |
22.2% | 67.3% | 32.6% | |
19.4% | 71.4% | 41.0% | |
20.1% | 72.0% | 40.9% | |
Weighted (cohort) | 21.4% | 68.2% | 35.0% |
National | 27.6% | 64.1% | 27.3% |
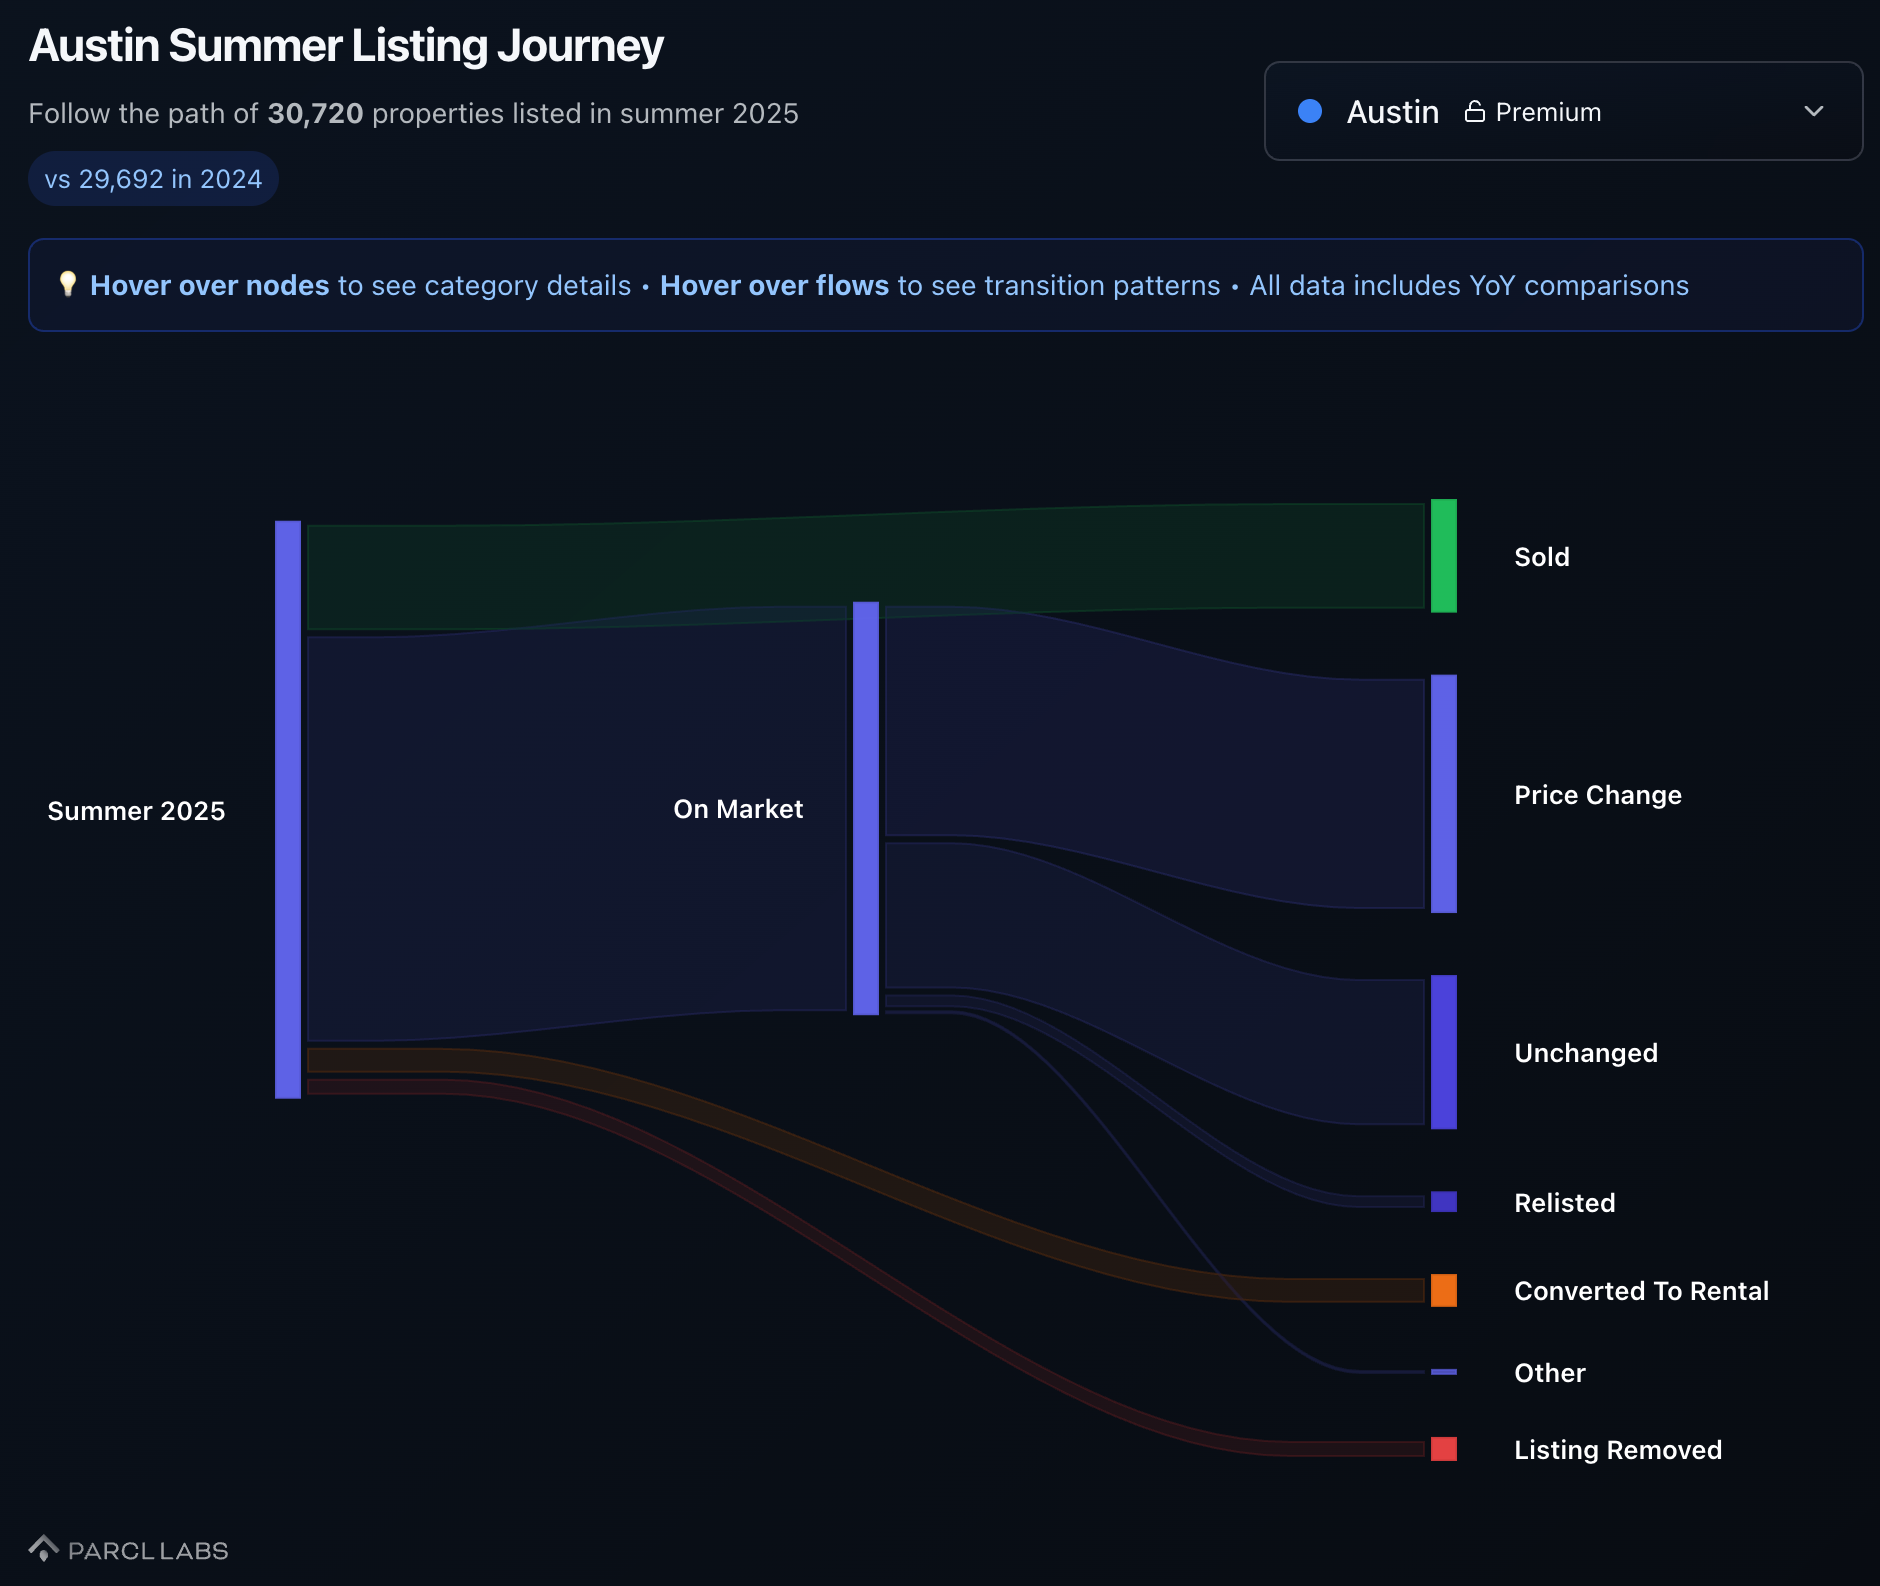
Unsurprisingly, Austin leads the struggle with over 70% of Summer 2025 listings still on the market and a 41% price-cut rate. Miami shows the weakest sell-through among this cohort at just 17.4%.
Figure 4: Austin Summer 2025 Listing Flow
While these Florida and Texas markets rightfully capture headlines for their weakness, other metros face even worse absorption. The top 5 markets with the highest percentage of Summer 2025 properties still listed are all located along the Gulf coast, with one Mountain West outlier.
Metro Market | Still listed % | Sold % | Price‑cut % |
|---|---|---|---|
81.7% | 14.0% | 42.4% | |
78.3% | 14.3% | 32.2% | |
77.5% | 15.3% | 29.4% | |
73.8% | 17.7% | 38.8% | |
73.2% | 24.2% | 36.8% |
These less-discussed markets highlight the importance of national coverage for understanding the biggest pressure points in U.S. housing. Parcl Labs will be closely watching how the situation in places like Louisiana evolves into fall.
Accidental Landlords: Some Failed Summer Sellers Pivot to Rentals
With a growing backlog of summer listings heading into fall 2025, what happens when sellers can't sell? As Parcl Labs uniquely tracks, at least some pivot to the rental market. Our analysis of sale-to-rent conversions - featured by CNBC for bringing this phenomenon to light - is now available nationally and by market through our new Listing Flow capability.
Nationally, rental conversion rates eased year-over-year. 2.3% of Summer 2025 listings converted to rentals versus 2.7% in 2024.
Accidental landlord activity concentrates in key markets. Austin leads at 5.3% of summer listings converting to rentals, followed by Miami and Houston at 5.1% each. Dallas and Las Vegas both hit 4.0%.
Institutional markets continue to show elevated rental conversion rates. Across Atlanta, Phoenix, Dallas, Houston, Tampa, and Charlotte - markets where large single-family rental portfolios cluster - the weighted sale-to-rent conversion rate reaches 3.63% versus 2.3% nationally. That's 58% higher than the national average.
Why this matters: As we highlighted in our previous accidental landlord research, new rental supply is landing exactly where institutional investors concentrate their holdings, creating near-term pressure on their rents and renewals. like Invitation Homes, Amherst, and Blackstone must now compete with reluctant landlords who may price units simply to cover costs while waiting for the for-sale market to improve.
Get Your Market's Listing Flow Data
The Summer 2025 listing outcomes suggest a changing market dynamic. With more inventory on the market, sellers are adapting to increasingly buyer-favorable conditions. But the story is locally specific. Understanding the dynamics in your market is critical.
Track it yourself. Open our Listing Flow tool, select your markets, and see exactly what happened to summer listings - sold, still on market, price-cut, or sale-to-rent conversions. Get the intelligence you need to price, negotiate, and allocate with an information edge this fall.
Methodology
Data foundation. Parcl Labs integrates listing, rental, and sales sources into unit‑level histories. This lets us follow the same home across list → price changes/relist → sale → rental without double‑counting duplicate listings.
Cohorts (“Summer 2024” and “Summer 2025”).
For each year, we include every home that was listed for sale at any point from June 20 through September 22 (inclusive). That set is the summer cohort and is the denominator for all shares shown.
Flow classification (mutually exclusive, assigned once per property):
Sold - a recorded sale after its summer list event.
Converted to rental - the same owner lists the home for rent after the summer list event (see conversion logic below); no sale recorded in the window.
Listing removed - the for‑sale listing is removed and the home is not sold, not converted to rental, and not active at the end of the summer window.
Still on market - the for‑sale listing is active at the end of the summer window.
Unchanged - no price‑change or relist events after initial list.
Price changed -≥1 price‑change event after initial list.
Relisted -≥1 relist event after initial list.
Other - statuses like pending/option/contingent that are neither sold nor active at cutoff.
Aggregation & weighting.
Market results are computed per MSA (top‑100 by population): counts and shares of the summer cohort in that market.
Cohort “Weighted” rows are volume‑weighted by listings: ∑flow count/∑cohort size
Cutoff timing.
Outcomes are measured as of the end of each summer window (September 22 of that year). “Still on market” means active at that cutoff.
Reproducibility.
All underlying data is available via the Parcl Labs API at the unit level (property histories).
Continue Reading
Subscribe to access the full article and unlock exclusive insights.

Follow Us for More