Regional Divide as New Construction Cracks: August Motivated Seller Update
Aug 22, 2025 · 7 min read
South shows elevated seller motivation vs Northeast as new construction stress pushes builders toward price cuts
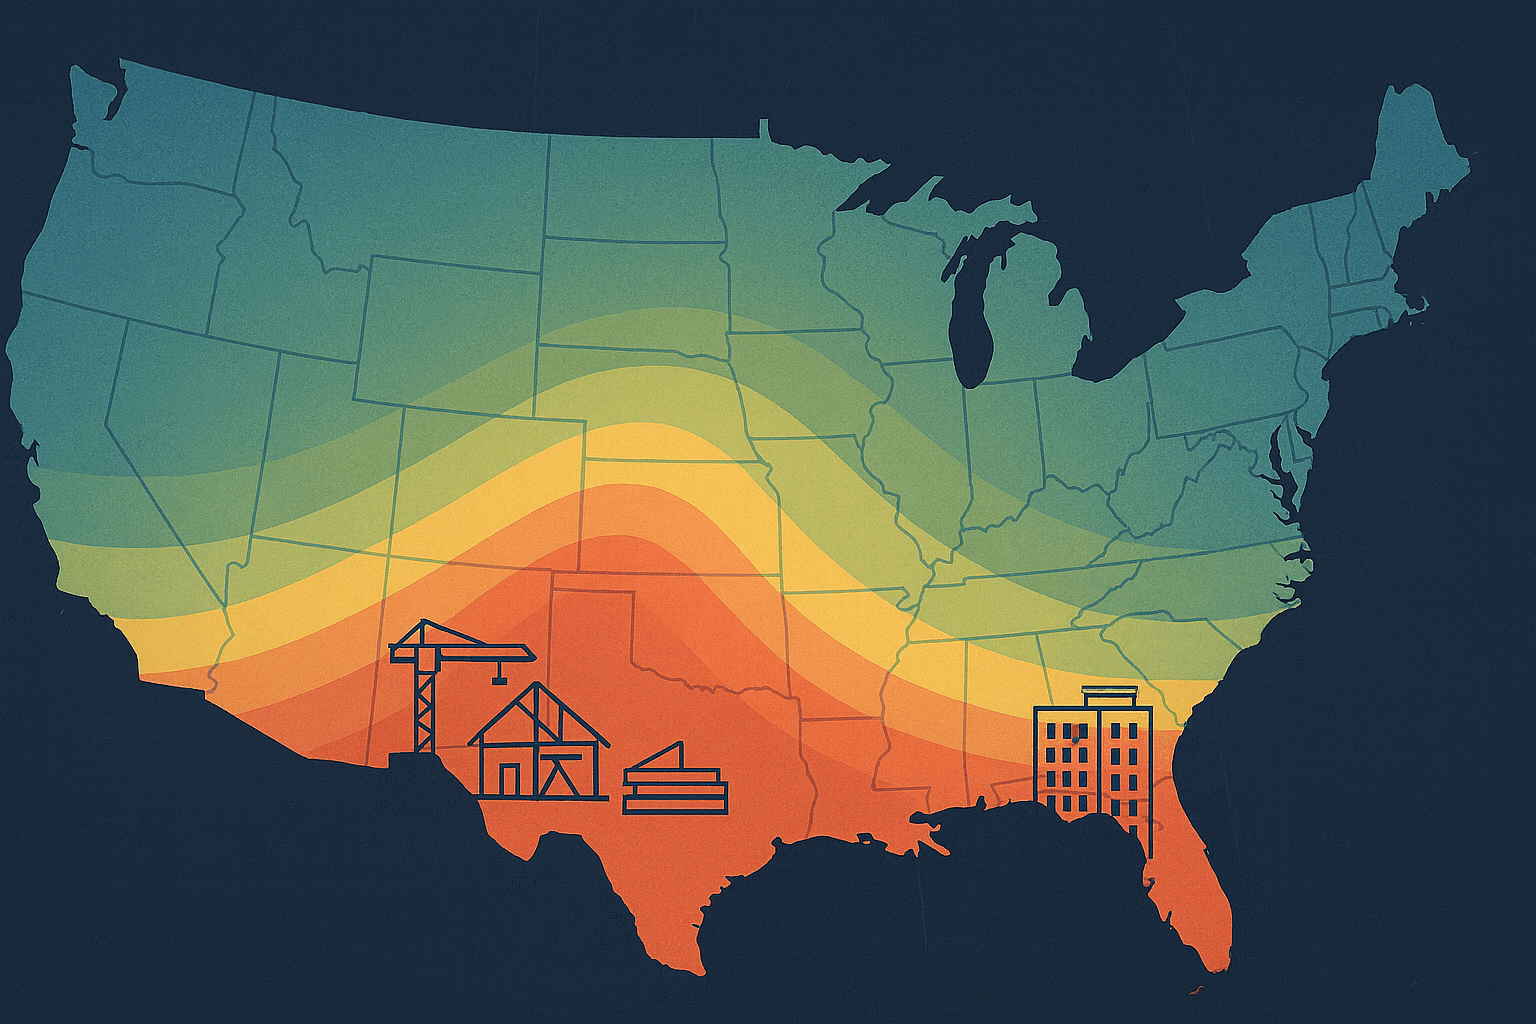
The Southern region shows 20-30% higher seller motivation than the Northeast: Regional bifurcation continues to define the housing market.
Sun Belt metros remain under pressure: Tampa leads the top 50 metros in seller motivation at 4.92 MSI, with active listings averaging 74 days on market and -4.0% price cuts. Austin, Jacksonville, and Phoenix follow, the same markets we've flagged as bearish for over a year. No floor in sight.
Seller pressure concentrates in two property segments:
New construction single-family posts the highest segment-specific MSI at 2.51 with 72 DOM. Builders' incentive strategies are hitting their limit, forcing the price-cut cycle they worked to avoid. Texas and Florida lead the new-build stress.
Aging condos lead condo category seller motivation at 2.28 MSI. Florida shows the strongest condo weakness, with post-Surfside compliance costs and insurance volatility creating persistent selling pressure in older stock.
Act on it: MSI updates daily for every U.S. market and individual listings in the Parcl Labs app. Use market- and listing-level scores to find deals and negotiate.
Introduction
This summer Parcl Labs launched the Motivated Seller Index (MSI): a real-time, 0-10 metric scoring seller urgency based on days on market, price-cut frequency, cut velocity, and reduction size.
Our June research found Florida dominated seller urgency, with 14 of the top 20 most motivated markets in the Sunshine State.
This analysis expands on our June work by examining regional trends, market rankings, and property segment-level motivation. The story has evolved. Florida no longer stands alone.
The South is 20-30% More Motivated Than the Northeast
Regional bifurcation is here. As of late August 2025, home sellers across the South show meaningfully higher urgency than their Northeast counterparts.
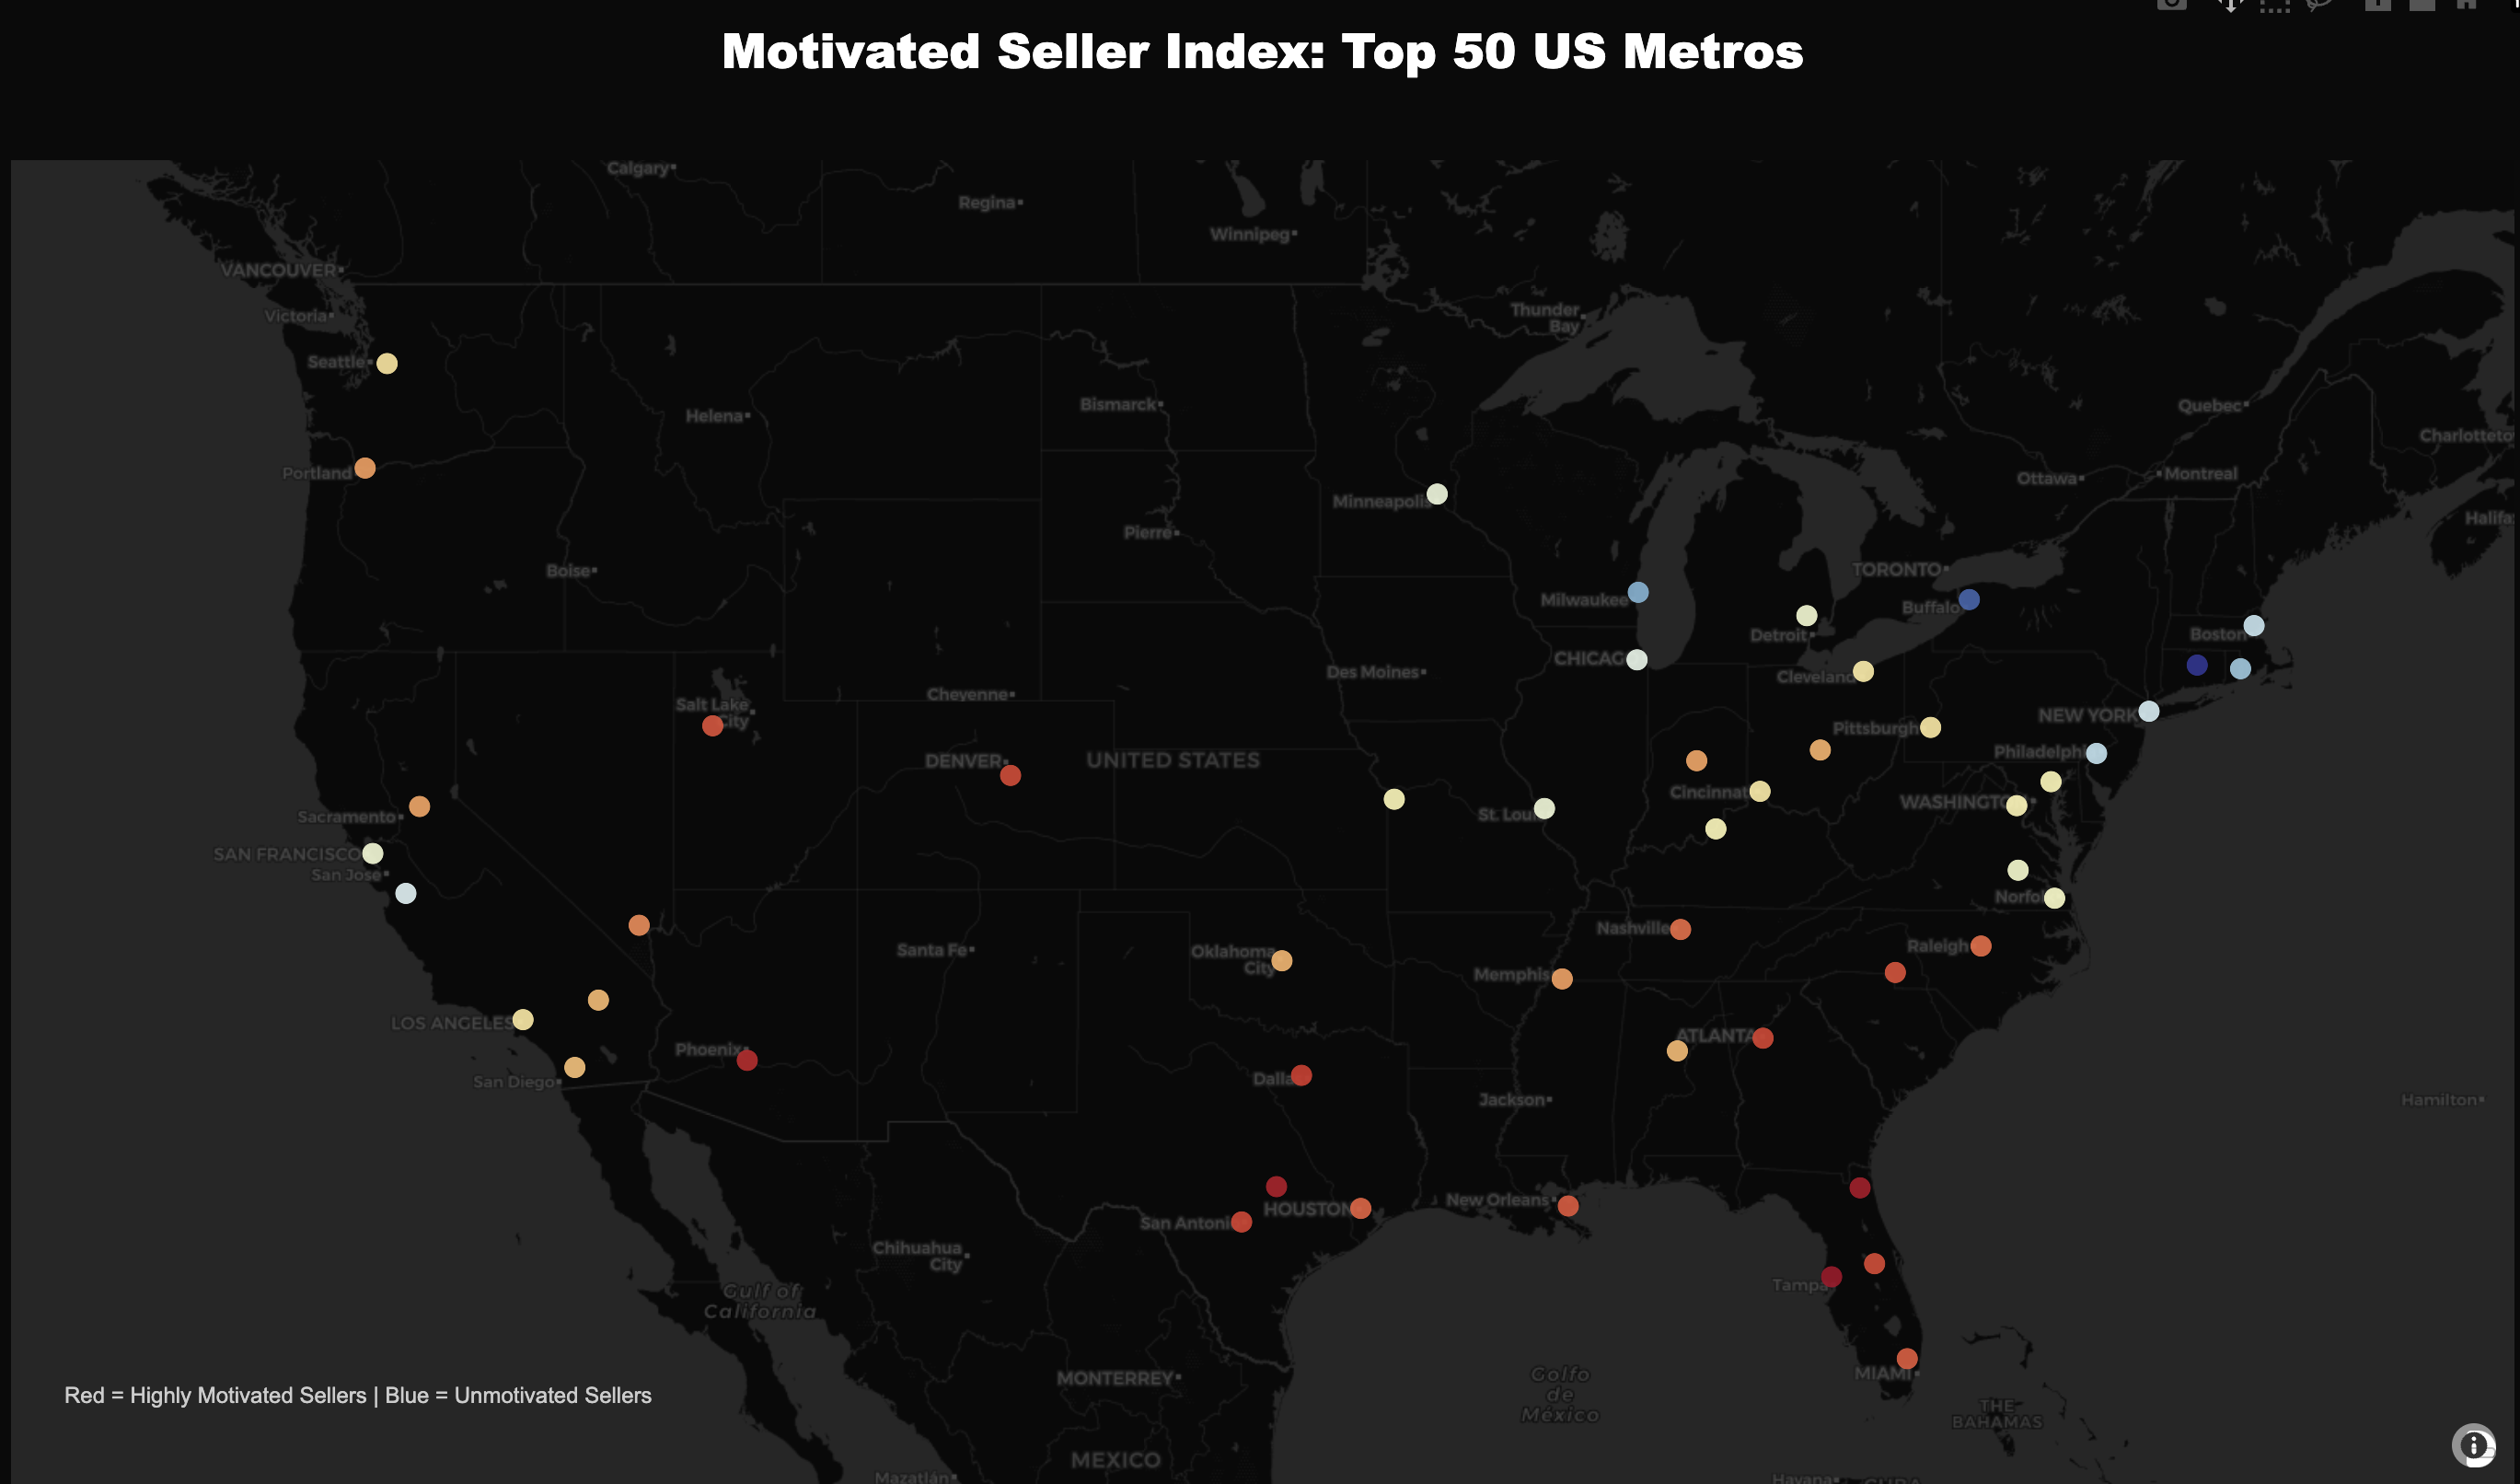
The South Atlantic leads regional motivation rankings. MSI hits 4.17, 27% above New England's 3.28. The rest of the South follows close behind, with East and West South Central both posting MSI above 4.0.
The West South Central region (Texas, Oklahoma, Arkansas, Louisiana) shows the longest marketing times at 69 days and deepest price cuts at -3.0%, a new pressure point since our June analysis.
The West runs close behind Southern urgency. Pacific and Mountain regions both register MSI above 3.9, running 20%+ above Northeast levels.
Sellers still have leverage in the Northeast. New England anchors the bottom at 3.28 MSI, where listings clear in 54 days with minimal concessions. Middle Atlantic follows at 3.39.
Region | States | MSI | MSI Spread vs New England | DOM | List-price reduction |
|---|---|---|---|---|---|
South Atlantic | DC, DE, FL, GA, MD, NC, SC, VA, WV | 4.17 | +27.2% | 67 | -2.9% |
East South Central | AL, KY, MS, TN | 4.11 | +25.2% | 66 | -3.0% |
West South Central | AR, LA, OK, TX | 4.04 | +23.2% | 69 | -3.0% |
Pacific | AK, CA, HI, OR, WA | 3.97 | +21.1% | 64 | -2.7% |
Mountain | AZ, CO, ID, MT, NM, NV, UT, WY | 3.93 | +19.8% | 66 | -2.6% |
East North Central | IL, IN, MI, OH, WI | 3.60 | +9.7% | 54 | -2.8% |
West North Central | IA, KS, MN, MO, NE, ND, SD | 3.51 | +7.1% | 58 | -2.5% |
Middle Atlantic | NJ, NY, PA | 3.39 | +3.5% | 58 | -2.7% |
New England | CT, MA, ME, NH, RI, VT | 3.28 | +0.0% | 54 | -2.4% |
This regional spread captures the broad story of US inventory and seller activity right now: Southern and Western markets favor buyers through extended marketing times and deeper price cuts, while Northeastern and Midwestern sellers maintain pricing power through faster absorption.
Persistent Pressure in Sun Belt; Northeast Secondary Markets Maintain Seller’s Edge
At the metro level, the same Sun Belt markets we've flagged repeatedly as bearish continue to struggle. Tampa leads the top 50 metros in seller motivation at 4.92 MSI with 74 DOM and -4.0% cuts. Jacksonville follows at 4.87 MSI. Austin (4.83) and Phoenix (4.77) round out the most motivated large metros.
Northeast secondary markets maintain their bullish strength. Hartford is the least motivated market at 2.29 MSI with just 45 DOM and -1.0% cuts. Providence, Milwaukee, and Buffalo follow, all clearing faster with minimal concessions.
MSI Cohort | Metro | MSI | DOM | List-price reduction |
|---|---|---|---|---|
Most | Tampa-St. Petersburg-Clearwater, FL | 4.92 | 74 | −4.0% |
Most | Jacksonville, FL | 4.87 | 74 | −3.0% |
Most | Austin-Round Rock-Georgetown, TX | 4.83 | 74 | −4.0% |
Most | Phoenix-Mesa-Chandler, AZ | 4.77 | 71 | −3.0% |
Least | Hartford-East Hartford-Middletown, CT | 2.29 | 45 | −1.0% |
Least | Buffalo-Cheektowaga, NY | 2.49 | 53 | −2.0% |
Least | Milwaukee-Waukesha, WI | 2.86 | 43 | −2.0% |
Least | Providence-Warwick, RI-MA | 2.99 | 53 | −2.0% |
These inventory trends matter for price performance. We've observed markets showing high seller motivation translate that pressure into home price declines, while markets with seller leverage (low MSI) see price gains. Given the current state of MSI, we expect these Sun Belt metros to remain in price discovery and the Northeast to continue to outperform.
Seller Pressure Concentrates in New Construction Single-Family and Aging Condos
The regional map tells us where seller motivation concentrates. Property segments help tell us why. For this research, we took our MSI analysis deeper than ever before, cutting by property type and vintage to isolate the drivers of seller urgency.
Two weak links emerge across markets: new-construction single-family and older vintage condos.
New Construction Single-Family: Builders Blink
MSI results quantify a top housing market story right now: builders are under stress. New construction carries the highest seller motivation among all single-family segments. Across 28 top‑50 metros with over 5,000 single-family listings, homes built 2020-2025 register MSI 2.51 with 72 DOM.
Vintage | MSI | DOM | List-price reduction |
|---|---|---|---|
2020-2025 | 2.51 | 72 | −2.6% |
2000-2019 | 2.28 | 63 | −2.6% |
pre-2000 | 2.18 | 60 | −2.8% |
Texas and Florida are at the epicenter of new-home stress. Austin leads new-construction motivation at 3.09 MSI with 81 DOM and -3.5% cuts. San Antonio and Tampa follow close behind, both hitting 3.06 MSI. Dallas and Jacksonville round out the top five, all showing 76+ DOM and cuts exceeding -2.9%.
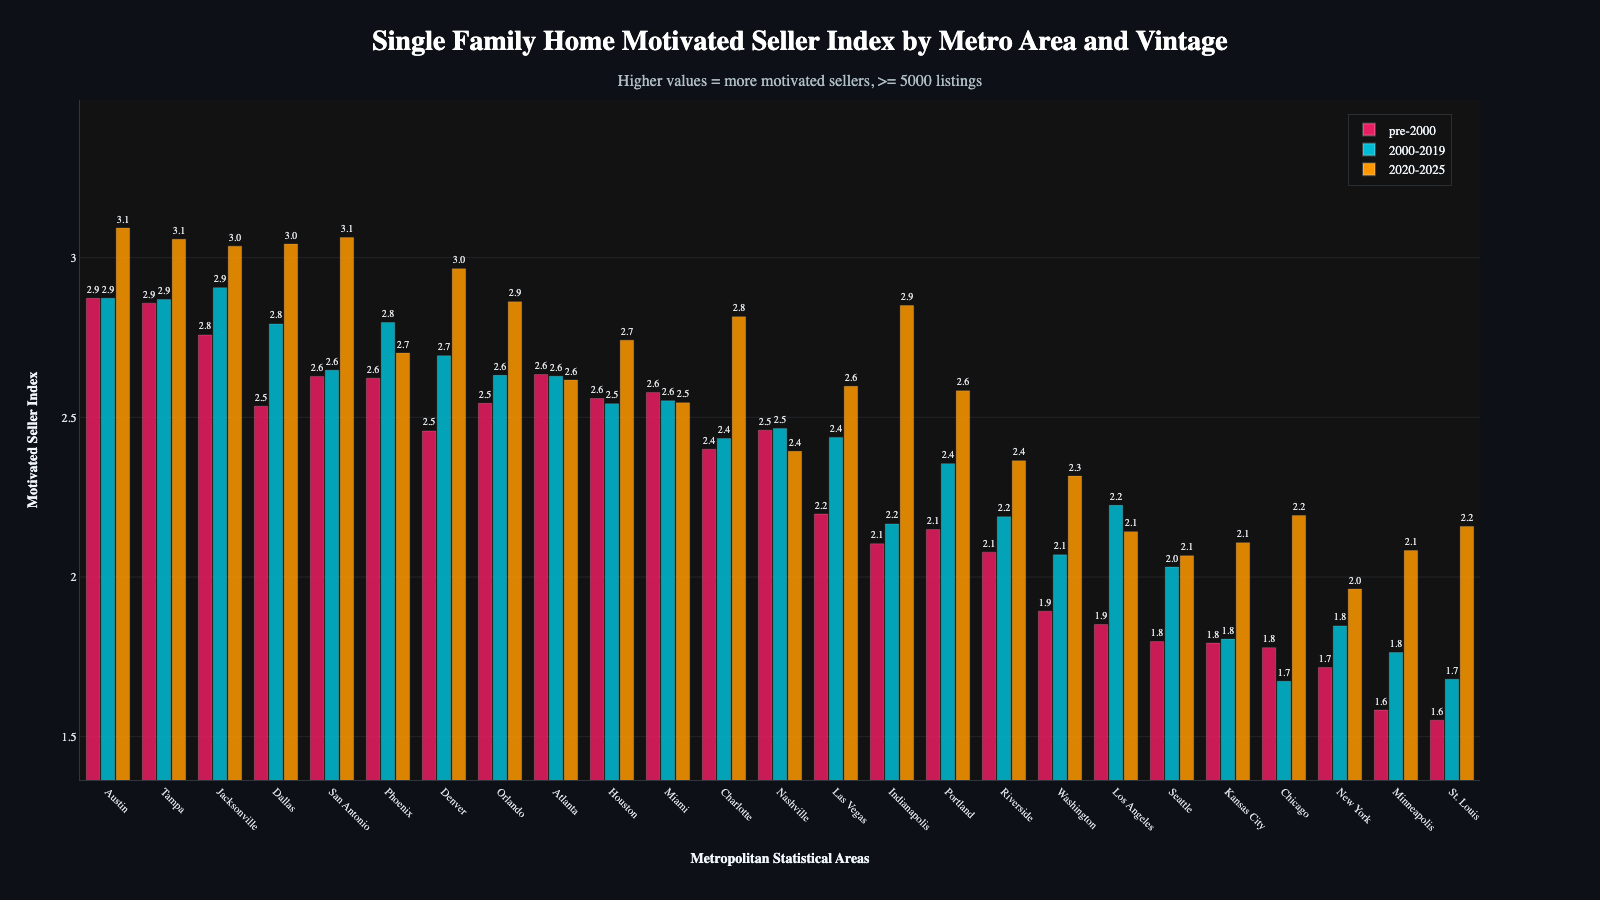
This finding continues our earlier call on Austin's distressed new-construction market. Over a year later, the supply overhang still hasn't cleared. Builders there still face the longest marketing times and deeper concessions.
More broadly, new construction MSI shows a shift in negotiating power. Previously, builders could move homes by offering buydown incentives and concessions. New construction MSI shows that strategy is hitting its limit. New homes are sitting longer despite concessions, forcing builders into the price-cut cycle they worked to avoid.
This new construction strain can create upside for opportunistic single-family players. For example, large institutional like Invitation Homes are capitalizing on elevated seller motivation to secure new-build discounts in distressed markets.
Older Condos: Florida’s Condo Stock Remains Under Pressure
Pre-2000 vintage posts the highest seller motivation in the condo category across 17 top‑50 metros with 1,000+ condo listings, although the spread is not as wide as new construction single-family.
Vintage | MSI | DOM | List-price reduction |
|---|---|---|---|
pre-2000 | 2.28 | 68 | −2.8% |
2000-2019 | 2.13 | 68 | −2.3% |
2020-2025 | 2.13 | 69 | −2.2% |
Major Florida markets are hotspots for old condo distress, with spillover to Western markets. Tampa leads pre-2000 condo motivation at 2.88 MSI with 82 DOM and -4.18% cuts. Miami (2.64) and Orlando (2.66) follow close behind.
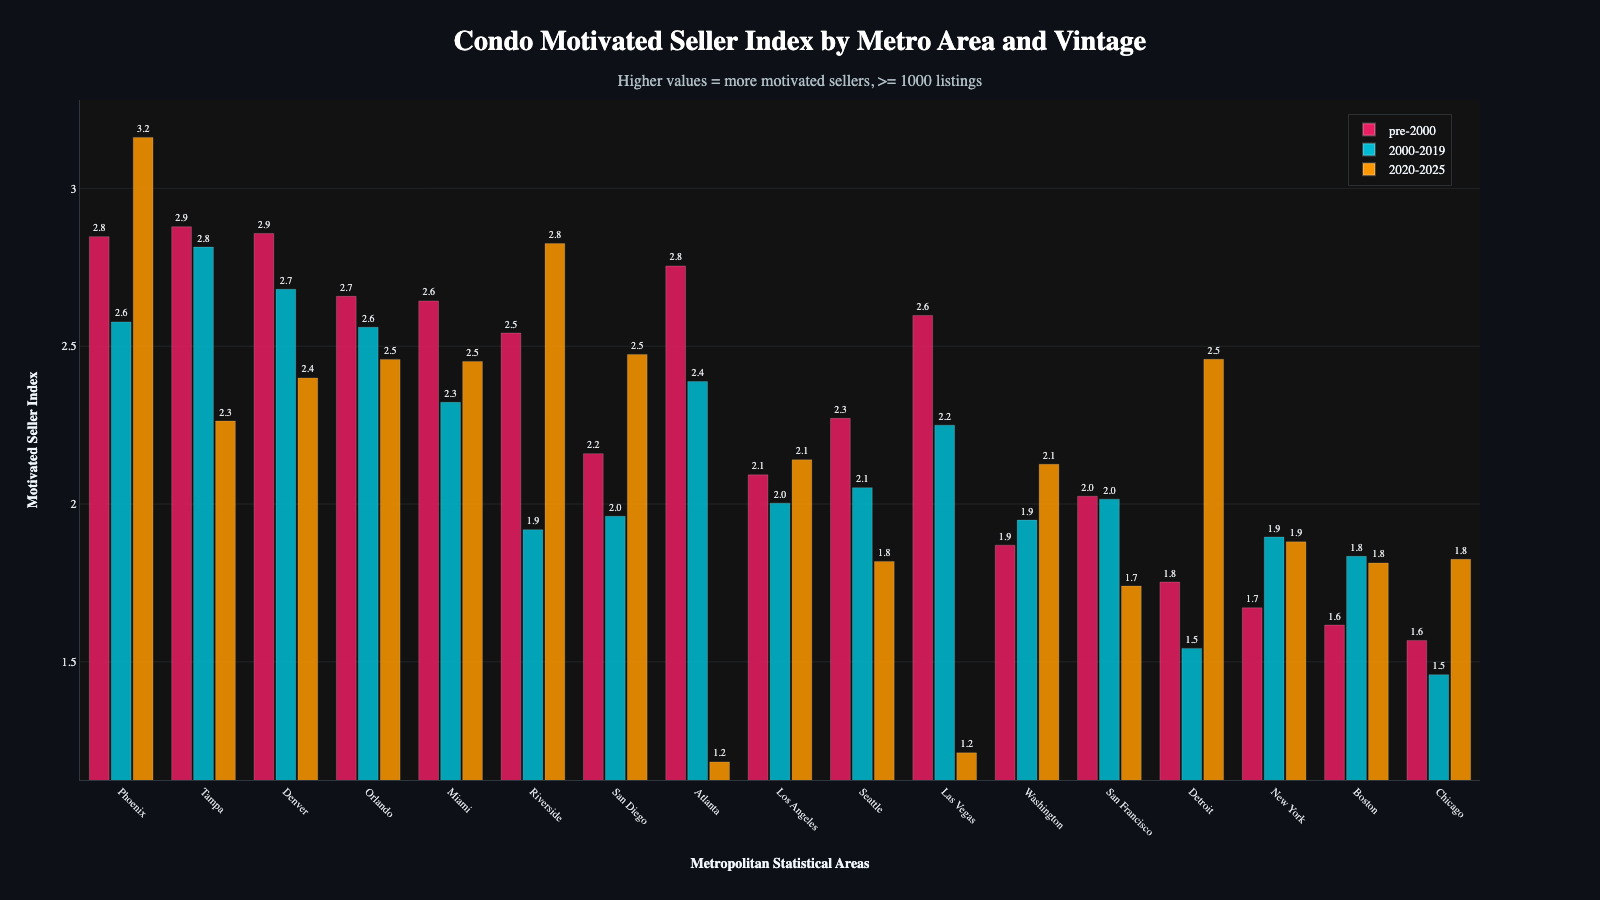
This MSI finding continues the condo weakness we highlighted in prior Florida research. Florida's regulatory shift explains much of the ongoing pressure. Post-Surfside legislation mandated costly inspections and reserves for older condos. Insurance costs remain volatile. The combination has hit both supply and demand, with existing owners trying to exit and fewer buyers willing to enter.
Today's data confirms older condo stock remains a key factor in broader Florida market softness.
Implications and Seller Motivation Data for Your Market
This research confirms a continuation of trends we've tracked for over a year. Regional bifurcation continues to define the housing market: stress concentrates in the Sun Belt, strength holds in the Northeast and Midwest. Within markets, new construction single-family and older condos show the most seller urgency.
Parcl Labs spotted these trends first. What's notable now is the persistence. We continue watching for signs of a floor in markets like Austin and Tampa, but this data suggests housing pressure will likely continue.
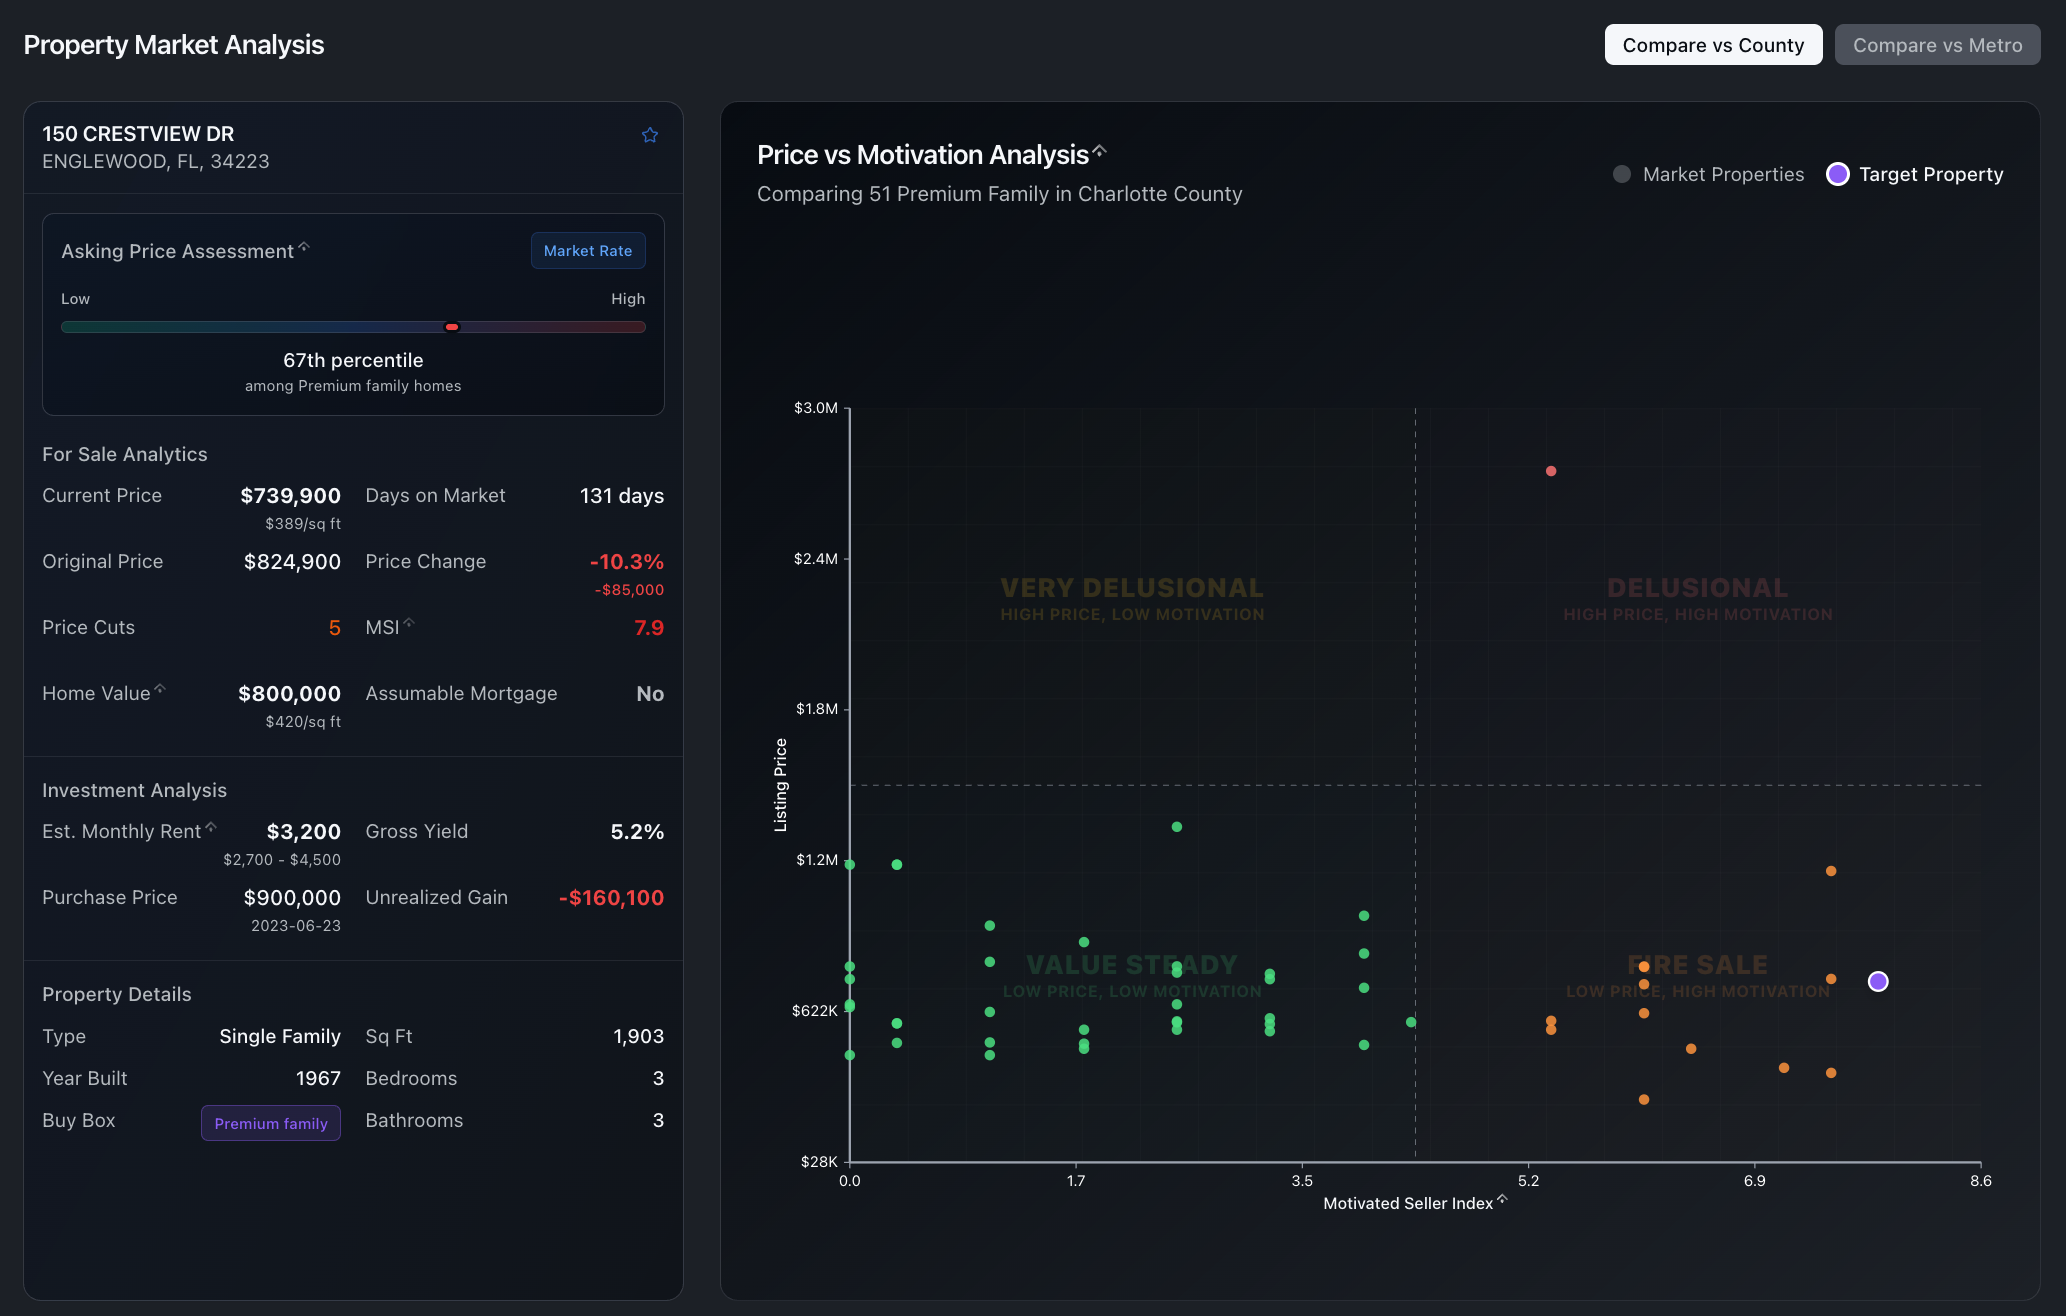
Want to track seller motivation in real time? MSI updates daily for every market nationwide in the Parcl Labs app. to see current scores and compare against national benchmarks.
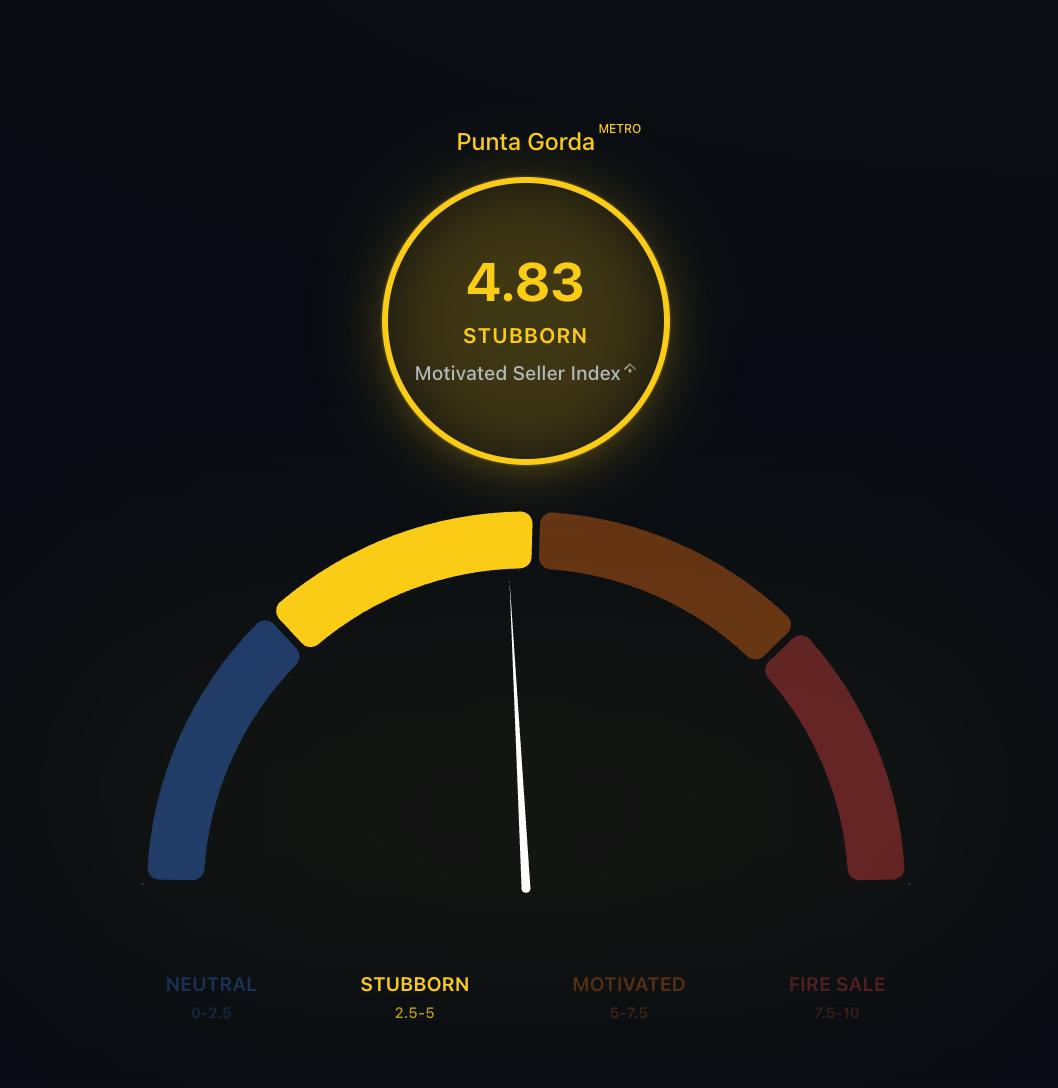
If you're active in the housing market, this intelligence is critical. We provide seller motivation scores not just at the market level, but for individual listings. Whether you're buying or selling, understanding seller urgency and competition gives you an edge in negotiations.
for deals and competitive intelligence in your market.

Follow Us for More