Tampa's Hidden Supply Pipeline: Land Banking Fuels Mounting Market Pressure
Sep 18, 2025 · 10 min read
Parcl Labs maps Tampa land banks set to supply thousands of new homes to an already volatile market.

Executive Summary
Tampa has flipped from market leader to red flag. Prices are down 4.2% YoY, 53% of listings have cut prices, and Tampa ranks #1 nationally on Parcl Labs' Motivated Seller Index.
New construction faces the most pressure. Tampa new builds show the highest motivated seller activity as builders exhaust incentive strategies and resort to price cuts.
Tampa's Pasco County highlights concentrated builder risk. This single submarket added 43% of Tampa's new single-family housing since 2019. Now, falling sales and rising inventory challenge builders trying to sell into an oversupplied market.
Traditional inventory metrics miss thousands more homes in Pasco's pipeline. Tampa's supply imbalance isn't just active listings that need to clear. Using new land analytics and entity tracking capabilities, Parcl Labs mapped off-the-radar land banking arrangements holding future supply that will hit the market.
This hidden pipeline threatens to amplify volatility in an already stressed Tampa market. Boom-era absorption assumptions aren't matching current demand, leaving land banking partners, developers, builders, homebuyers, and owners all exposed.
This situation is actively unfolding across Tampa and new construction-heavy markets nationwide. Parcl Labs will continue reporting on distress signals in real time. Create an account to follow the data as it updates, or email team@parcllabs.com for custom analysis on your markets.
Tampa Flashes Red
Tampa was a pandemic housing boom leader. It's now a warning.
As of September 2025, home prices have dropped 4.2% year-over-year. 53% of active listings have cut prices. Tampa now ranks #1 among major U.S. metros for motivated seller activity.
Figure 1. Tampa Price Feed Compared with U.S. Benchmark
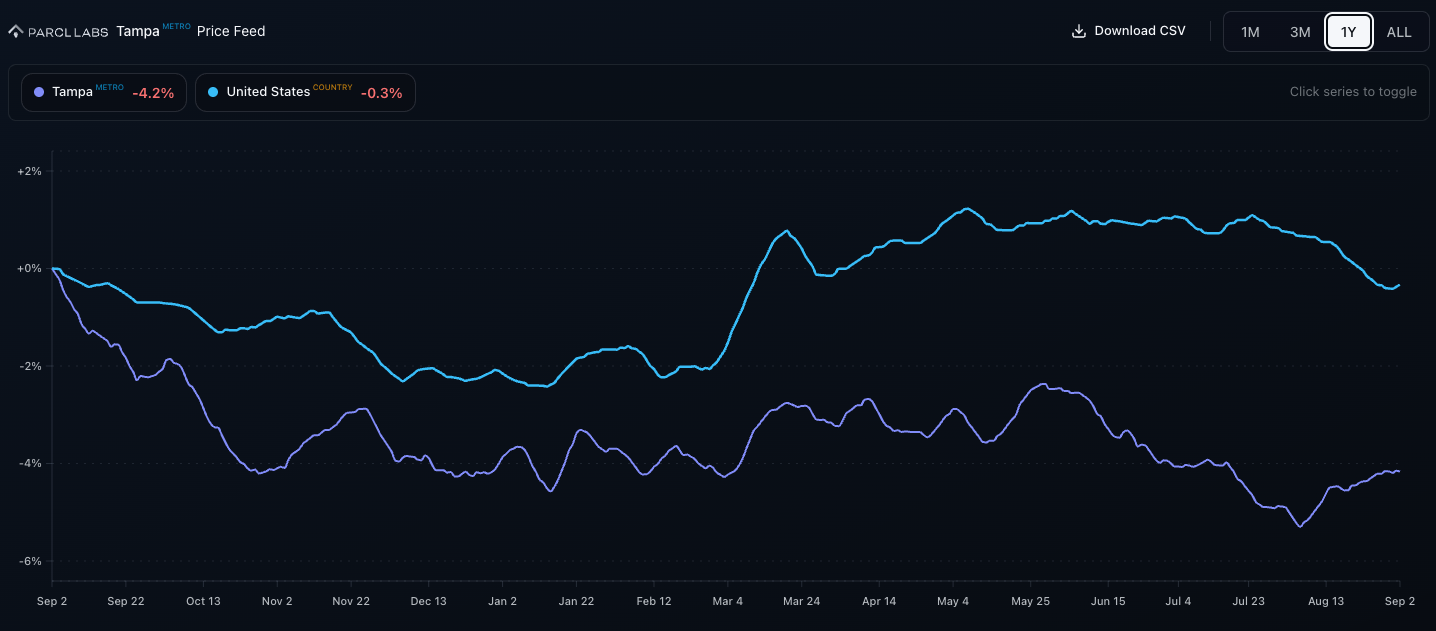
Parcl Labs flagged these risks early. In 2023, we highlighted Tampa as speculative, driven by high investor and institutional concentration. In 2024, we identified Florida as the epicenter of potential home price declines - Tampa included. WSJ, CNBC, Business Insider, and others picked up the research as we made the call before consensus.
These predictions proved accurate. But headline metrics highlighting Tampa's weakness may actually understate the issues to come.
New Construction Struggles
New construction faces Tampa's most intense pressure.
Homes built within the last five years are the most motivated seller segment, averaging 79+ days on market with price cuts exceeding 3%.
Figure 2. Motivated Seller Index by Metro and Single-Family Vintage
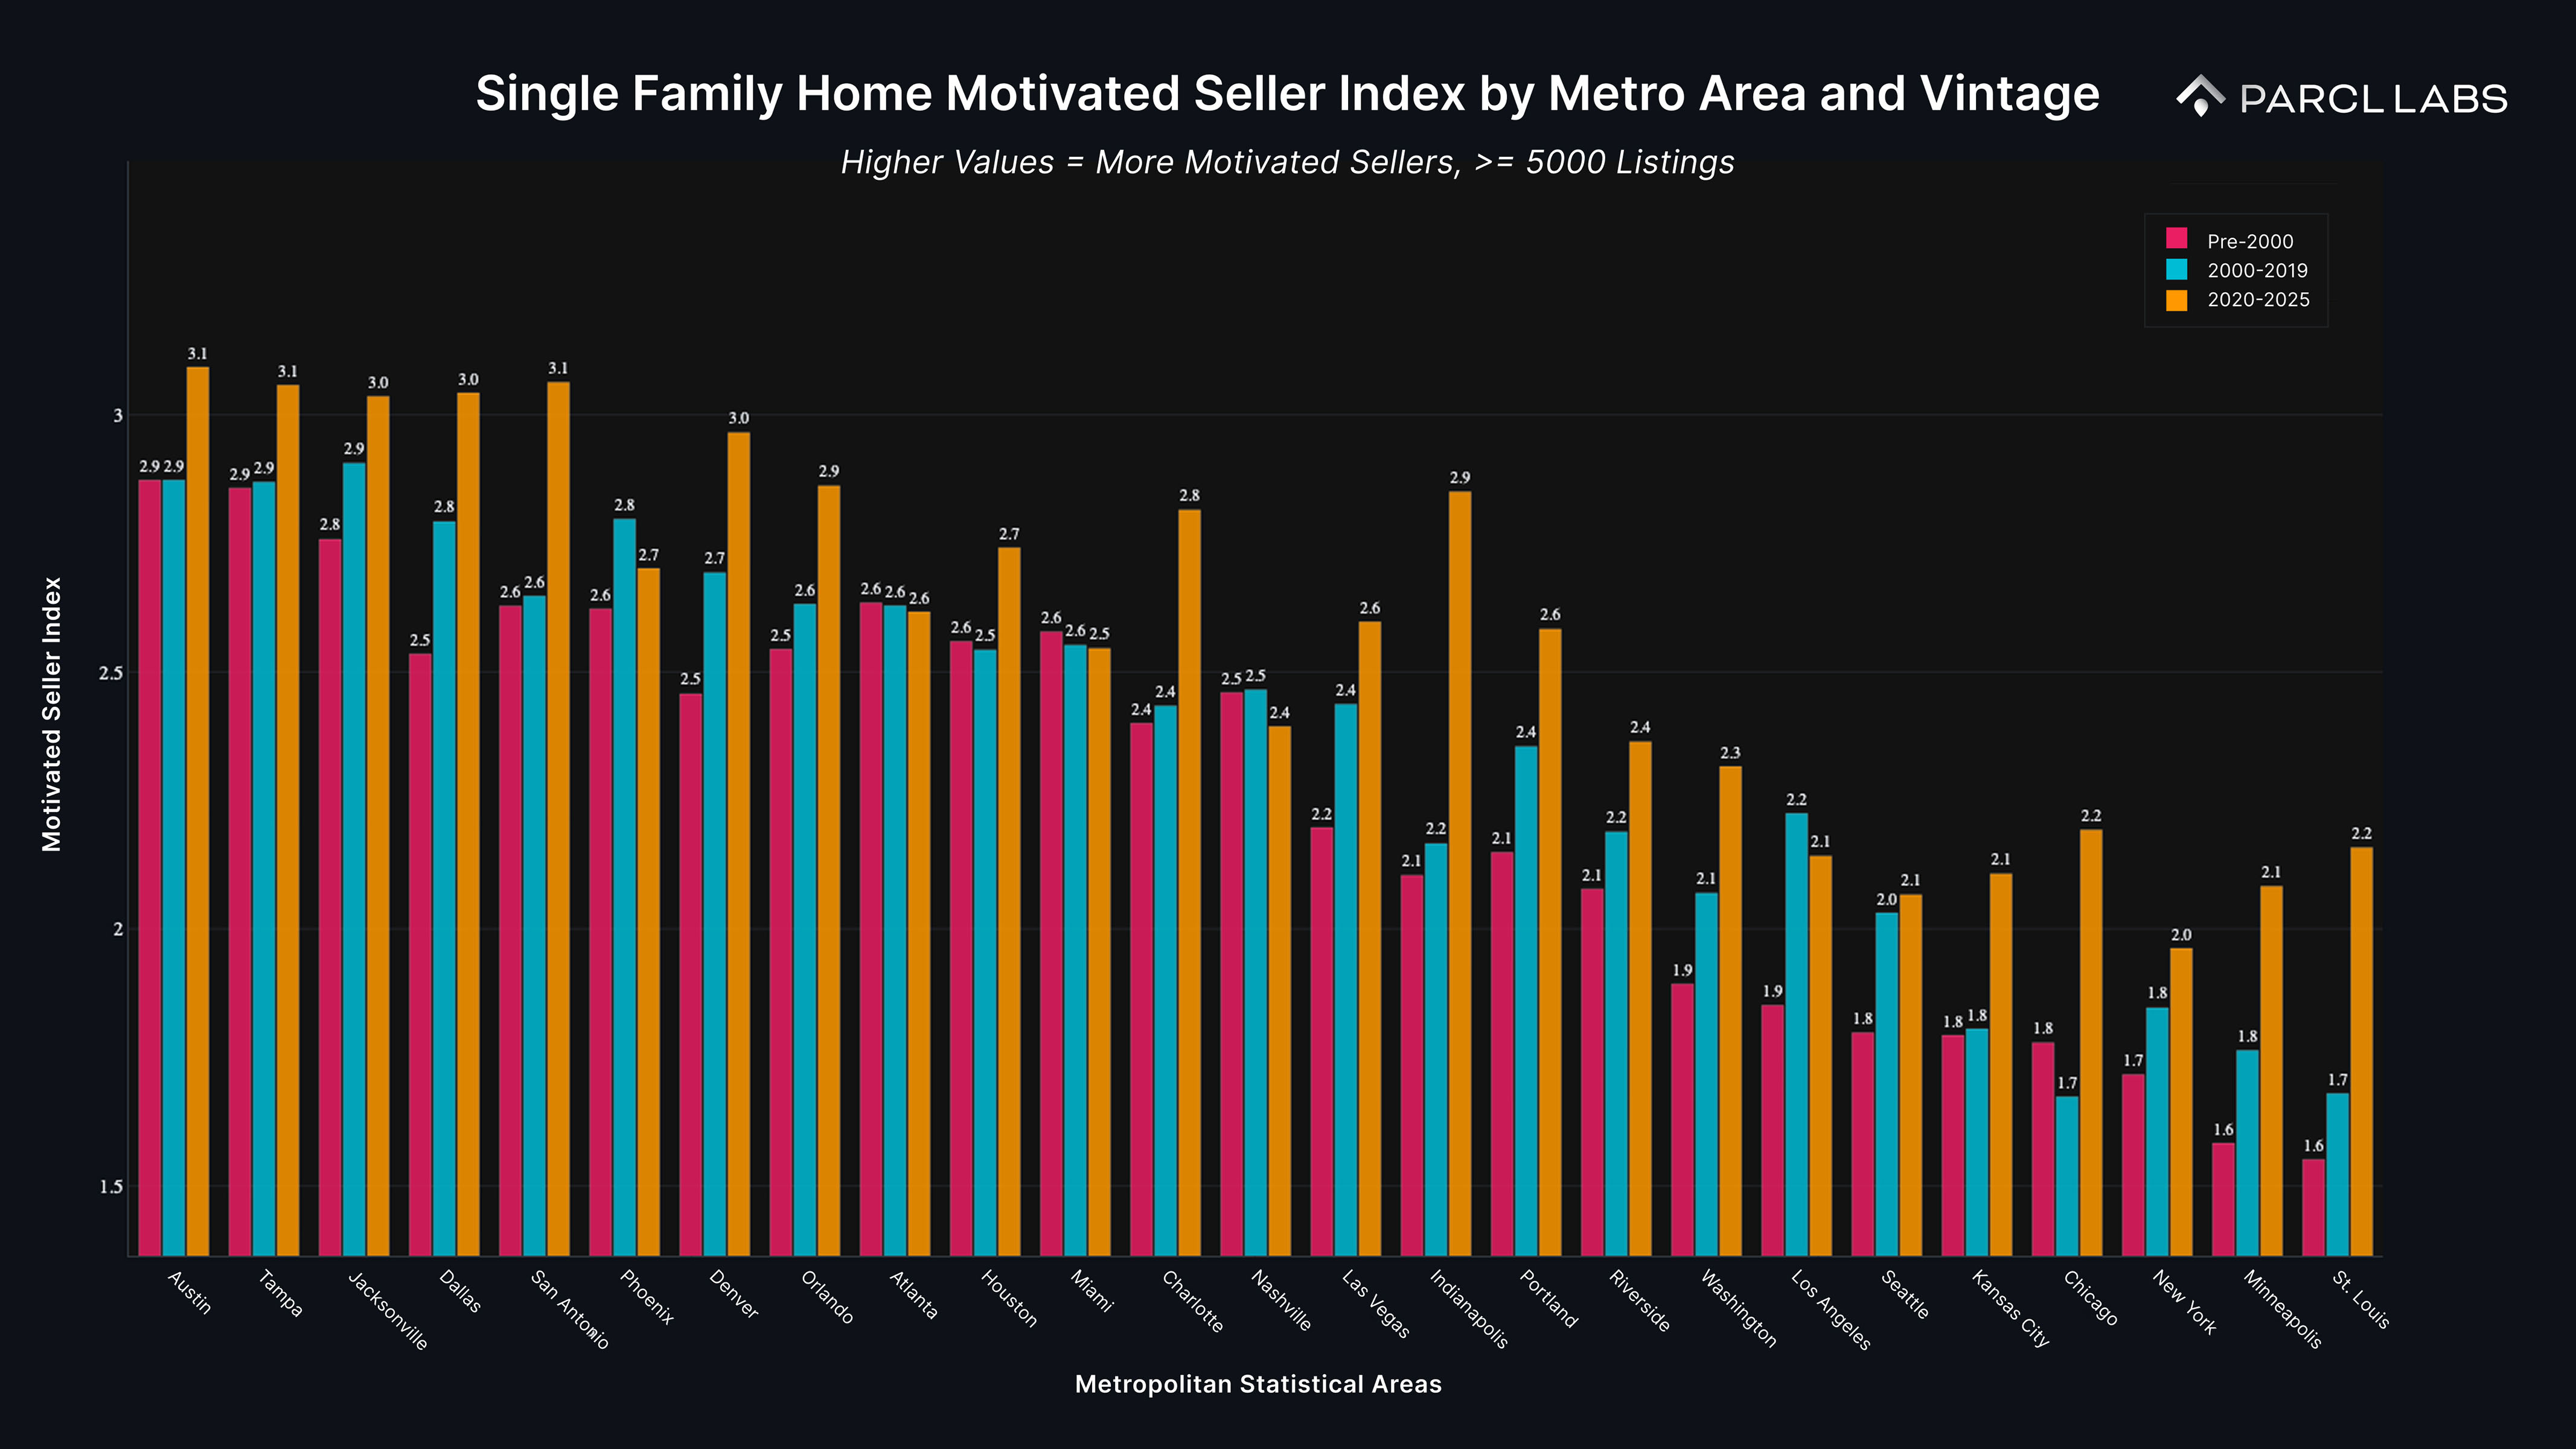
As the market softened, builders moved inventory through buydowns and incentives, keeping absorption up while protecting list prices. The elevated Motivated Seller Index (MSI) shows that approach has hit its limit. New homes in Tampa now sit longer despite concessions, forcing the price cuts builders worked to avoid.
Is this just current inventory that needs to clear, or is the supply story just starting?
To find the answer, we investigated Pasco County, a Tampa submarket where builders went big. What's hidden in that pipeline—and what traditional inventory metrics miss—indicate Tampa's supply problem may be far from over.
Pasco County: Supply Overhang Where Builders Went Big
Pasco County represents Tampa's northern growth frontier. It serves as a commuter submarket that has been a new construction hotbed since 2020, with development sprawling east into formerly rural areas. This expansion makes Pasco a telling case study for Tampa's new construction pressures.
The scale of Pasco's recent housing growth is striking. Since 2019, single-family housing stock within the county has grown 14%, compared to 6.7% in the broader Tampa metro. Pasco accounts for 43% of all net-new single-family homes added to the Tampa metro during this period.
Figure 3. Net-New Single-Family Stock Since 2019 — Pasco County vs Rest of Tampa Metro
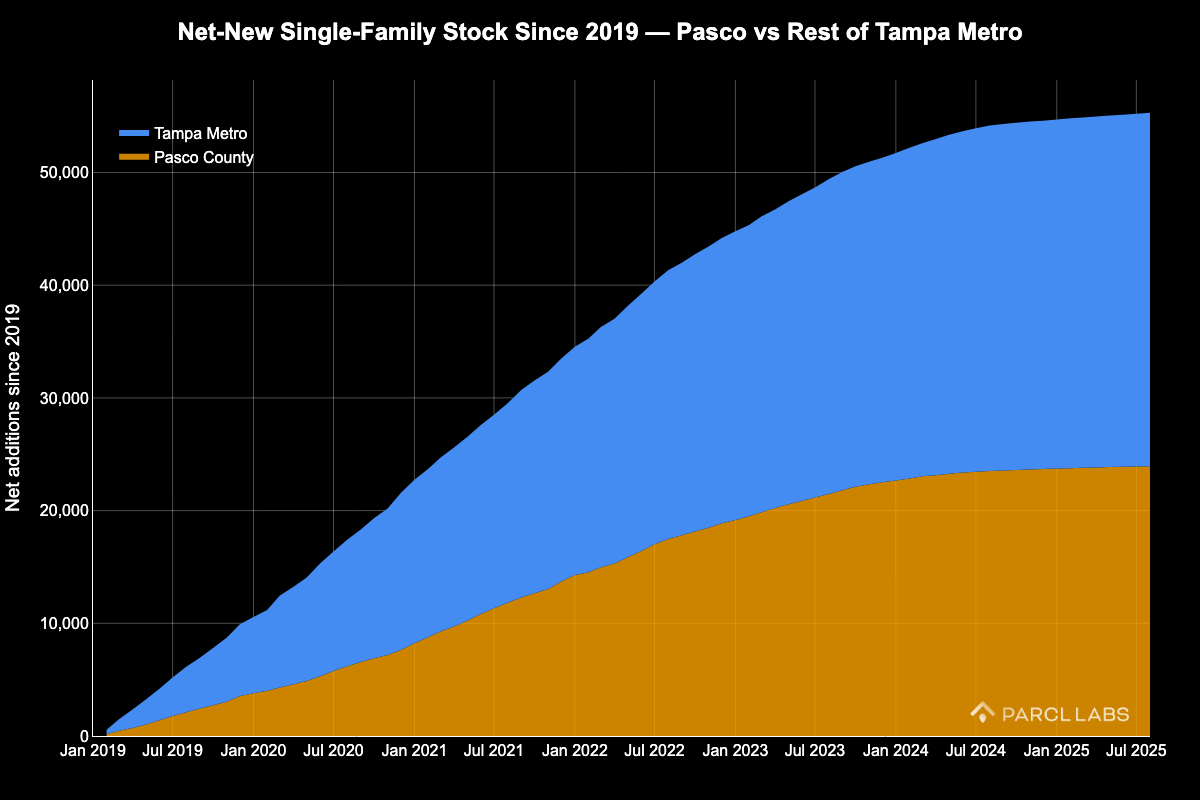
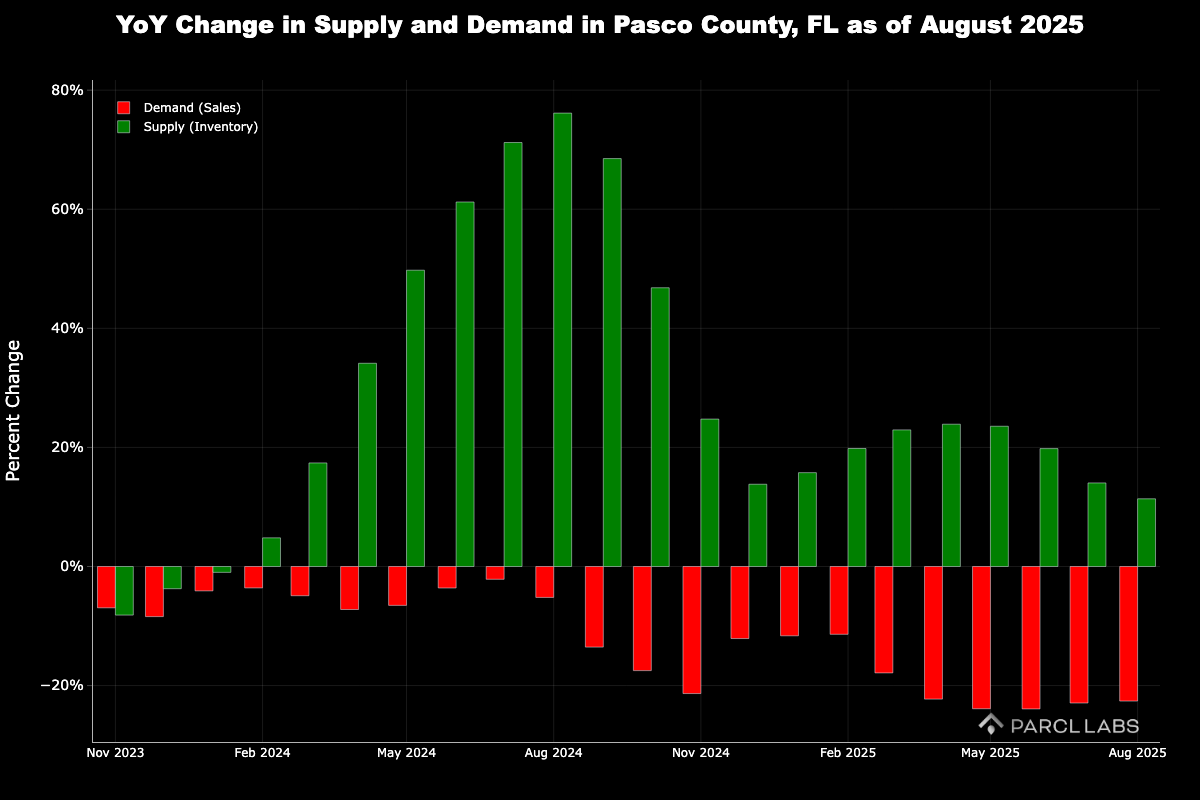
This new development isn't being fully absorbed. For 19 consecutive months, Pasco's single-family inventory has risen while sales have fallen year-over-year. The most recent month shows supply up 11.3% versus demand down 22.6%—a 34 percentage point gap. Simply put: Pasco sellers are growing, buyers are declining.
Figure 4. YoY Change in Single-Family Supply and Demand in Pasco County
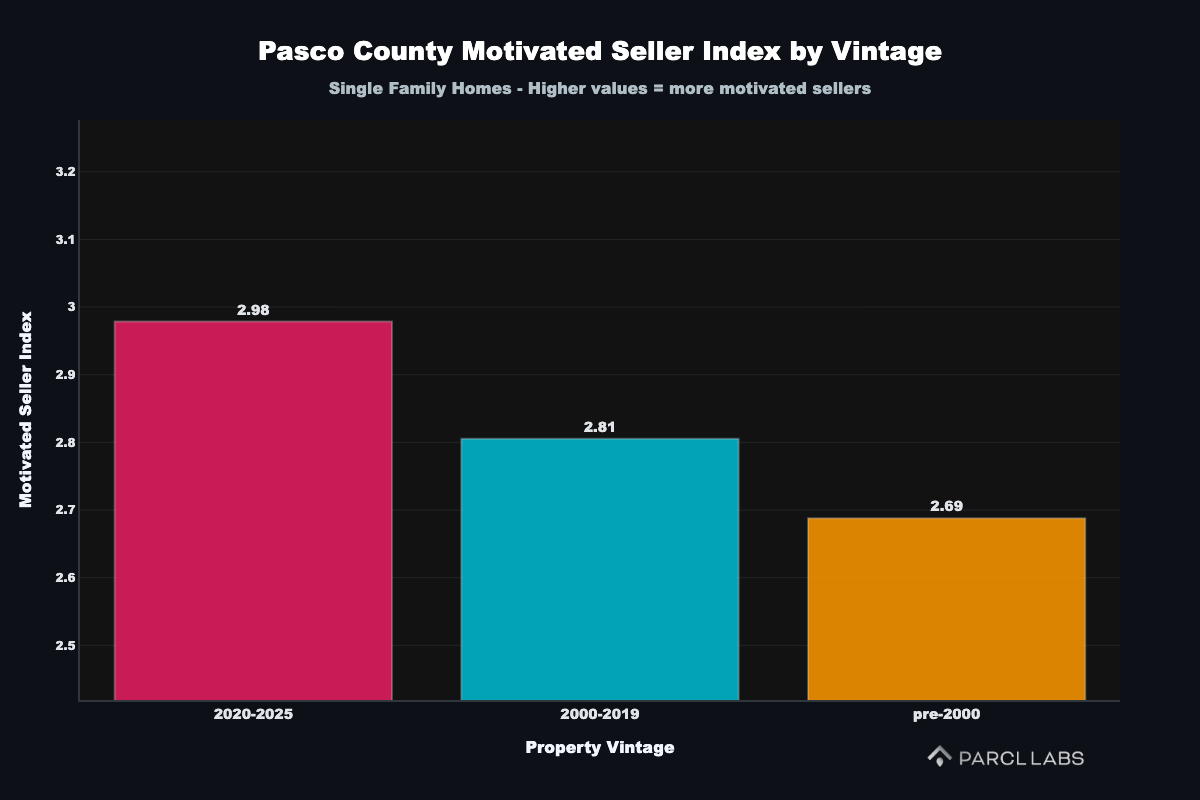
Motivated seller analysis confirms builders are feeling the heat of the supply-demand imbalance. Like the broader Tampa metro, Pasco's new construction homes post the highest Motivated Seller Index, 6% higher than 2000-2019 vintages and 11% higher than pre-2000 homes. New homes are sitting longer on market and taking deeper price cuts than older resale properties.
Figure 5. Motivated Seller Index by Vintage in Pasco County
In summary, Pasco's rapid housing expansion has created a supply-demand mismatch hitting new construction hardest.
Major homebuilders - DR Horton, Lennar, LGI Homes, Pulte, M/I Homes, KB Home, NVR, Meritage, and many others - all have significant exposure across the county.
Land Banking and Hidden Supply Pipeline In Pasco
The analysis above captures Pasco’s current inventory: what's already built and visible in traditional metrics. What it doesn't show - and what could be the bigger story - is the development pipeline that will hit a distressed market in the months and years ahead.
Using new land data coverage, geospatial analytics, and expanded true entity tracking, Parcl Labs can now unmask and map what traditional housing data misses: land banking.
As background, homebuilders are increasingly deploying "land-light" strategies. Instead of buying land directly, they partner with land banking entities and developers who purchase, entitle, and hold properties. Builders then take over parcels via structured "takedown schedules": predetermined timelines for acquiring finished lots as needed.
This creates a just-in-time inventory system that keeps land off builders' balance sheets and looks efficient for everyone involved. That scenario changes when absorption slows and the pipeline backs up.
These complex arrangements have made future supply invisible to traditional analysis. Parcl Labs can demonstrate what many Pasco County builders are doing: leveraging land banking deals that create substantial off-balance-sheet exposure and hidden inventory risk.
Case Study 1: Riverwood Estates CDD
Riverwood Estate Community Development District in eastern Pasco County illustrates land banking dynamics in action. Originally planned in 2006, the development stalled when the developer went bankrupt. Riverwood recently revived under a land banking structure: JEN Partners holds the land while Pulte manages development and sales.
Pulte keeps the land off its balance sheet until exercising lot purchase options. Parcl Labs’ geospatial map below shows this arrangement as of July 2025: orange parcels remain with JEN Partners, blue parcels have been taken down by Pulte, and black-outlined lots have sold to individual homeowners.
Figure 6. Riverwood Estates: Land-Bank Footprint and Builder Activity, July 28, 2025
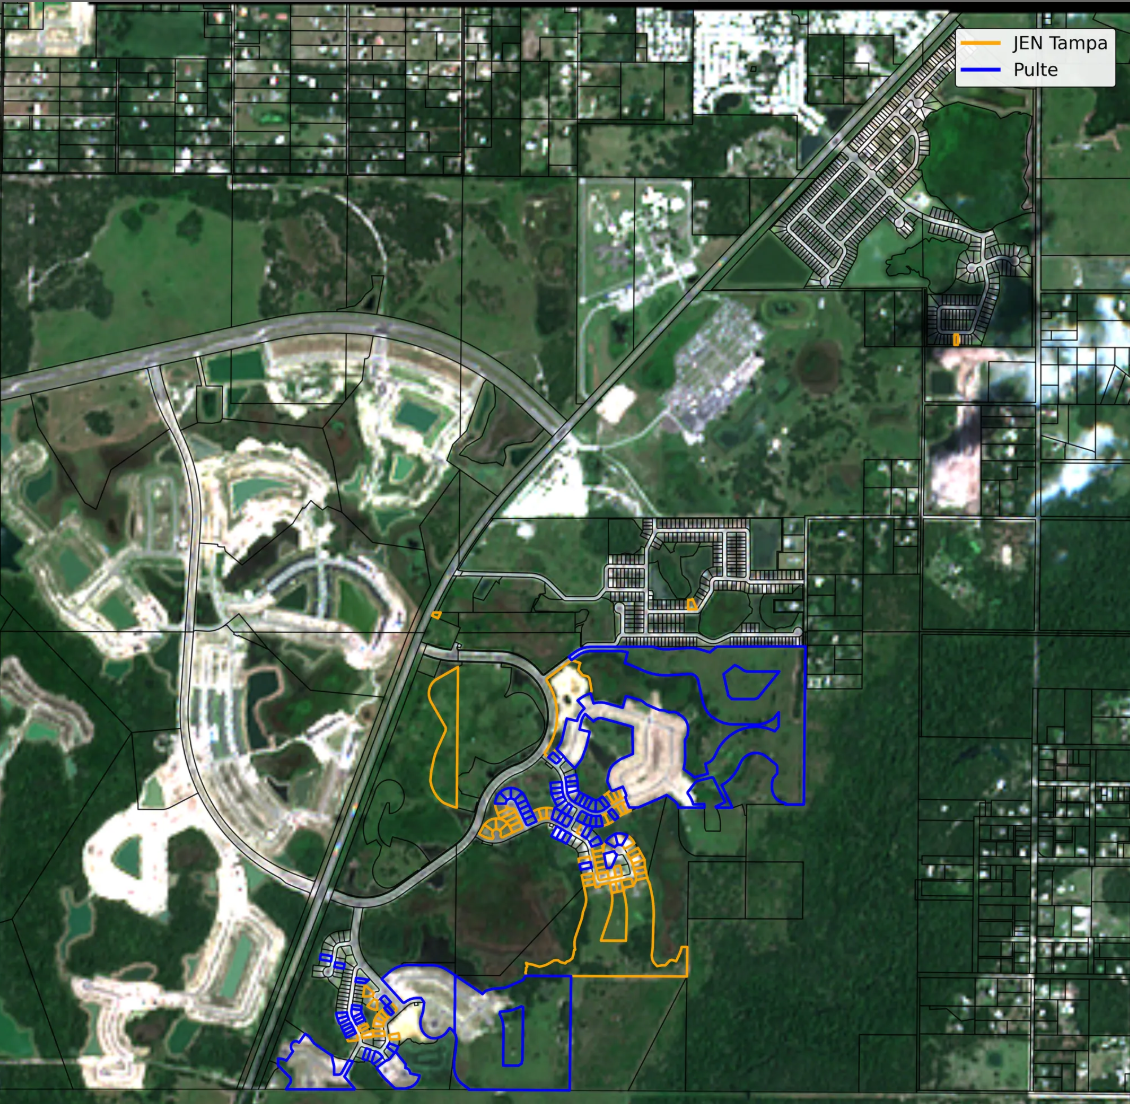
The visualization reveals two critical insights. First, Pulte faces intense competition from builders ahead in the development cycle. Lennar, Casa Fresca Homes, and KB Homes all have active projects in this pictured dense development area, meaning Pulte's future inventory will compete against established communities.
Second, traditional inventory metrics miss the entitled land JEN Partners still holds. Those orange parcels represent committed future inventory that Pulte is marketing and will soon hit a crowded market.
Case Study 2: Pasadena Ridge CDD
Pasadena Ridge CDD represents another active land banking arrangement in eastern Pasco County. Like many Pasco developments, this project converts former farmland in an area saturated with competing new construction. The scale is significant: when complete, Pasadena Ridge will include ~2,000 new homes, with delivery extending past 2028.
The arrangement pairs Domain (DRP) as the land banking entity with Homes by WestBay, a regional Florida builder with extensive Pasco County presence. Our analysis captures the earlier stages of Pasadena Ridge's development cycle:
Land ownership: The land parcels remain un-subdivided and owned by DRP. We track this through entity analysis: DRP operates through multiple subsidiary LLCs, which we map back to the parent company, revealing the full scope of DRP's land banking position.
Development progress: Satellite imagery analysis shows the physical transformation from raw farmland to active development. Our mapping documents foundational work was underway as of December 2024 and accelerated through July 2025.
Figure 7-A. Pasadena Ridge CDD: Land-Bank Footprint, December 2024
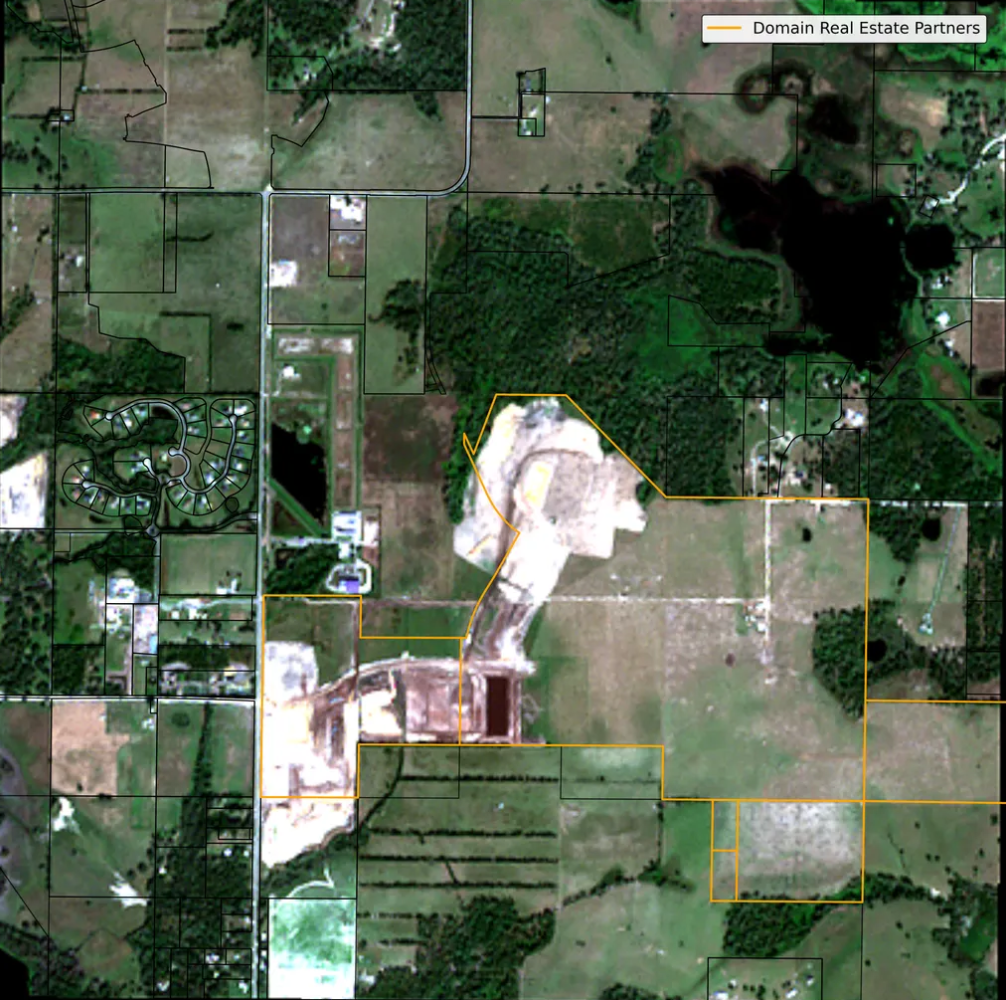
Figure 7-B. Pasadena Ridge CDD: Land-Bank Footprint, July 2025
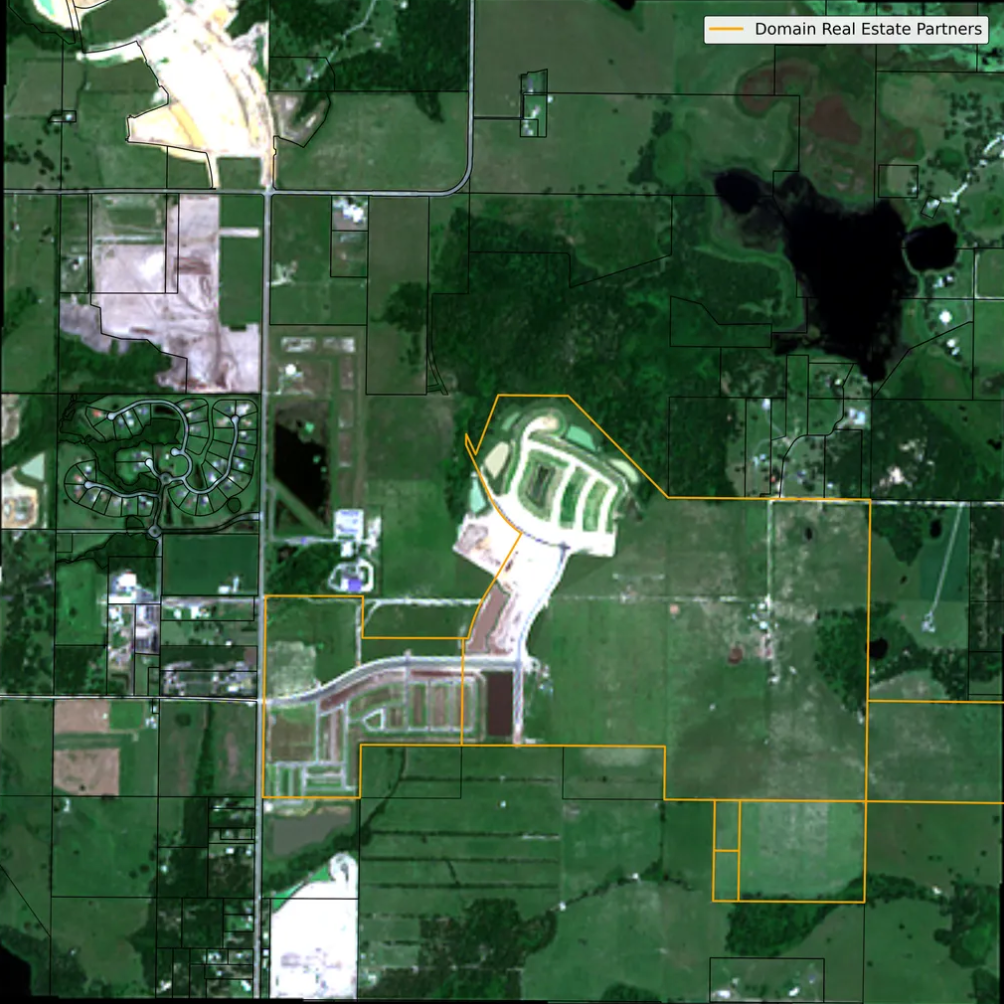
Public documentation provides insight into the development timeline: infrastructure for the initial phase completes in Q4 2025, with handoff to WestBay beginning then and first deliveries starting Q1 2026. This schedule aligns with what our satellite imagery shows to date.
Pasadena Ridge will add a steady stream of new homes into Pasco's market starting early 2026. This future supply remains off the radar because it currently sits in a land bank.
What’s Next? Implications of Land Banking for Tampa Housing
The Pasco case studies help show Tampa's supply situation extends far beyond current inventory. These two examples reflect a broader pattern across the county (and overall housing market), where land banking masks a supply pipeline invisible to standard listing data. That pipeline will move thousands more new homes into an already oversupplied market, intensifying downward price pressure and prolonging the time needed to clear excess inventory.
For land bank, development, and building teams: If development plans run as written, steady new supply will continue entering Pasco's market. If builders slow takedowns to match absorption, carrying costs extend for land partners and builders. If they walk away, builders forfeit hefty deposits. The contracts are complex, but the core issue is simple: boom-time sales and pricing assumptions are not matching today's demand. The downside lands somewhere in this chain.
For home buyers and owners: Both case studies operate through Community Development Districts (CDDs): Florida's special government framework for financing infrastructure with bonds that owners repay through additional property taxes.
Early CDD buyers face tough math. Many paid peak prices while builders used incentives to hold list prices. As builders reprice to current market conditions, later buyers potentially get comparable homes for less. Early buyers remain locked into their higher purchase prices plus ongoing CDD obligations. When they want or need to sell, they compete against discounted, fresh inventory, making it difficult to break even.
What's next? The analysis above shows how tightly integrated players are in markets like Pasco. Distress in any part could create cascading effects. This dynamic is unfolding across builder-heavy markets nationwide. Key indicators to monitor:
Supply-demand imbalance: Whether inventory continues rising while sales decline
Builder pricing pressure: New construction motivation spikes and deeper price cuts
Development pace: Slowdowns visible through satellite analysis and ownership transfers
Homeowner distress: Early delinquency signals and rental or resale attempts in new communities
Parcl Labs will continue mapping the supply pipeline, tracking the players, and publishing these signals so you can stay ahead. If Tampa is on your radar, create an account with Parcl Labs to follow the data as it updates.
The next chapter will show up here first.
Need this level of visibility for your sites and markets? Email team@parcllabs.com about custom analysis that uncovers what legacy research providers miss.
Methodology
For the gap in supply and demand, we calculate the monthly year-over-year (YoY) percentage change for supply - measured by total for-sale inventory - and demand, measured by the number of completed sales transactions. We then apply a 3-month moving average and calculate the supply–demand change differential.
For the Motivated Seller Index, we analyze four key factors: days on market, number of price cuts, velocity of cuts (time between cuts), and size of cuts. Each active listing and market receives a daily updated Motivated Seller score, categorized as:
Neutral (0–2.5)
Stubborn (2.5–5)
Motivated (5–7.5)
Fire Sale (7.5–10)
We track ownership of land intended for residential real estate development using our proprietary dataset, which powers our API. Once land transactions and corresponding records are identified, we query relevant open satellite imagery and cross-reference it with the parcels flagged in earlier steps. Finally, we process the raw satellite imagery and perform a spatial join to highlight the areas of interest.

Follow Us for More