U.S. Housing Market Turns Negative For the First Time in Years
Dec 12, 2025 · 4 min read
Daily price readings from Parcl Labs reveal a shift that rarely appears in U.S. housing data: national home prices have turned negative year over year.
Daily price readings from Parcl Labs reveal a shift that rarely appears in U.S. housing data: national home prices have turned negative year over year. While the decline is modest (-0.2%), the signal is meaningful. The extended cycle of home price growth is now constrained by affordability pressures and a measurable cooling in demand.
Below, we break down what changed, which markets pushed prices into the red first, and what our high-frequency data suggests as we head into early 2026.
National Price Growth Breaks Below Zero
Comparing the last 30 days of November to the same period last year, Parcl Labs’ Price Feed registers a -0.2% year-over-year decline in national median price per square foot.
Three trends pushed the national number into negative territory:
The pandemic run-up in 2020–2022 inflated baseline prices.
Mortgage rates spiked in 2022–2023 and stayed elevated through 2025.
Buyer demand softened as affordability is becoming too much to digest for most.
This combination has been building for months. The national figure finally reflects it.
Beneath that headline, dispersion is wide. Some metros have already been negative for most of 2025 while others remain stable.
Where the Declines Are Coming From:
The sharpest weakness sits in a small group of Sun Belt markets. Austin leads at -10.1% YoY, followed by North Port and Lakeland Florida, both down more than 6%. These markets have faced affordability strain, new construction oversupply, and slower absorption for months.
A second tier of declines spans Denver, Tampa, Orlando, and Phoenix, all falling between -2% and -5%. These metros have shown steady softening through 2025, with longer marketing times and deeper cuts.
Below that, Jacksonville, DC, Las Vegas, San Jose, Miami, San Antonio, Minneapolis, and Charlotte now show mild YoY declines.
Most Northeastern and Midwestern markets remain positive. Tight inventory and steadier demand continue to support pricing in New York, Chicago, Cleveland, Cincinnati, Pittsburgh, and Philadelphia.
The pattern holds: the South and West carry the clearest price pressure, while the Northeast and Midwest remain more resilient.
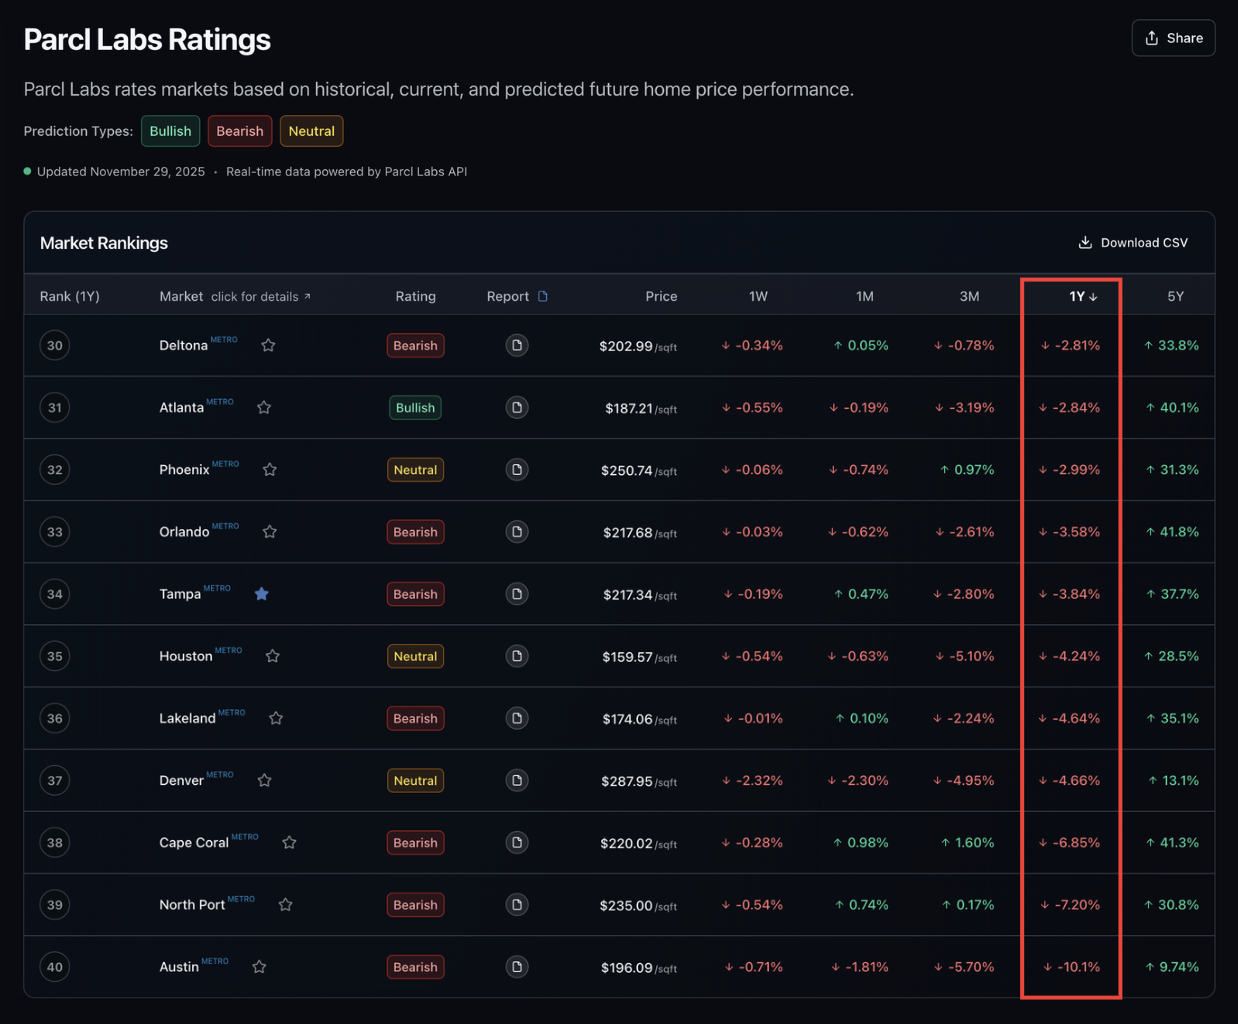
You can view the full price performance of 40 of the largest U.S. metros here.
Historical Context: Negative Prints Are Rare
National prices do not fall often.
The last time they went negative was mid-2023, during the affordability shock that followed the rapid rate hikes of 2022. Before that, the last sustained national decline was during the 2008–2012 financial crisis.
Today’s decline looks different. There is no foreclosure wave. Inventory remains low. Builder pipelines are more disciplined - though certain regions do suggest a new build glut (Austin and parts of Florida). This downturn is driven almost entirely by affordability and weakened demand, not distressed supply.
That distinction matters for what happens next.
What Comes Next: A Market That Hovers Near Zero
Our base case is a flat market, not a broad collapse.
We expect small positive or small negative year-over-year changes to dominate the next several months. Local stories will continue to diverge:
Sun Belt markets may post deeper declines.
Northeast and Midwest metros may hold mild gains.
Florida remains the biggest wildcard.
Mortgage rates are the swing factor. If rates ease into early 2026, price declines should stabilize. If rates stay elevated or the economy weakens, pressure will build on sellers.
For now, the national decline is shallow. But it confirms what our metro-level data has been warning: the market has entered a low-growth, high-dispersion phase.
Why Our Data Caught the Shift First
The Parcl Labs Price Feed is built to detect turning points early. It updates daily and incorporates both closed sales and active listings. That blend lets the index capture market changes weeks before traditional measures.
Key differences:
Coverage.
Repeat-sales indices only include homes that have sold twice. Our metric includes all residential property types: single-family homes, townhomes, condos, and new construction. Fast-growing markets and markets with heavy condo pipelines show more accurate real-time moves in our feed.
Timeliness.
Listing data flows through our system continuously. Every afternoon, the national index adjusts based on fresh inputs. Most legacy indices are monthly and lag by several weeks.
Scale.
The system aggregates more than 70,000 U.S. markets. Each market is normalized through ingestion, de-duplication, and quality checks before being rolled into the national metric. That scale gives the national line a clearer signal earlier in the cycle.
The slight national decline that appeared this week has been visible in many of our metro-level prints since late summer.
Track the Turn With Daily Data
This shift was visible in Parcl Labs’ high-frequency indices months before it appeared in headlines. You can monitor real-time price performance across all major metros in the Parcl Labs app: explore daily price changes, market rankings, and metro trends here

Follow Us for More