
Are Sellers Cutting Prices or Holding Firm? Track It Live with Parcl Labs Motivated Seller Index
Jun 25, 2025 · 5 min read
Now Live: Access real-time Seller Motivation Index, active listings, expanded market coverage, and exclusive insights. See everything new from Parcl Labs.
Are Sellers Cutting Prices or Holding Firm? Track It Live with Parcl Labs Motivated Seller Index
We’ve been shipping. Here’s all the new intelligence, data, and tools to help you stay ahead - no matter your goals in real estate.
Now live in the Parcl Labs app:
✅ Motivated Seller Index and Active Listings - Track seller urgency with daily-updated motivation scores
✅ Expanded Market Coverage - 50,000+ U.S. markets now available
✅ Data Downloader - Export data from any chart
✅ Foreign-Owned Properties and Drone Threats - Map foreign-owned properties and drone threats near sensitive U.S. sites
✅ Accidental Landlords - Failed sellers becoming landlords in investor-dominated markets
✅ Bullish Market Report - Top 5 markets projected for strongest price growth
Read on for full details.
Motivated Seller Index and Active Listings
More sellers, fewer buyers. That’s the big story in housing right now. As inventory piles up, seller motivation is the key indicator to watch: Are sellers eager to exit and cutting prices, or are they holding firm, freezing markets as buyers refuse to budge?
The answer varies widely by market - and home prices are responding accordingly. To help you navigate this uncertainty, we’re launching the Motivated Seller Index.
The Motivated Seller Index scores seller urgency based on four key factors: days on market, number of price cuts, velocity of cuts (days between cuts), and size of cuts. Every individual on-market listing and market receives a daily-updated Motivated Seller score:
Neutral (0-2.5)
Stubborn (2.5-5)
Motivated (5-7.5)
Distressed (7.5-10)
Sarasota Motivated Seller Intelligence Example:
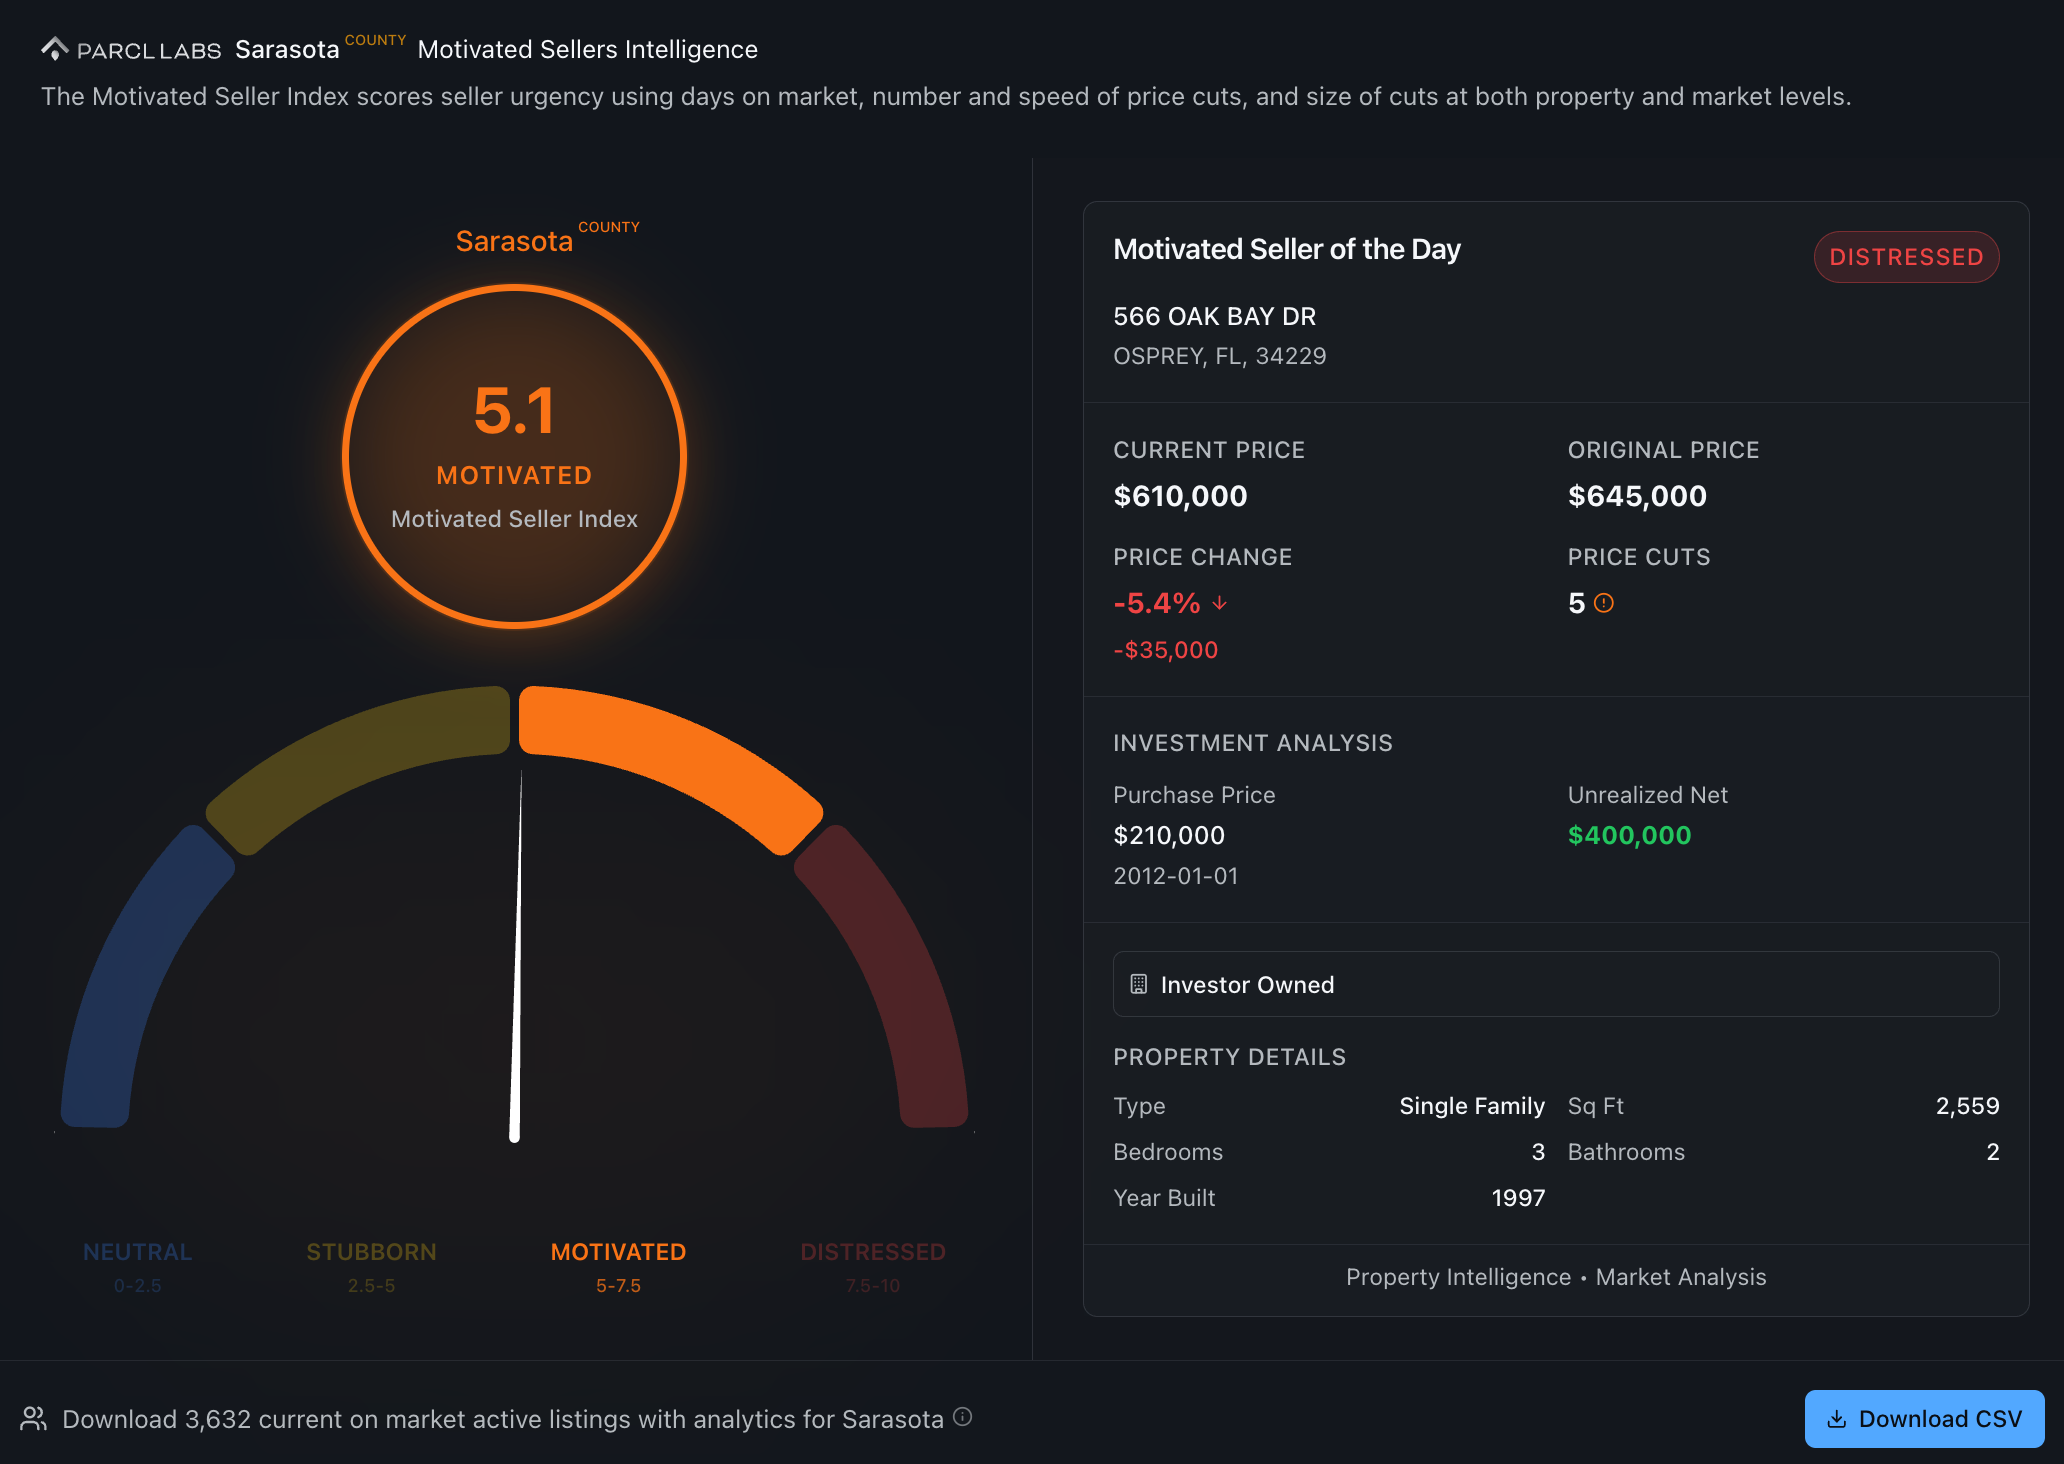
At the extreme (“Distressed”), properties sit unsold for extended periods, despite very frequent and substantial price cuts. On the other end (“Neutral”), homes sell at a typical pace with minimal price adjustments.
At the market level, the Motivated Seller Index indicates how urgent sellers are on average within your market (“How motivated are sellers here?”) and relative to other markets (“How does my market compare?”). It’s also a leading indicator of potential price pressure on home values from motivated sellers.
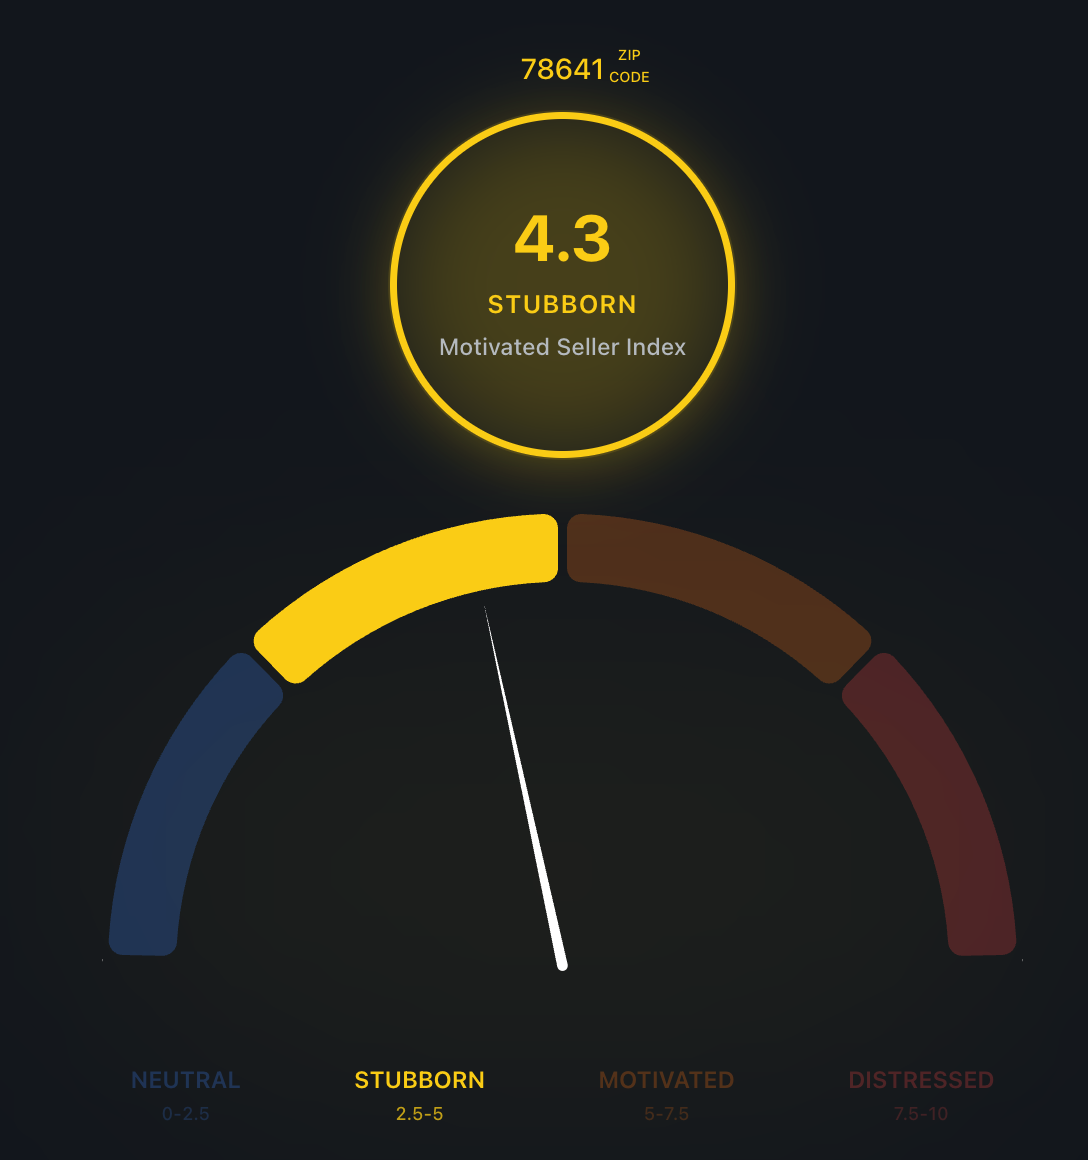
Search any market to see its Motivated Seller score.
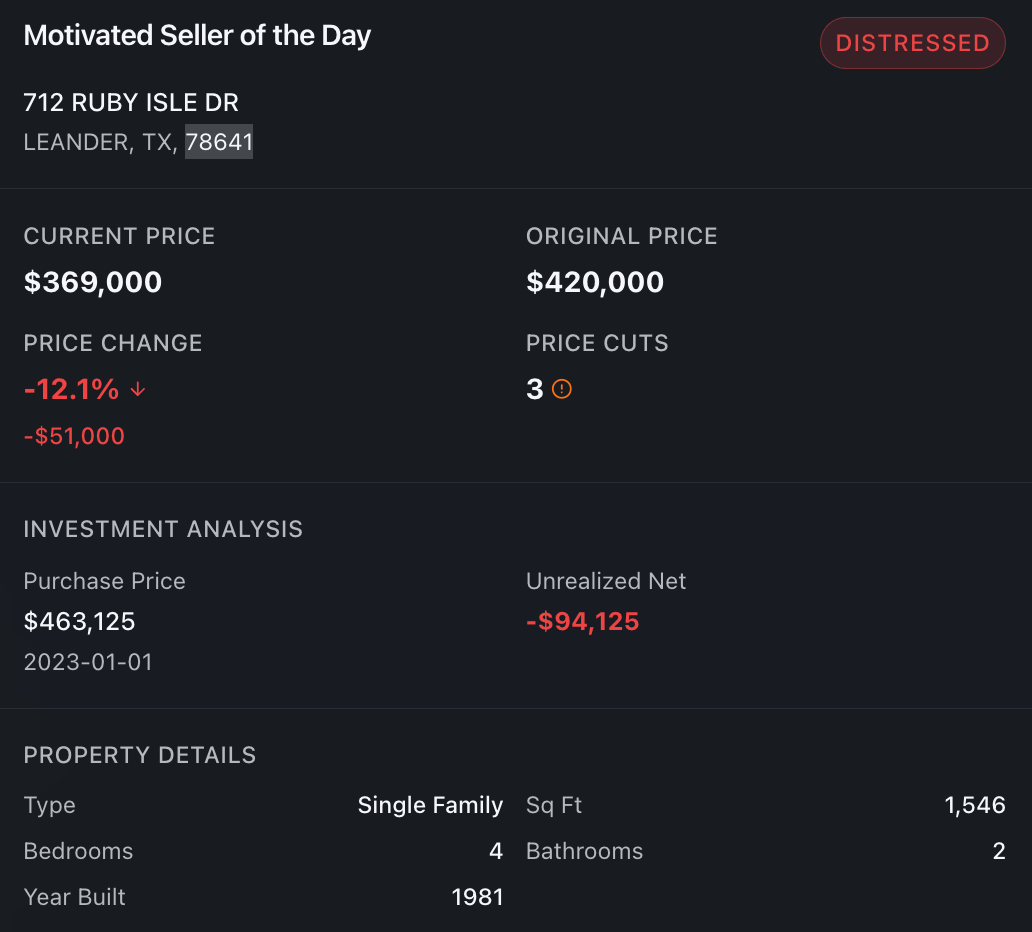
At the individual listing level, the Motivated Seller Index helps you quickly find investment opportunities and assess risks - particularly valuable if you’re looking to source deals in markets increasingly favoring buyers.
Every day, Parcl Labs’ algorithm spotlights a Motivated Seller of the Day in each market. This highlights one highly motivated seller, giving you a preview of the detailed analytics available for every individual listing - including price change history, whether the home is listed at a net gain or loss, and more.
Pro users can bulk export the full, real-time active inventory at the individual property listing level. Downloads include all active listings (across all motivation levels), property details, and unique investment insights to guide your decisions. Search your market and click download to get started. Subscribe now for instant access.
Example Active Listings CSV Download:

Expanded Market Coverage
Access to 50,000+ U.S. markets (ZIPs, counties, towns, cities, metros) is now live on the Parcl Labs app - track housing trends anywhere you care about. Saw “coming soon” on a market? Check back; it’s likely now available. Pin your favorite markets to your profile so they’re always one click away.

Data Downloader
Export data directly from any chart, table, or visualization across the app to power your own analysis and workflows.
New Research & Insights
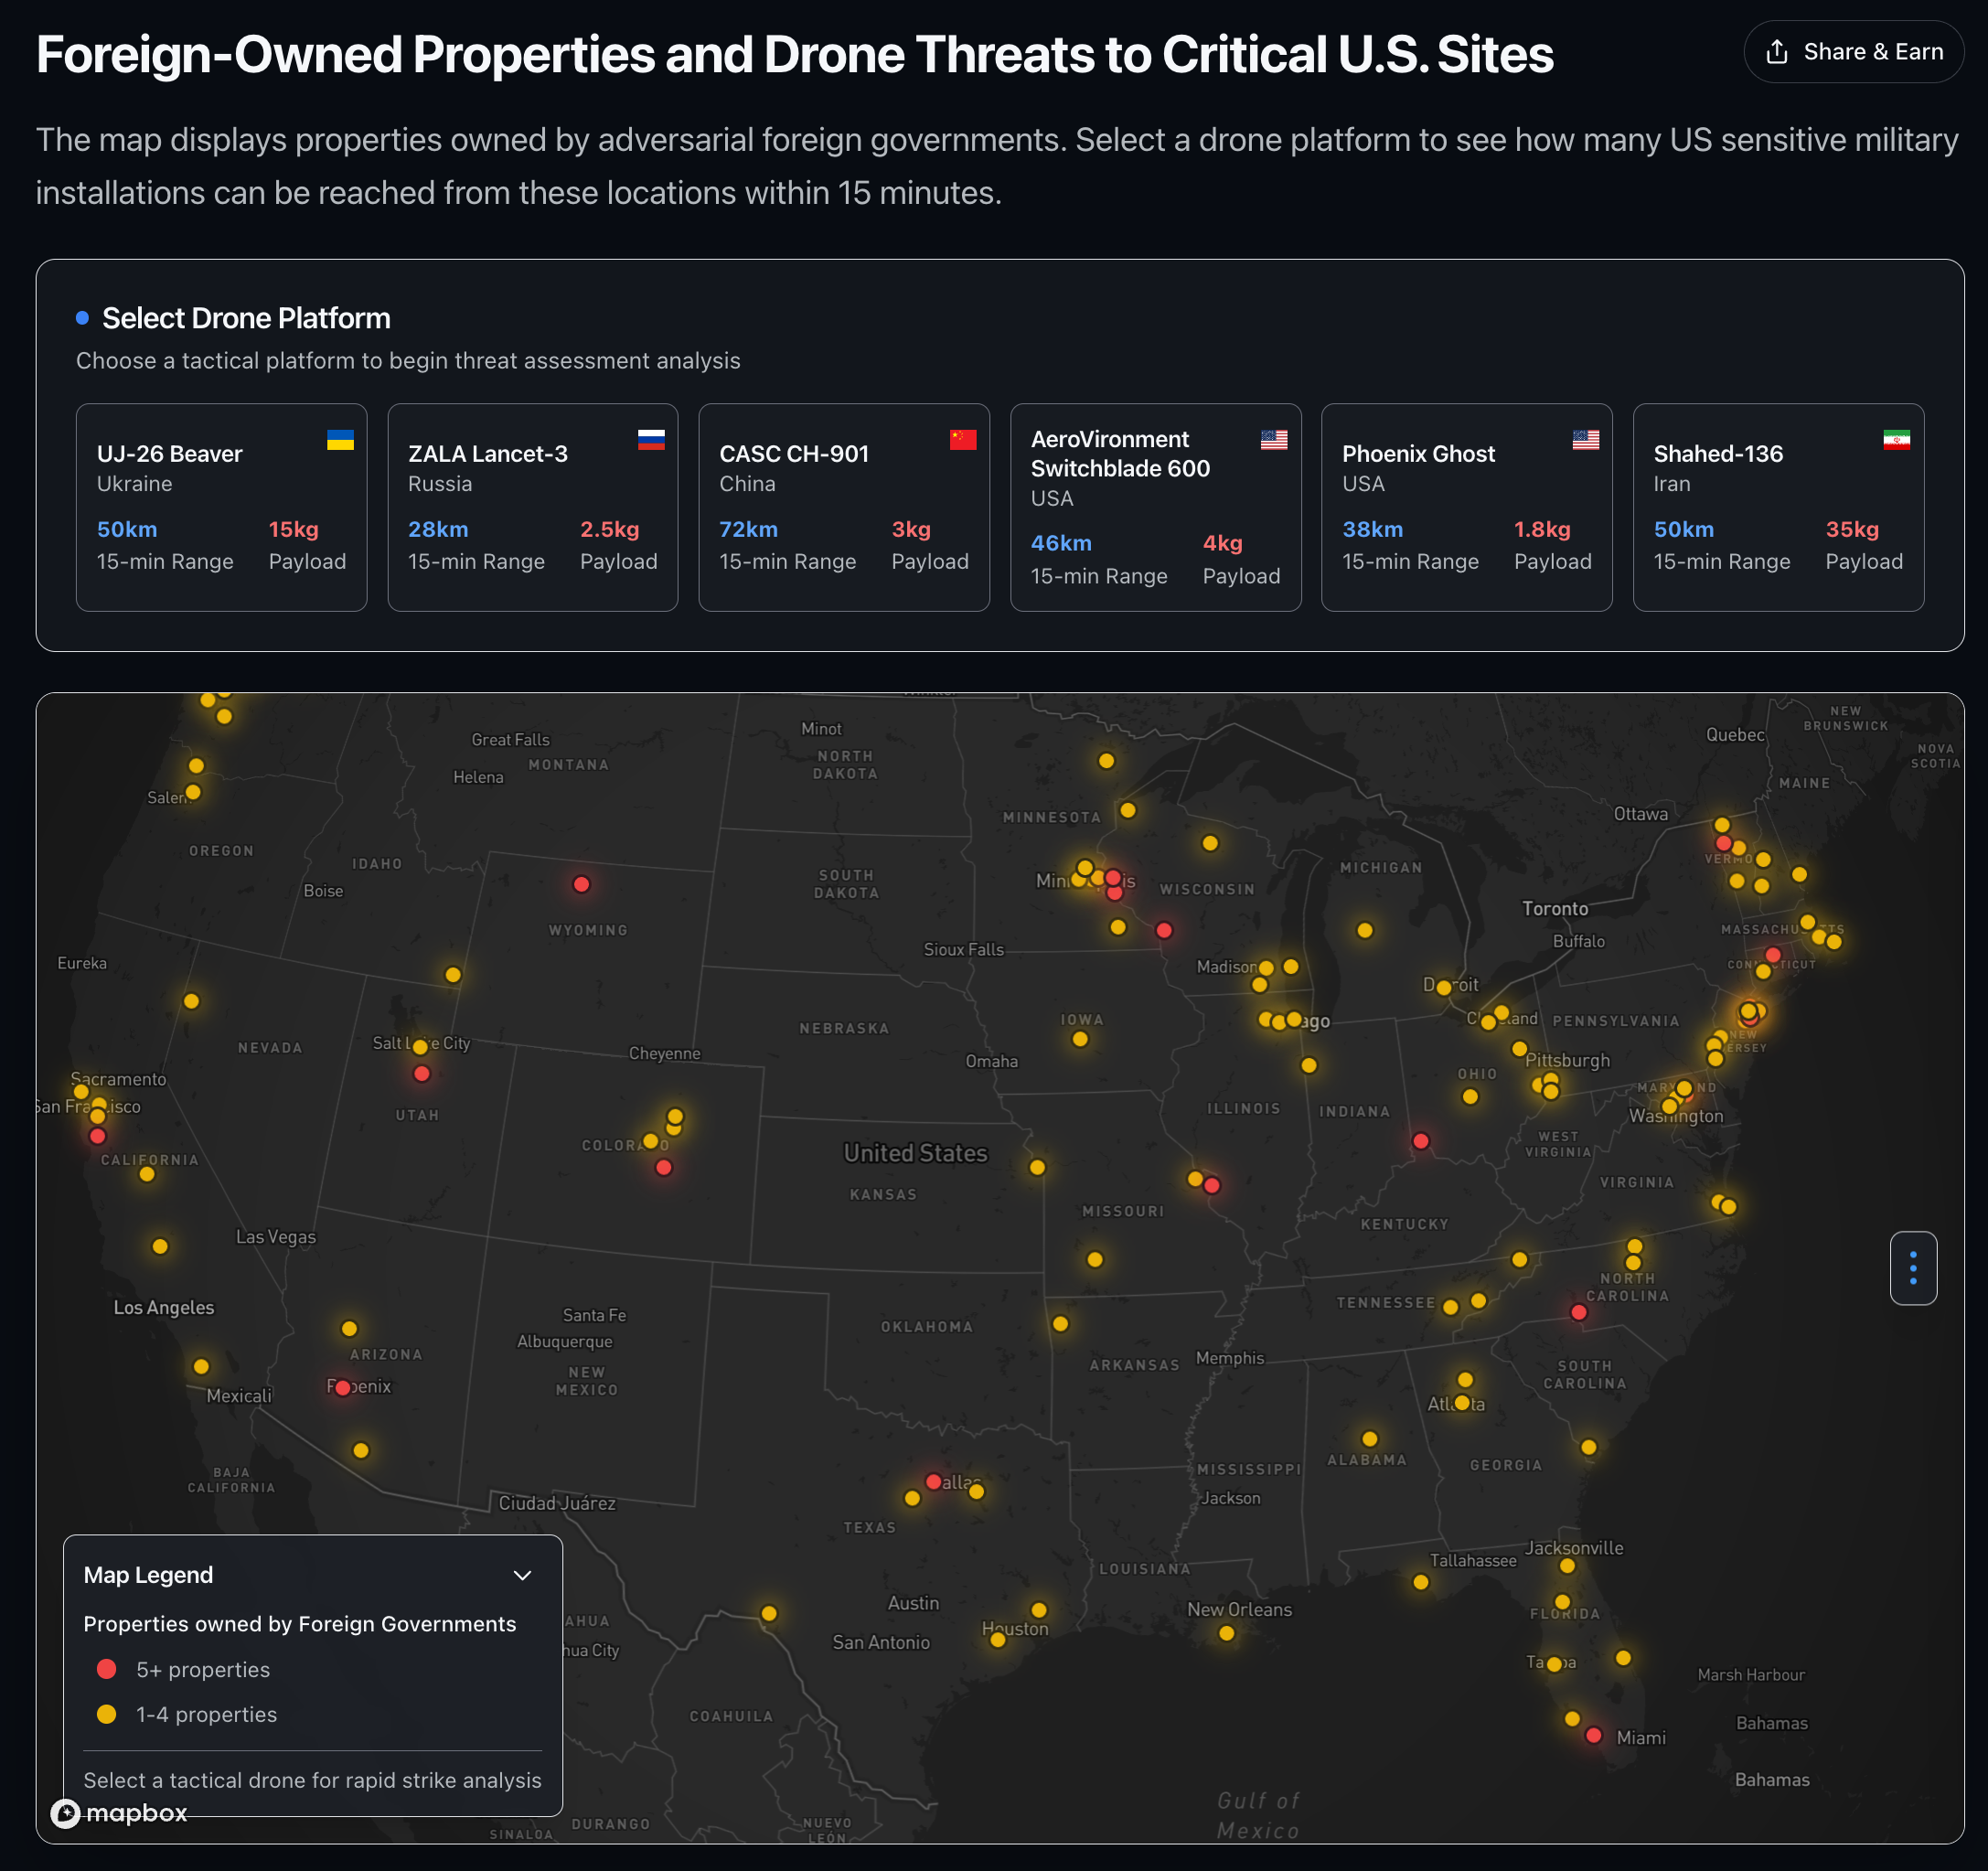
Foreign-Owned Properties and Drone Threats to Critical U.S. Sites
Parcl Labs uncovered portfolios of homes and land owned by foreign governments, using similar tech we deploy to track major Wall Street operators. The new tool maps these properties and highlights potential drone threats near sensitive U.S. sites. Check your market’s exposure and assess risks firsthand.
When Sellers Can’t Sell: Accidental Landlords Surge in Markets Where Institutional Investors Are Most Exposed
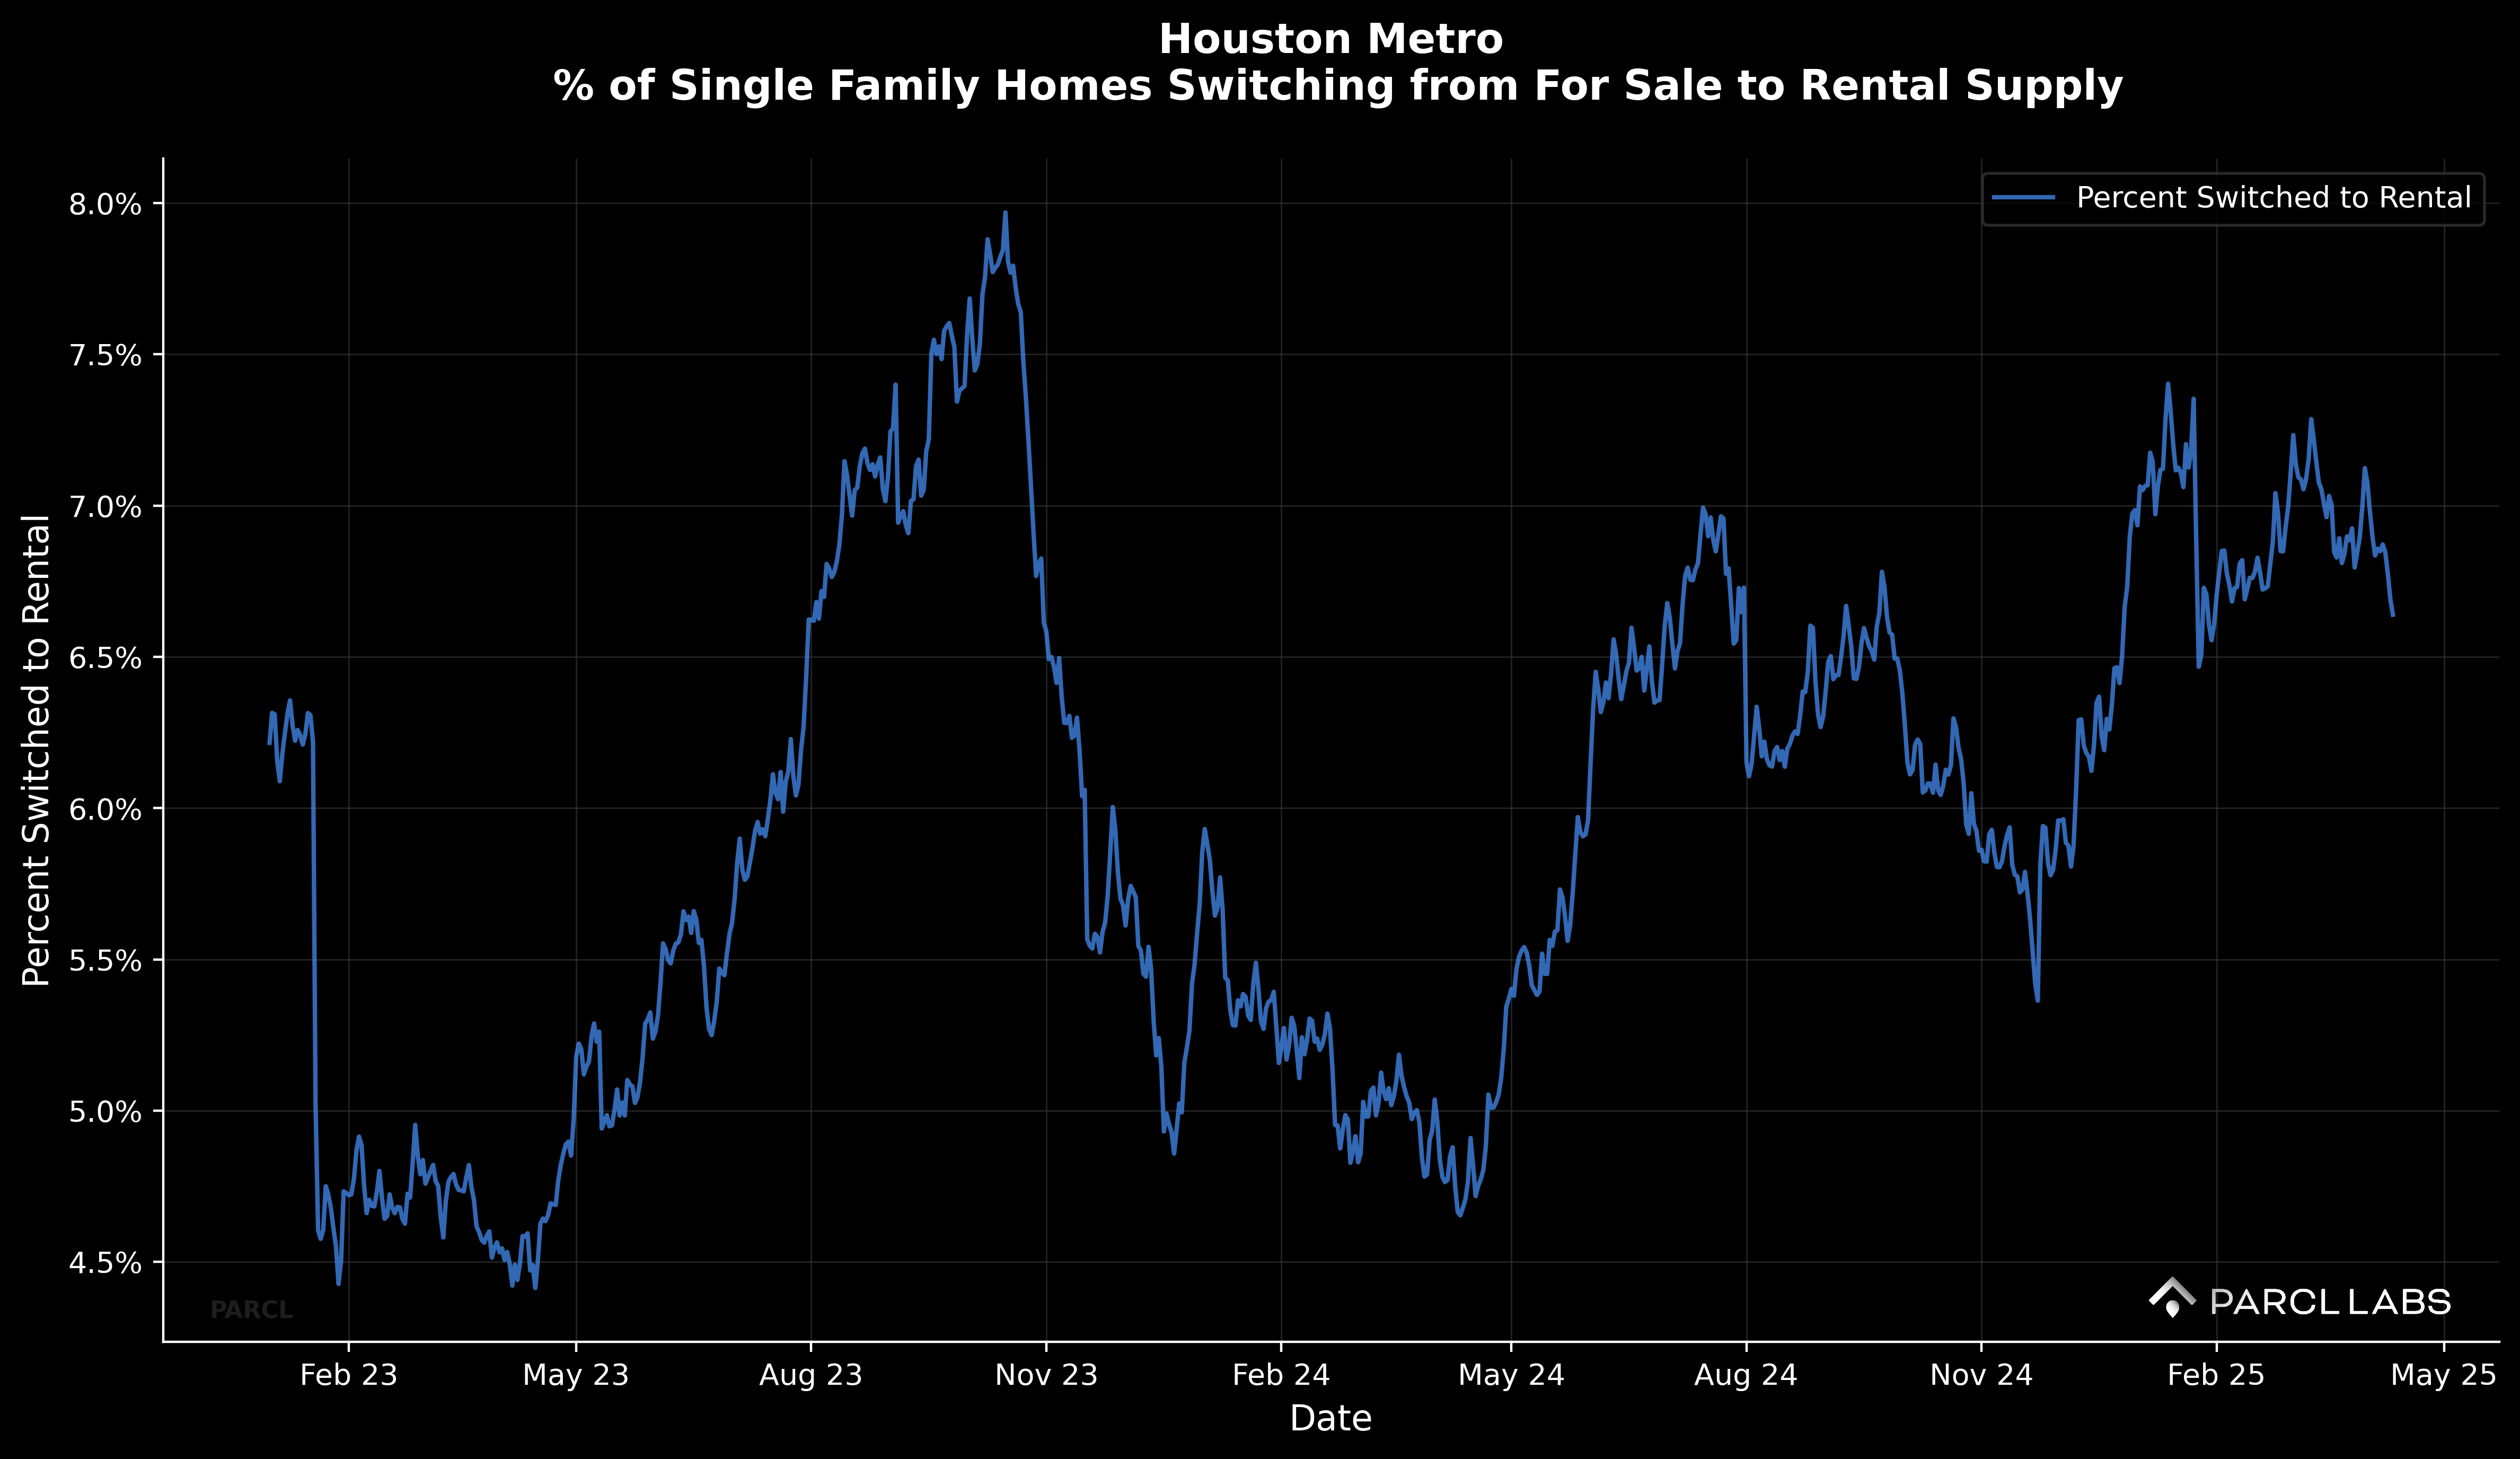
Sellers struggling to close deals are pivoting to the rental market, becoming accidental landlords. Our latest research identifies markets where this trend is accelerating - especially in Sunbelt regions that are both increasingly weak on the for-sale side and already dominated by Wall Street rental operators. See exactly where accidental landlords are surging and how major investors are responding.
Bullish Market Rankings
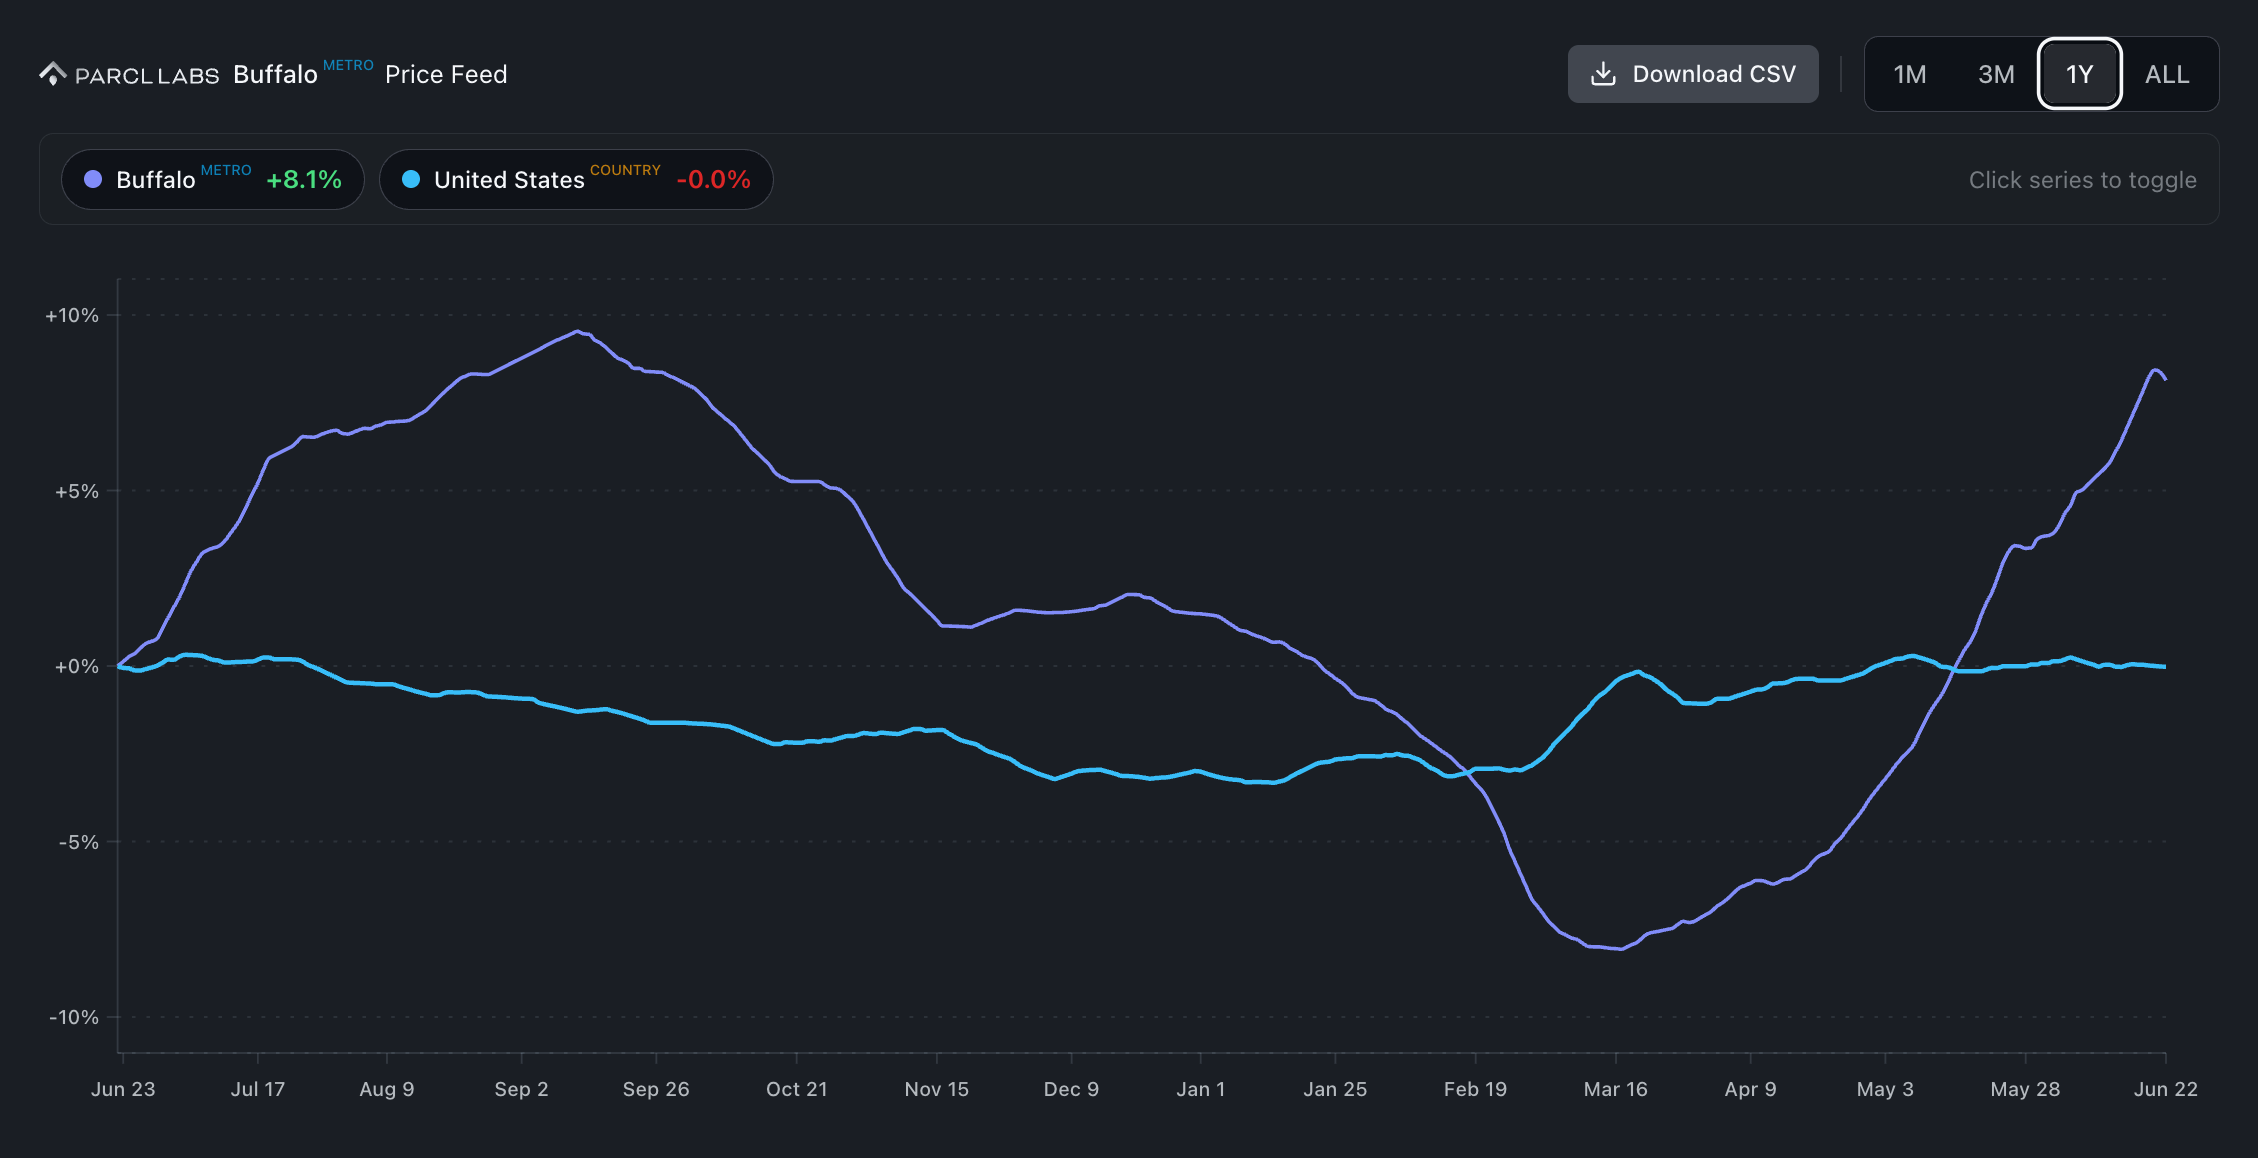
Sellers still have the upper hand in select markets. Our analysis ranks the Top 5 Most Bullish Markets, highlighting areas projected to outperform in home price growth over the next year. Buffalo, NY leads, followed closely by key coastal and Midwest metros. Discover which markets offer the highest-yield investment opportunities.
Take Your Housing Intelligence Experience to the Next Level
Here’s how our community is using Parcl Labs to get ahead. Join them:
1. Complete your profile and pin your markets.
Customize your experience, so the data you care about is always one click away.
2. Share and earn.
Everyone else sees and uses the same stale housing data. With Parcl Labs, you have real-time insights - and huge alpha. Share your edge with colleagues and friends, and earn credits toward premium features.
3. Subscribe.
Traditional housing research costs $50k+ per year - for lagged trends, static PDFs, survey results, and clunky dashboards. While everyone else is stuck paying a premium for backward-looking data, Parcl Labs Pro users have the most real-time analytics and exclusive, granular insights - for just $50/month. Subscribe now to join the Pros winning with Parcl Labs.

Follow Us for More