Buffalo: Despite Doubling, We Think the Bull Run Continues
Aug 18, 2026 · 10 min read
A Deep Dive Into Buffalo's Historic Rally

Buffalo, NY, is a city about 370 miles northwest of New York City, near the Canadian border. It’s a relatively small metro known for Buffalo wings and the Buffalo Bills Mafia. So it may be surprising that it’s also the hottest housing market in the country - by a mile.
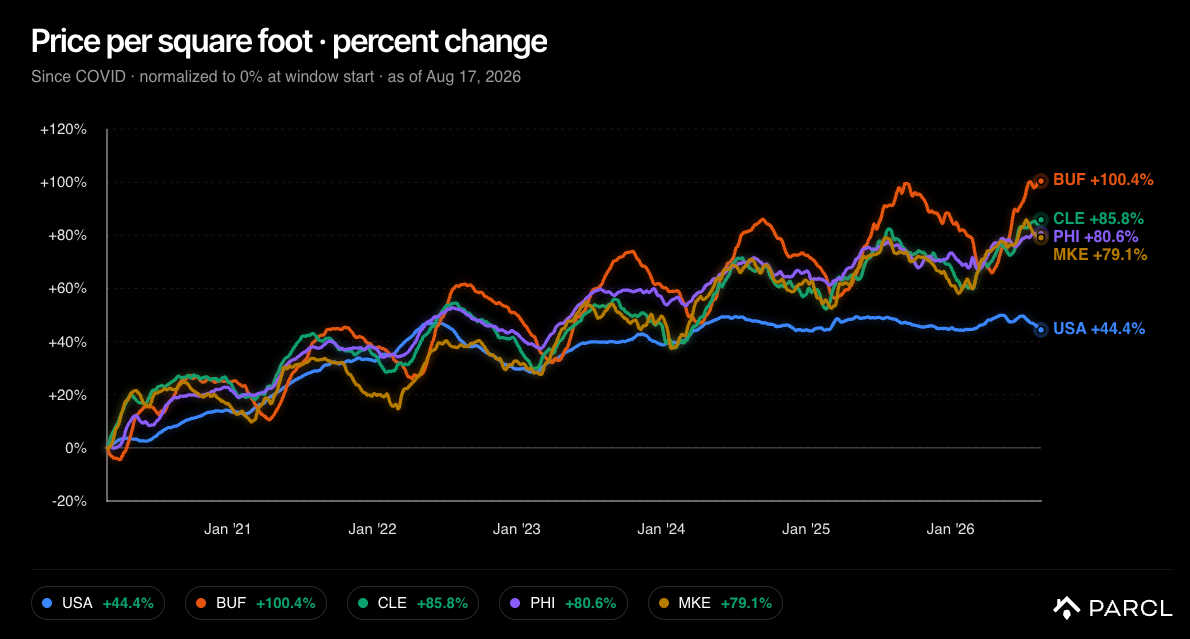
The Buffalo metro is up more than 100% since COVID - outpacing national price gains by nearly 60 percentage points. The next closest metros are up about 80%. See Chart 1 below for the top gainers since COVID.
To understand this strength and whether the bull market can continue, we are taking a deeper look into the data for Buffalo. To add some perspective from the ground, we spoke with Bo Gurney, Principal Broker of Gurney Becker & Bourne, Buffalo’s oldest real estate brokerage, about what he’s seeing across the market.
Chart 1. Price Trends of Top Performers vs. The National Benchmark - Buffalo +100%
Limited Supply Growth as Population Growth Resumes
Given the price momentum, it should not be surprising that supply is constrained - but why? A big part of the answer lies in Buffalo’s population history and the knock-on effects it had on homebuilding.
From 1970 through the mid-2010s, the region’s population declined meaningfully. That put pressure on housing prices and gave builders little incentive to add new inventory. For decades, Buffalo was essentially a forgotten housing market, with an abundance of supply and some of the cheapest homes in the country. Even after the recent rally, the median home price remains well below the national average.
Gurney put the dynamic into perspective in our discussion:
“For two generations we had more housing than households and some of the cheapest homes in America, and builders did what that math told them to do. They mostly stopped, and they never really ramped back up. Then the 2020 census showed this region growing for the first time in fifty years. When demand comes back to a housing stock that was sized for decline, prices catch up in a hurry. That's the doubling. I don't think it's a bubble. It's a fifty year discount coming off, and even now the typical home here costs more than a hundred thousand dollars less than the national median. None of that makes it easy on local buyers, especially people trying to buy their first home. We see it every week, and we don't take it lightly.”
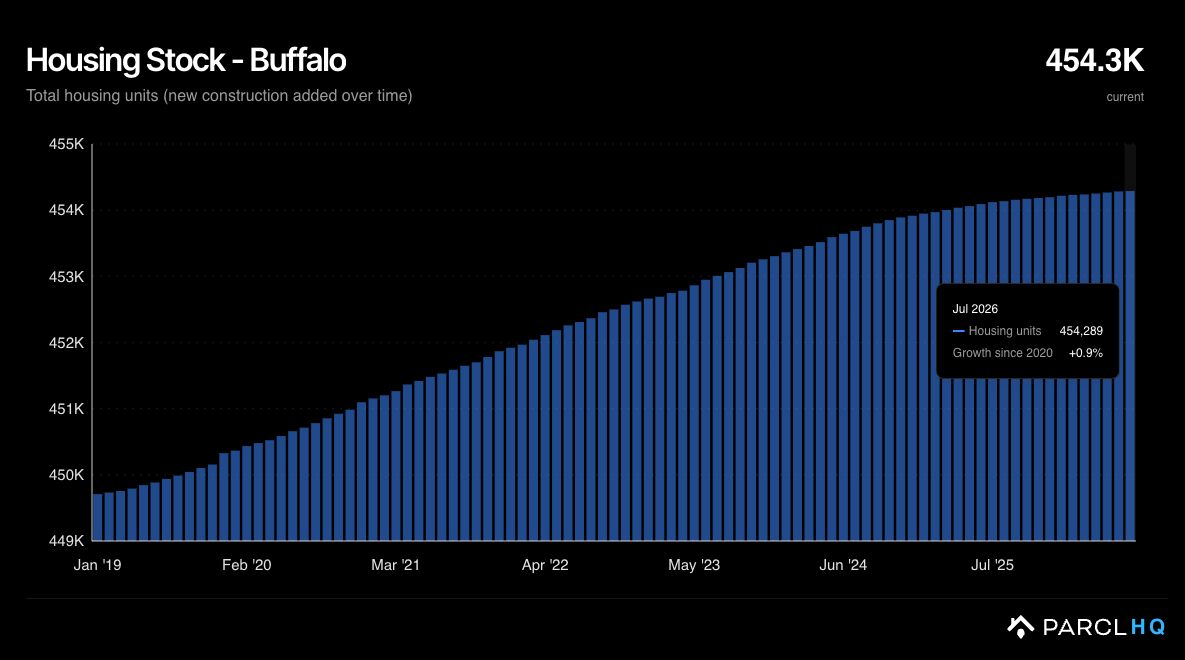
In short, the turning point for Buffalo came with a positive reversal in population growth confirmed by the 2020 census. While population growth has since leveled off, housing stock hasn't budged, leaving supply structurally undersized relative to demand. The result is upward pressure on prices. To this point we have seen less than 1% growth in housing stock since 2019.
Chart 2. Buffalo Housing Stock Over Time - Virtually No Growth
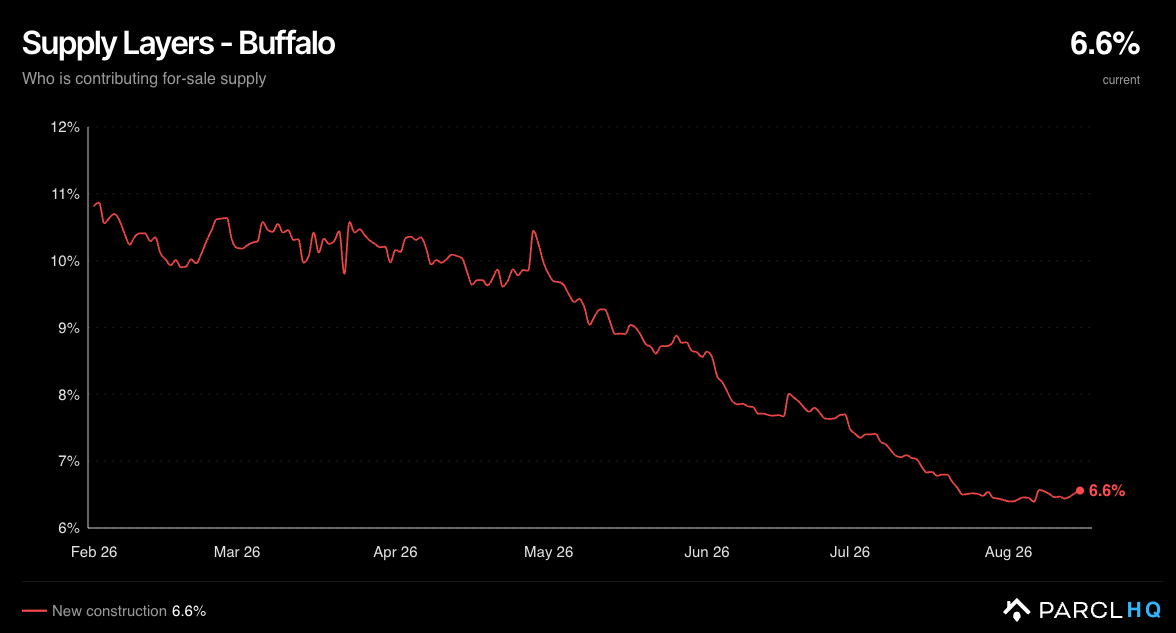
While there is some new construction, activity is limited and represents just 6.5% of for-sale supply, which in absolute terms is about 350 units.
Chart 3. New Construction as a % of For-Sale Supply Near Lows
Different Neighborhoods, Different Market Dynamics
The strength across Buffalo is broad, but it is not uniform. The Northtowns (Amherst, Clarence, Williamsville) are the tightest, with extremely limited inventory and intense bidding. The Southtowns (Hamburg, Orchard Park, East Aurora) are growing fastest and account for a disproportionate share of new construction, making them the region’s closest thing to a supply release valve - though inventory is still tight. The eastern suburbs (Cheektowaga, Lancaster) are the affordability battleground, where first-time buyers compete most aggressively.
Within the city, the recovery is moving outward in waves. Established neighborhoods like Elmwood Village and Allentown have matured, while bidding wars have shifted to North Buffalo, South Buffalo, and the West Side. The East Side is now beginning to participate as well, though it remains the least consistent part of the recovery.
The common thread across each of these submarkets is the same: demand remains strong relative to available supply, though intensity varies by neighborhood.
The Middle Market Remains the Most Competitive
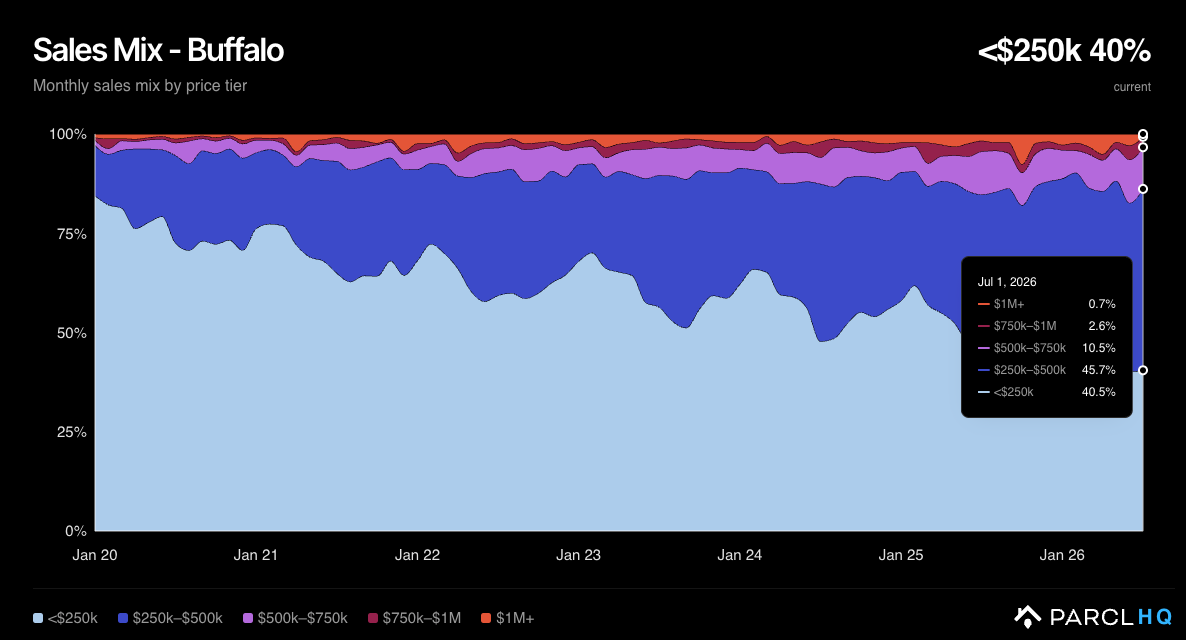
As with any market, pricing tells a story of its own, with very different dynamics across Buffalo’s various price bands. For context, the vast majority - roughly 85% - of homes sold are under $500K. Specifically, homes under $250K represent 40.5% of sales, while another 45.7% fall in the $250K-$500K range. At the other end of the spectrum, the $1M+ market is very small, accounting for less than 1% of sales.
Below, Gurney provides some color on what he’s seeing across the market at different price points.
Chart 4. Sales Mix by Price Stratification - Vast Majority of Sales are <500K
Anecdotally, the most aggressive bidding is happening in the mid-market range of $250K to $400K. Gurney weighs in:
“Under $250,000 you are mostly buying in the city neighborhoods where the recovery is still arriving, and when those homes sell, they sell over asking about half the time. From $250,000 to $400,000 is the hardest fight in Buffalo: three quarters of those homes go over asking, at a median of 8% over, so a house listed at $350,000 is really a $380,000 house. Above $600,000 the premiums start to shrink and the buyer finally gets a say.
The million dollar market here is growing but still small and specific. Fewer than a hundred homes a year close above a million dollars in Erie and Niagara counties, most of them in Clarence, Amherst, Orchard Park, East Aurora, and the city's Delaware District, where the grand old homes sell faster than anything else at that price. At that level the market is really judging condition, because renovation costs are still high. Buyers up there are more deliberate than they were a year ago. A finished home priced on its true comps still draws offers quickly, six in ten went under contract inside two weeks this past year at or above full price, while homes that need work sit and take cuts. The sellers who win up there are the ones who prepare for it.”
In short, based on this commentary, the $250K-$500K market is clearly the sweet spot for sellers, while buyers have modestly more leverage both up and down the price stack.
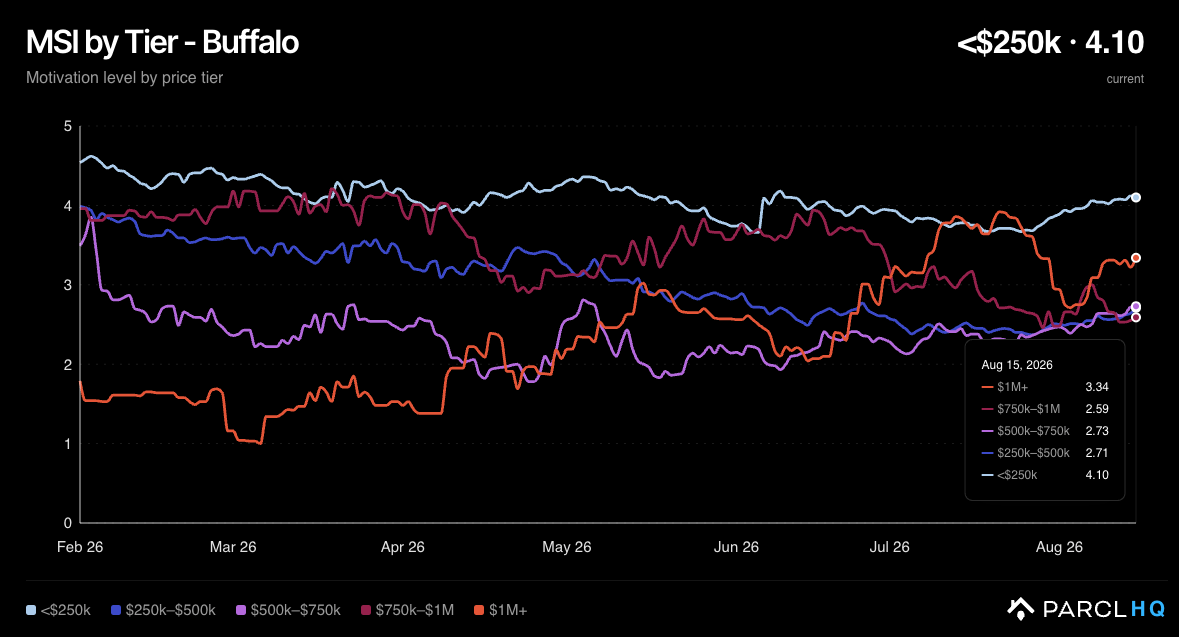
These trends are confirmed in our data. Chart 5 below visualizes the Parcl Motivated Seller Index (MSI) across varying price bands. The Parcl MSI encapsulates days on market, the number of price cuts, and the severity of those cuts. The $250K-$500K band has the lowest MSI at 2.71, while the <$250K cohort has the highest at 4.1. It’s important to note that the national MSI benchmark is 5.45, so despite the variance across Buffalo’s price strata, every segment remains comfortably below the national benchmark - suggesting a tight, seller-tilted market across the board.
Chart 5. Parcl Motivated Seller Index (MSI) by Price Band - $250K-$500K Is a Seller’s Market
Healthy Fundamentals Support Further Price Appreciation but Some Signals to Monitor
Despite doubling over the last six years, we think Buffalo’s fundamentals support further growth. The spring selling season has been particularly strong, with the Buffalo market up 14%, leading all major markets in our coverage universe - the next closest being Cleveland at +7%. This surge suggests pricing has yet to fully catch up to demand.
We would note, however, that there are some pricing, supply/demand, and macro dynamics worth monitoring. If they persist, Buffalo’s rally could stall.
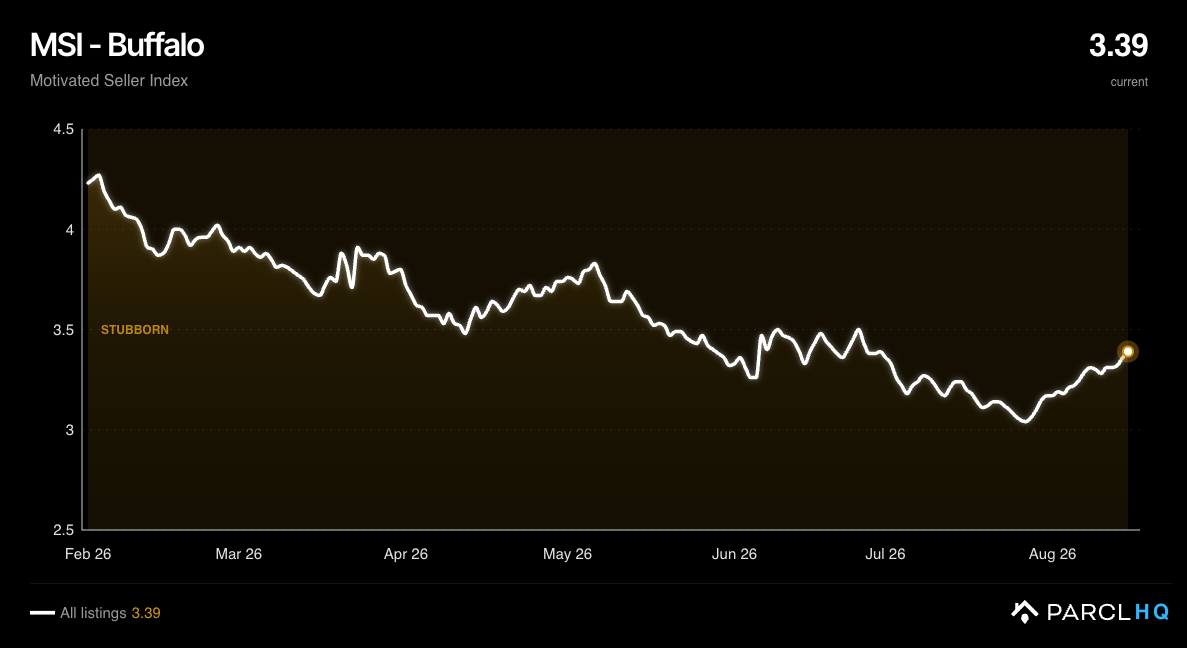
First, we are seeing some uptick in MSI and price cuts. We do believe it is seasonal - and it still points to very stubborn sellers in aggregate. Buffalo is a very seasonal market given its frigid winters. While MSI is creeping up marginally, we think that is largely because sellers who have not sold are looking to clear inventory at the tail end of the buying season.
Chart 6. Buffalo Aggregate MSI Moving Modestly Higher
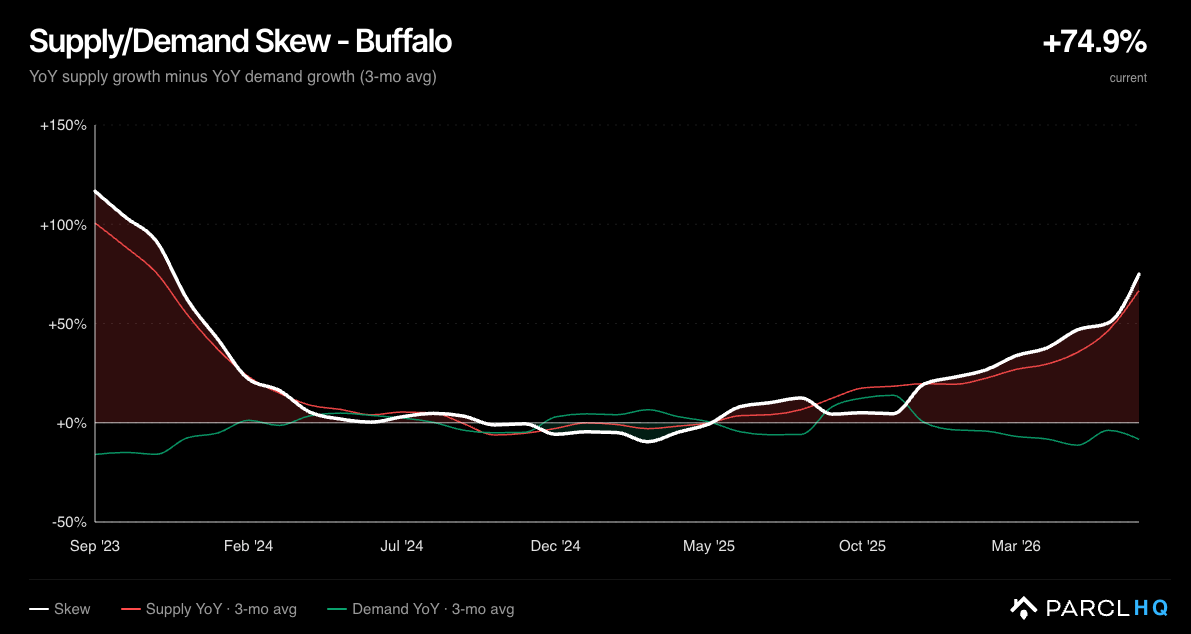
Second, we’ve continued to see supply growth accelerate relative to demand. While this is potentially a forward indicator of weakness, the trend has been moving higher all year. The strong three-month price appreciation leads us to believe that this increase in supply has yet to impact the market at large and is likely a function of homeowners selling into strength. For now, the additional supply is being absorbed without issue, but this metric bears watching.
Chart 7. Supply/Demand Skew Has Been Moving Higher
The pricing and supply/demand backdrop presented above still appears benign, at least for now. The uptick in MSI and price cuts can largely be explained by seasonality, while the increase in supply relative to demand has yet to have a meaningful impact on the underlying market.
Lastly, the macro backdrop in Buffalo seems softer relative to last year, and employment has flattened. This comes at a time when mortgage rates and home prices are near local highs, which can create demand destruction. These pressures haven't yet dented the market, but the economy is the variable most likely to determine whether the rally holds. We have yet to see any of these pressures show up in our data and continue to believe Buffalo's strength is more related to a supply-constrained environment than an economic boom.
That is ultimately the crux of our view. Buffalo has already experienced significant appreciation, but the fundamental imbalance that drove it has not been resolved - there has been effectively zero new housing growth despite obvious demand, and builder supply remains very small. Until meaningful new supply comes online, particularly in the middle of the market where pricing remains most aligned with local wages and demographics, we believe the bull run has room to continue.
Gurney remains cautiously optimistic:
“People ask us whether Buffalo can keep this up, and the honest answer is that this market runs on scarcity, not on a boom. Our population is holding steady, not surging. Employment has flattened this year, our manufacturers and the border economy are feeling the strain with Canada, and with rates in the mid sixes, a market where prices have doubled is asking a lot of the local paycheck. But the force underneath it all is the simplest one in economics. We barely built for two generations, and the little that gets built today starts around half a million dollars, so little relief is coming in the middle of the market where the fight is fiercest. That doesn't change if rates stay high or the economy stays soft. So what I see is not a market about to give anything back, and not one running away from people either. Sellers are pricing to real numbers, buyers know what things are worth, and while the pace has eased a touch from the spring frenzy, a well prepared home in almost any neighborhood here still draws multiple offers in its first week.”
Author

Follow Us for More