Rental Analytics Live in Parcl HQ: SFR Supply, Accidental Landlords, Motivated Rental Intelligence, and More
Aug 12, 2026 · 9 min read
See what the new rental metrics measure, the questions they answer, and how to access them in Parcl HQ.

Parcl HQ, our research interface for housing market analysis, continues to add real-time analytics. In recent weeks, we shipped home price movements, seller motivation and supply indicators, and financing insights. This release adds rental analytics.
Our initial rental coverage includes six unique insights on single-family rentals:
Rental inventory: The total number of active single-family rental listings on the market.
Motivated Rental Index (MRI): A score from 0 to 10 that measures how urgently landlords in a market cut rents to lease their units.
Accidental landlords: Active rental listings whose owners tried to sell the homes, could not find buyers, and then listed them for rent.
Double dipping: Active rental listings for homes that are also for sale at the same time.
Algorithmic pricing: Active rental listings with repricing patterns that match automated pricing systems.
Property manager intelligence: The number of property management companies in a market and the share of active rentals under management by the ten largest companies.
As with all HQ metrics, we update these datapoints daily and make them available for every market in the country, from major metros to individual ZIP codes.
to get started and keeping reading to learn what we built, why, and how you can use it to get ahead.
Rental Inventory Puts a Daily Number on SFR Supply
Why we built it: No single source fully captures rental supply across the US. The SFR market is especially opaque because its supply comes from a scattered mix of owners and operators using many different platforms to advertise their units. Some of our most sophisticated clients come to us because they struggle to answer a basic question: How many rental listings compete with theirs in a given market?
What it measures: HQ counts active, on-market single-family rental listings each day. The rental supply metric quantifies SFR supply within any market in the US.
Example: Kansas City is adding SFR supply right now. Active listings have climbed steadily since early July.
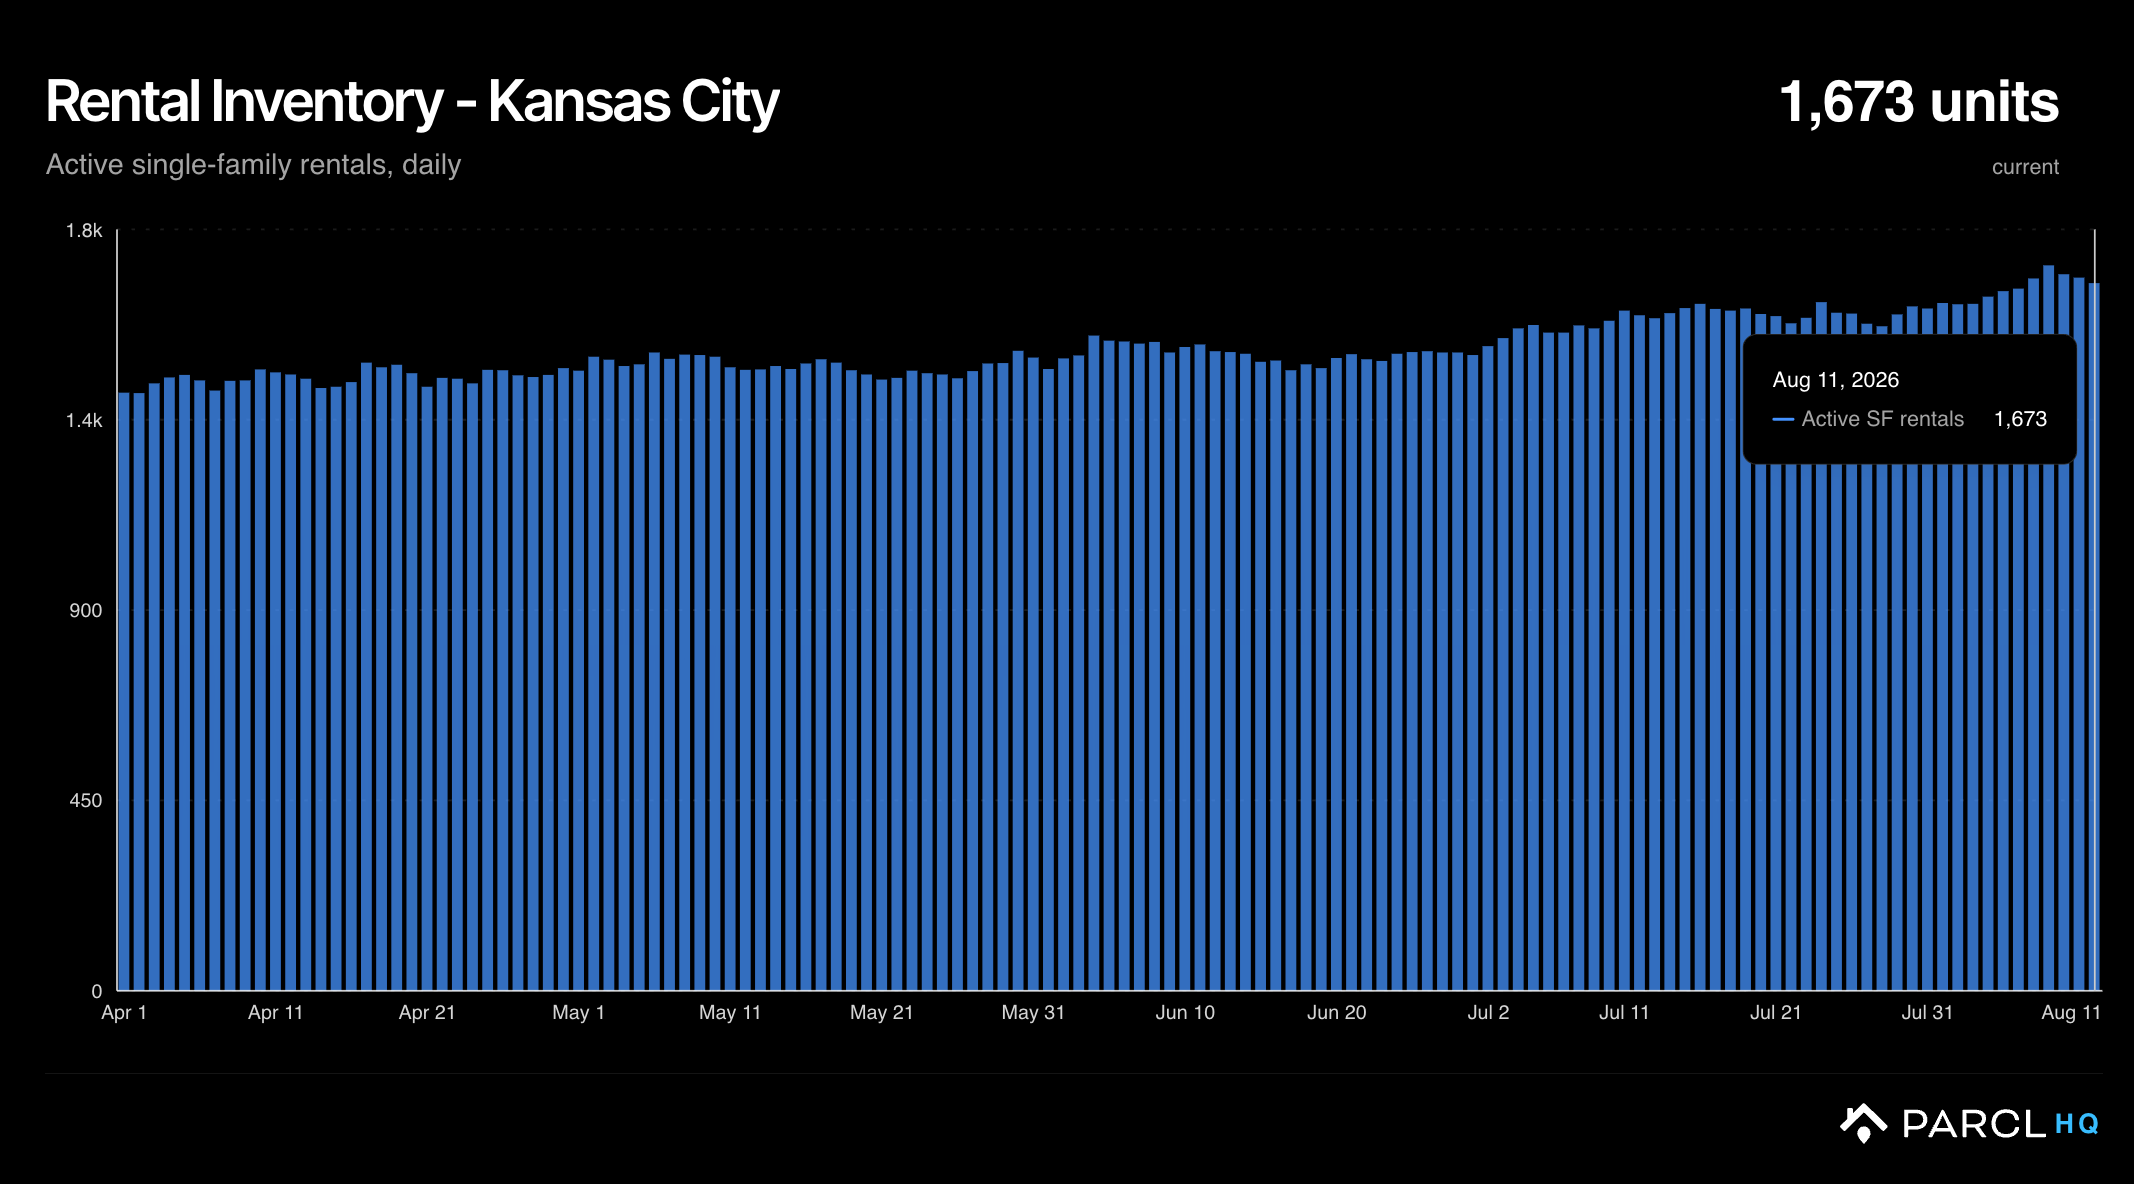
How to use it: Understand the scale and trend of rental supply, nationally and by market. If you operate in the SFR space, use it to assess competitive supply pressure.
The Motivated Rental Index Scores Landlord Urgency
Why we built it: The Motivated Seller Index (live map) is one of the platform's most-used signals. Teams use it every day to track supply pressure in the for-sale market and find deals. The Motivated Rental Index brings that same view to rentals through a model that is calibrated to rental market dynamics.
What it measures: MRI scores each market from 0 to 10. Two factors determine the score: cut depth and cut breadth. Cut depth measures how far a unit's net rent falls below its initial asking rent after the unit exceeds the normal lease-up period. Cut breadth measures how common rent cuts are among units that have exceeded that period. A unit without a rent cut does not contribute to the score. HQ groups market scores into bands from neutral (0-2.5) to "desperate to lease" (7.5-10).
Example: Florida's SFR market is under pressure right now. Gulf Coast counties cluster in the "desperate to lease" band, and the statewide MRI score is above the national reading.
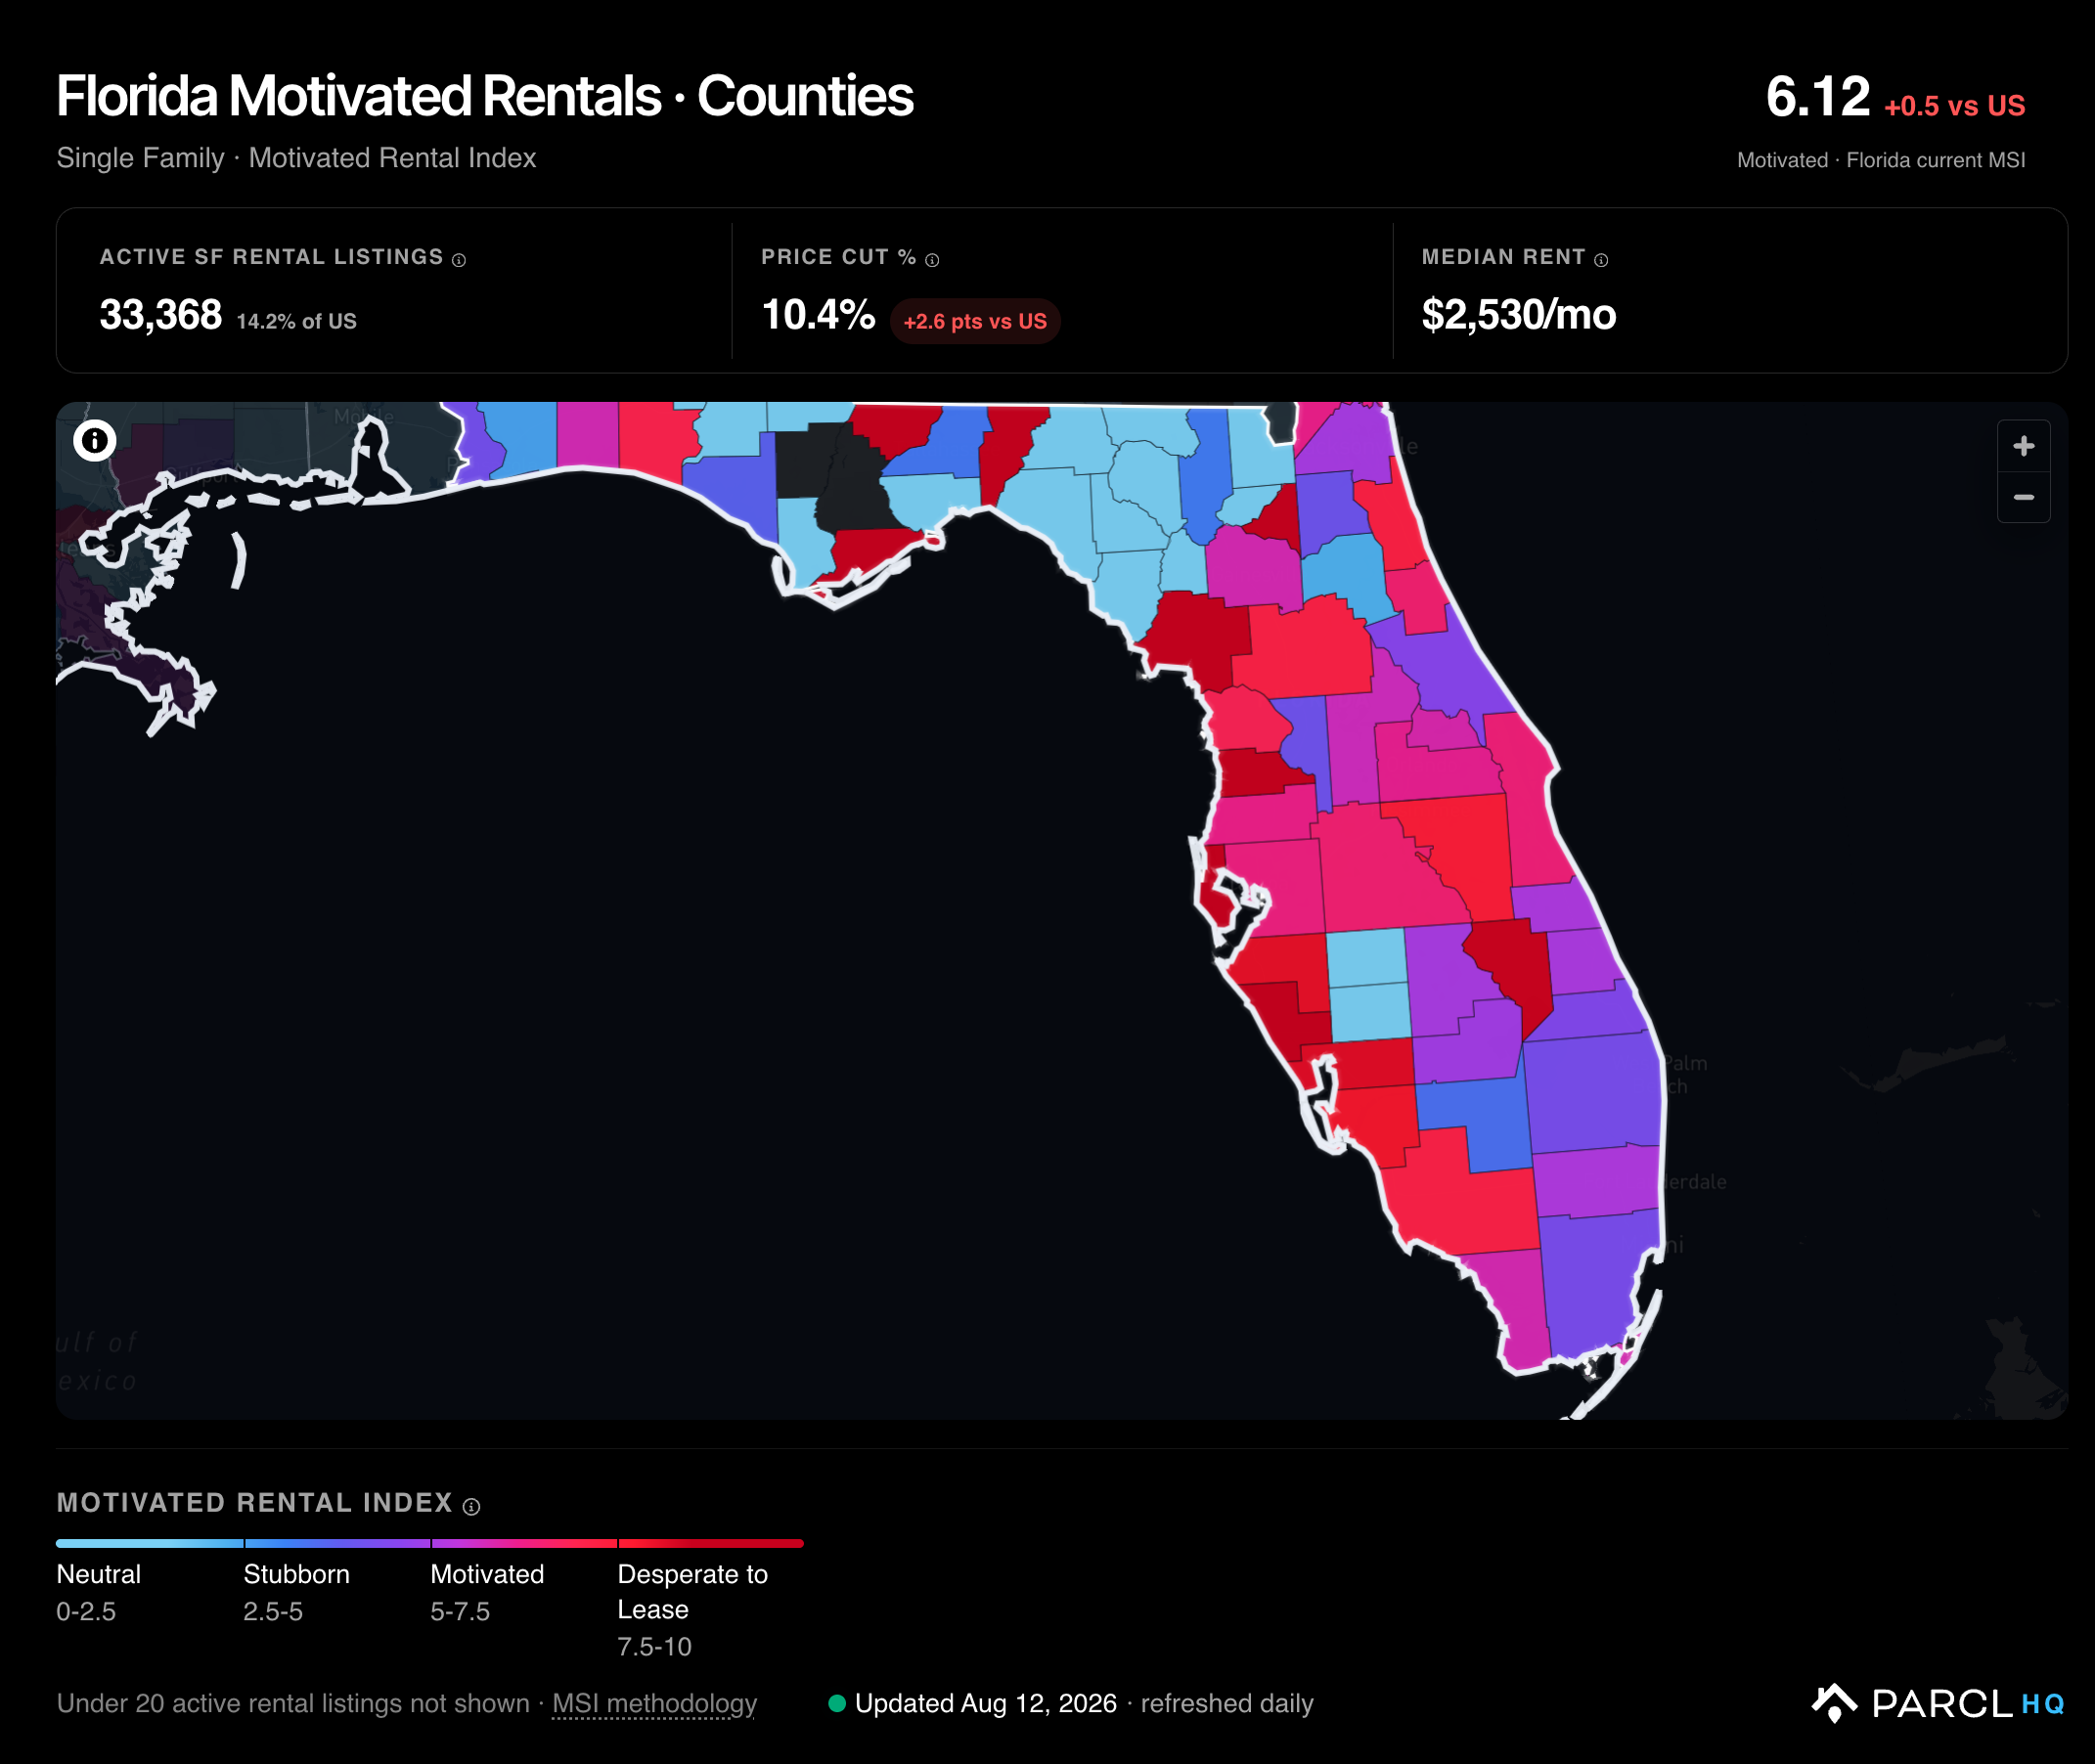
How to use it: See which rental markets face pressure and where landlords hold leverage. If you set rents, use MRI to guide your pricing strategy in real time.
Accidental Landlords Reveal Shadow Supply
Why we built it: Parcl was the first to quantify accidental landlords: owners who tried to sell a home, couldn't, and then listed it for rent (original research). Our original accidental landlord work produced one of our most sought-after data points and featured in CNBC, the Wall Street Journal, the New York Times, Business Insider, and many other outlets. Analysts have also raised it on earnings calls with some of the largest institutional REITs, such as Invitation Homes, to assess how shadow supply affects their operations.
Our previous accidental landlord analyses covered select markets at a single point in time. HQ now updates accidental landlord data daily for every US market.
What it measures: The share of active single-family rentals in a market whose owner listed the home for sale within the 90 days before the rental listing began. We provide both the current share and a historical series. The series shows how accidental landlord activity changes over time within any market.
Example: Accidental landlords are a national phenomenon, with the highest shares concentrated across the Sun Belt. In Denver, accidental landlord share has roughly doubled since April.
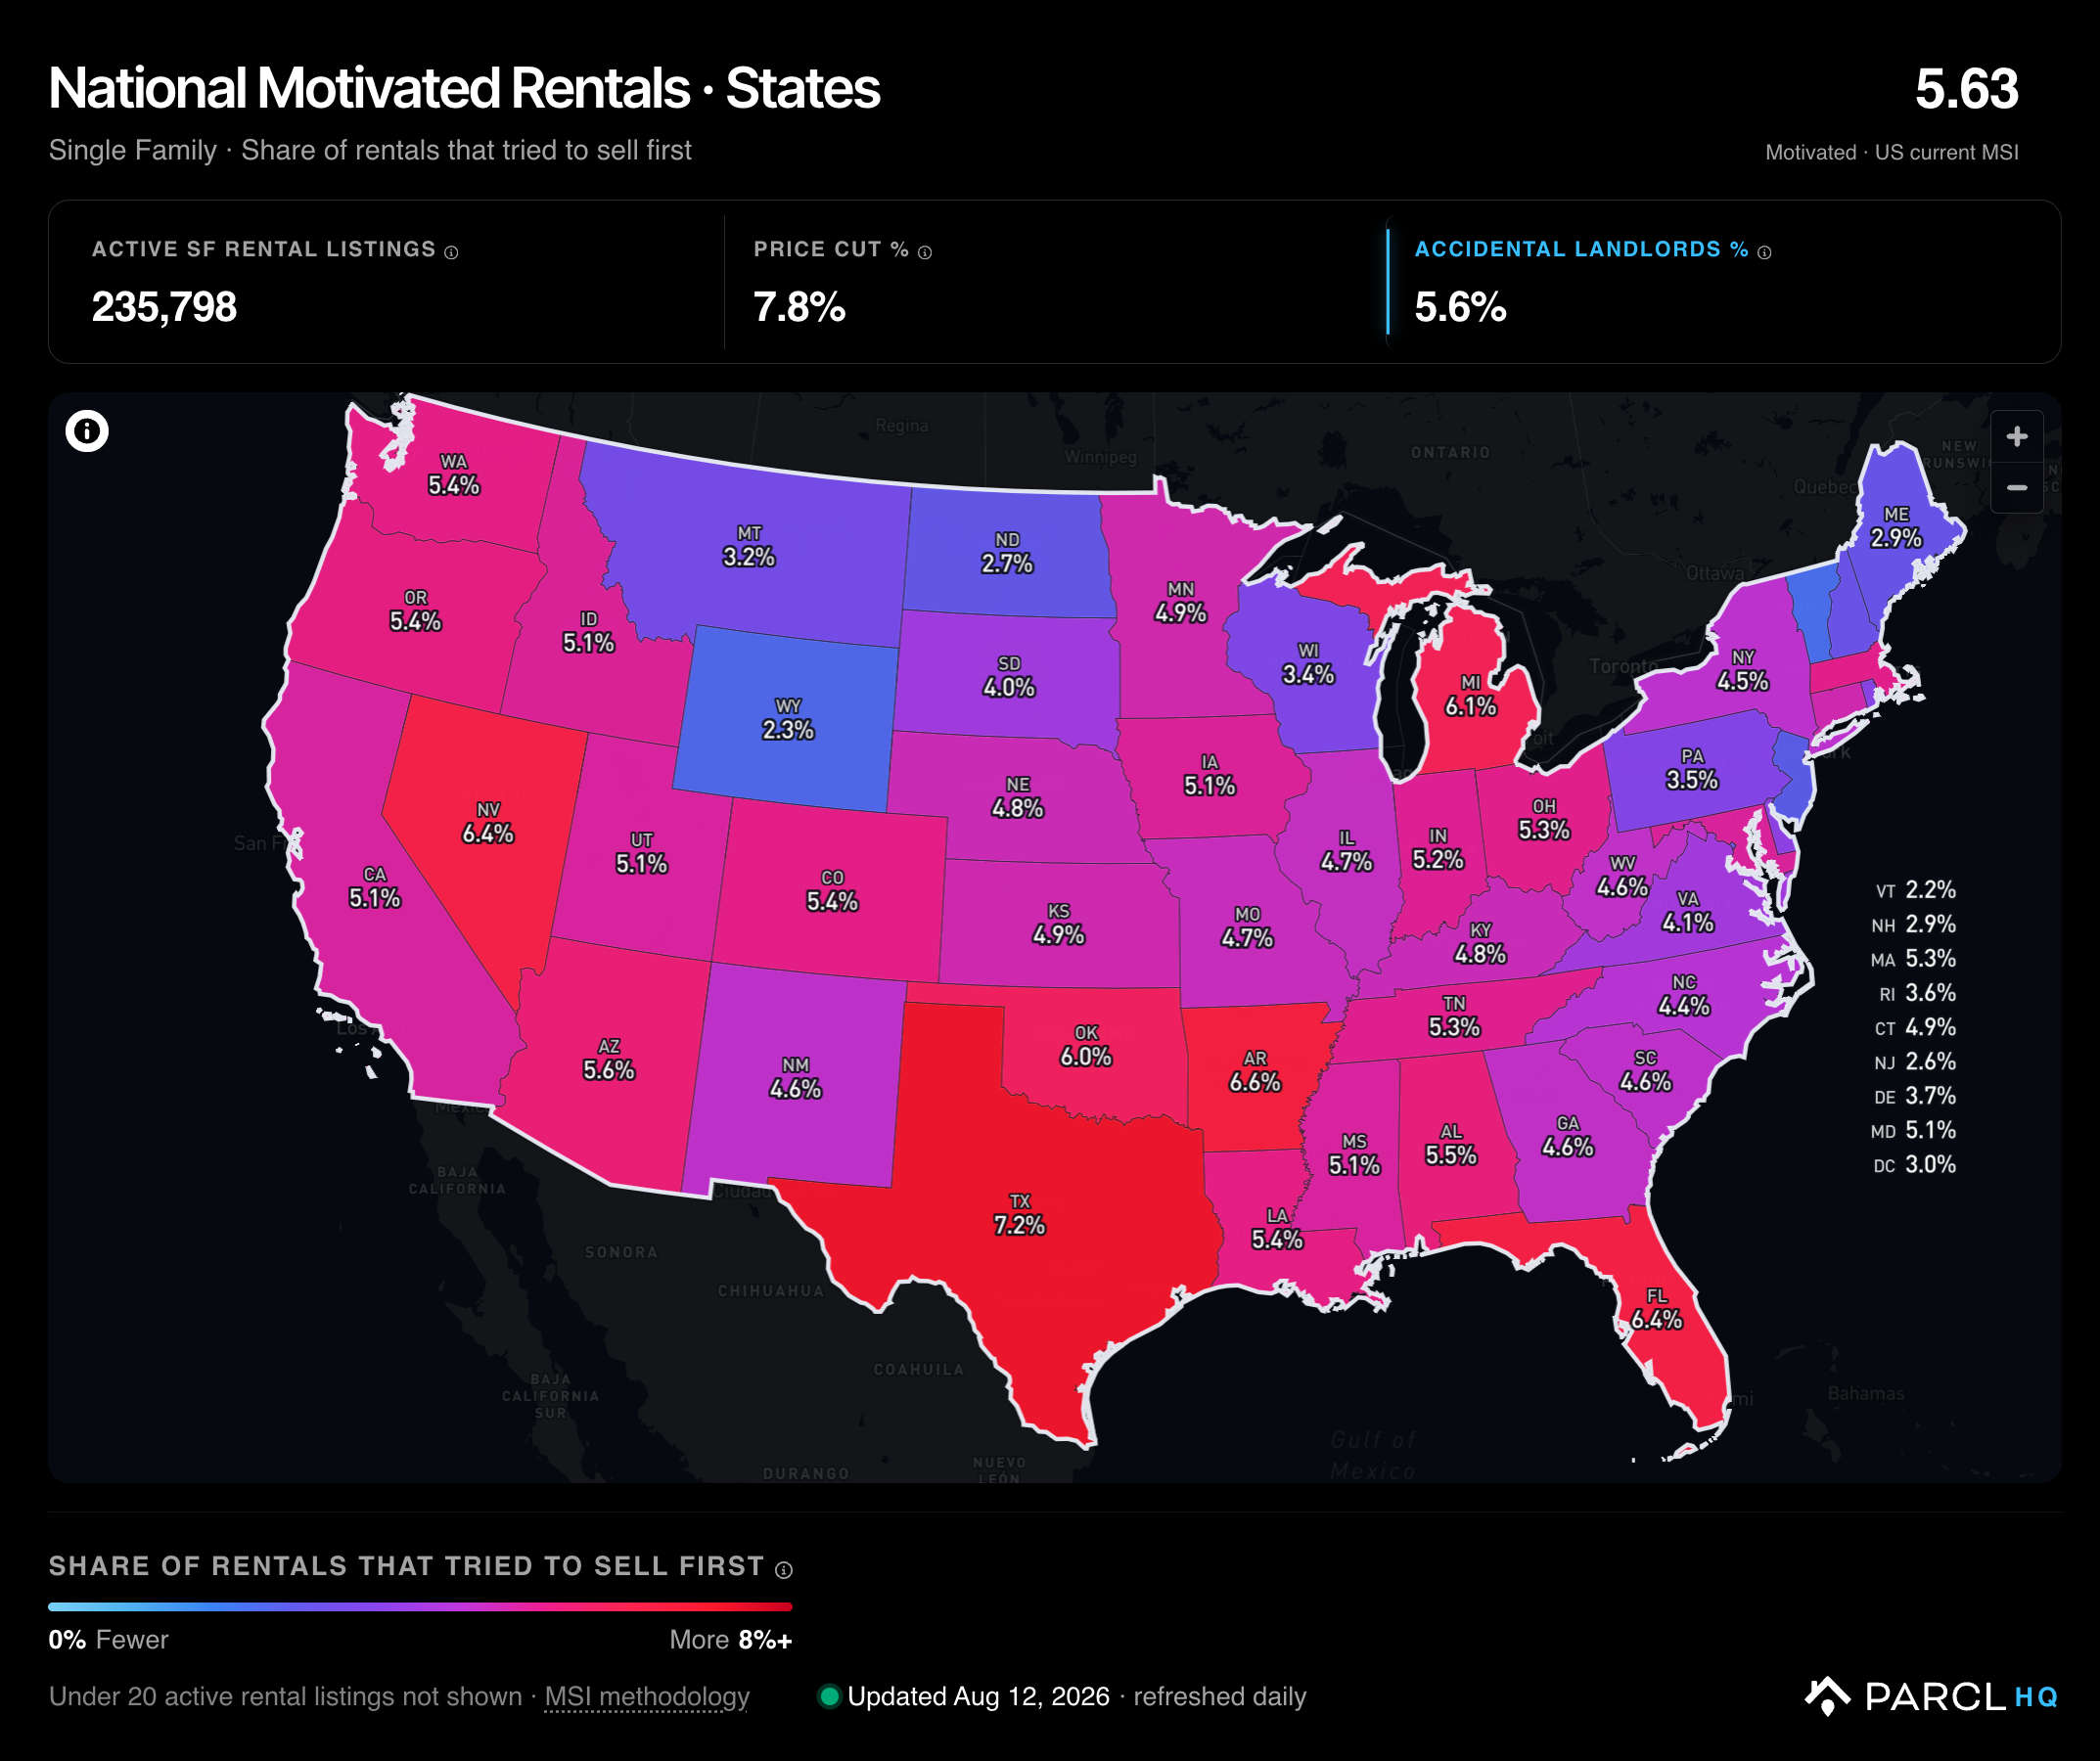
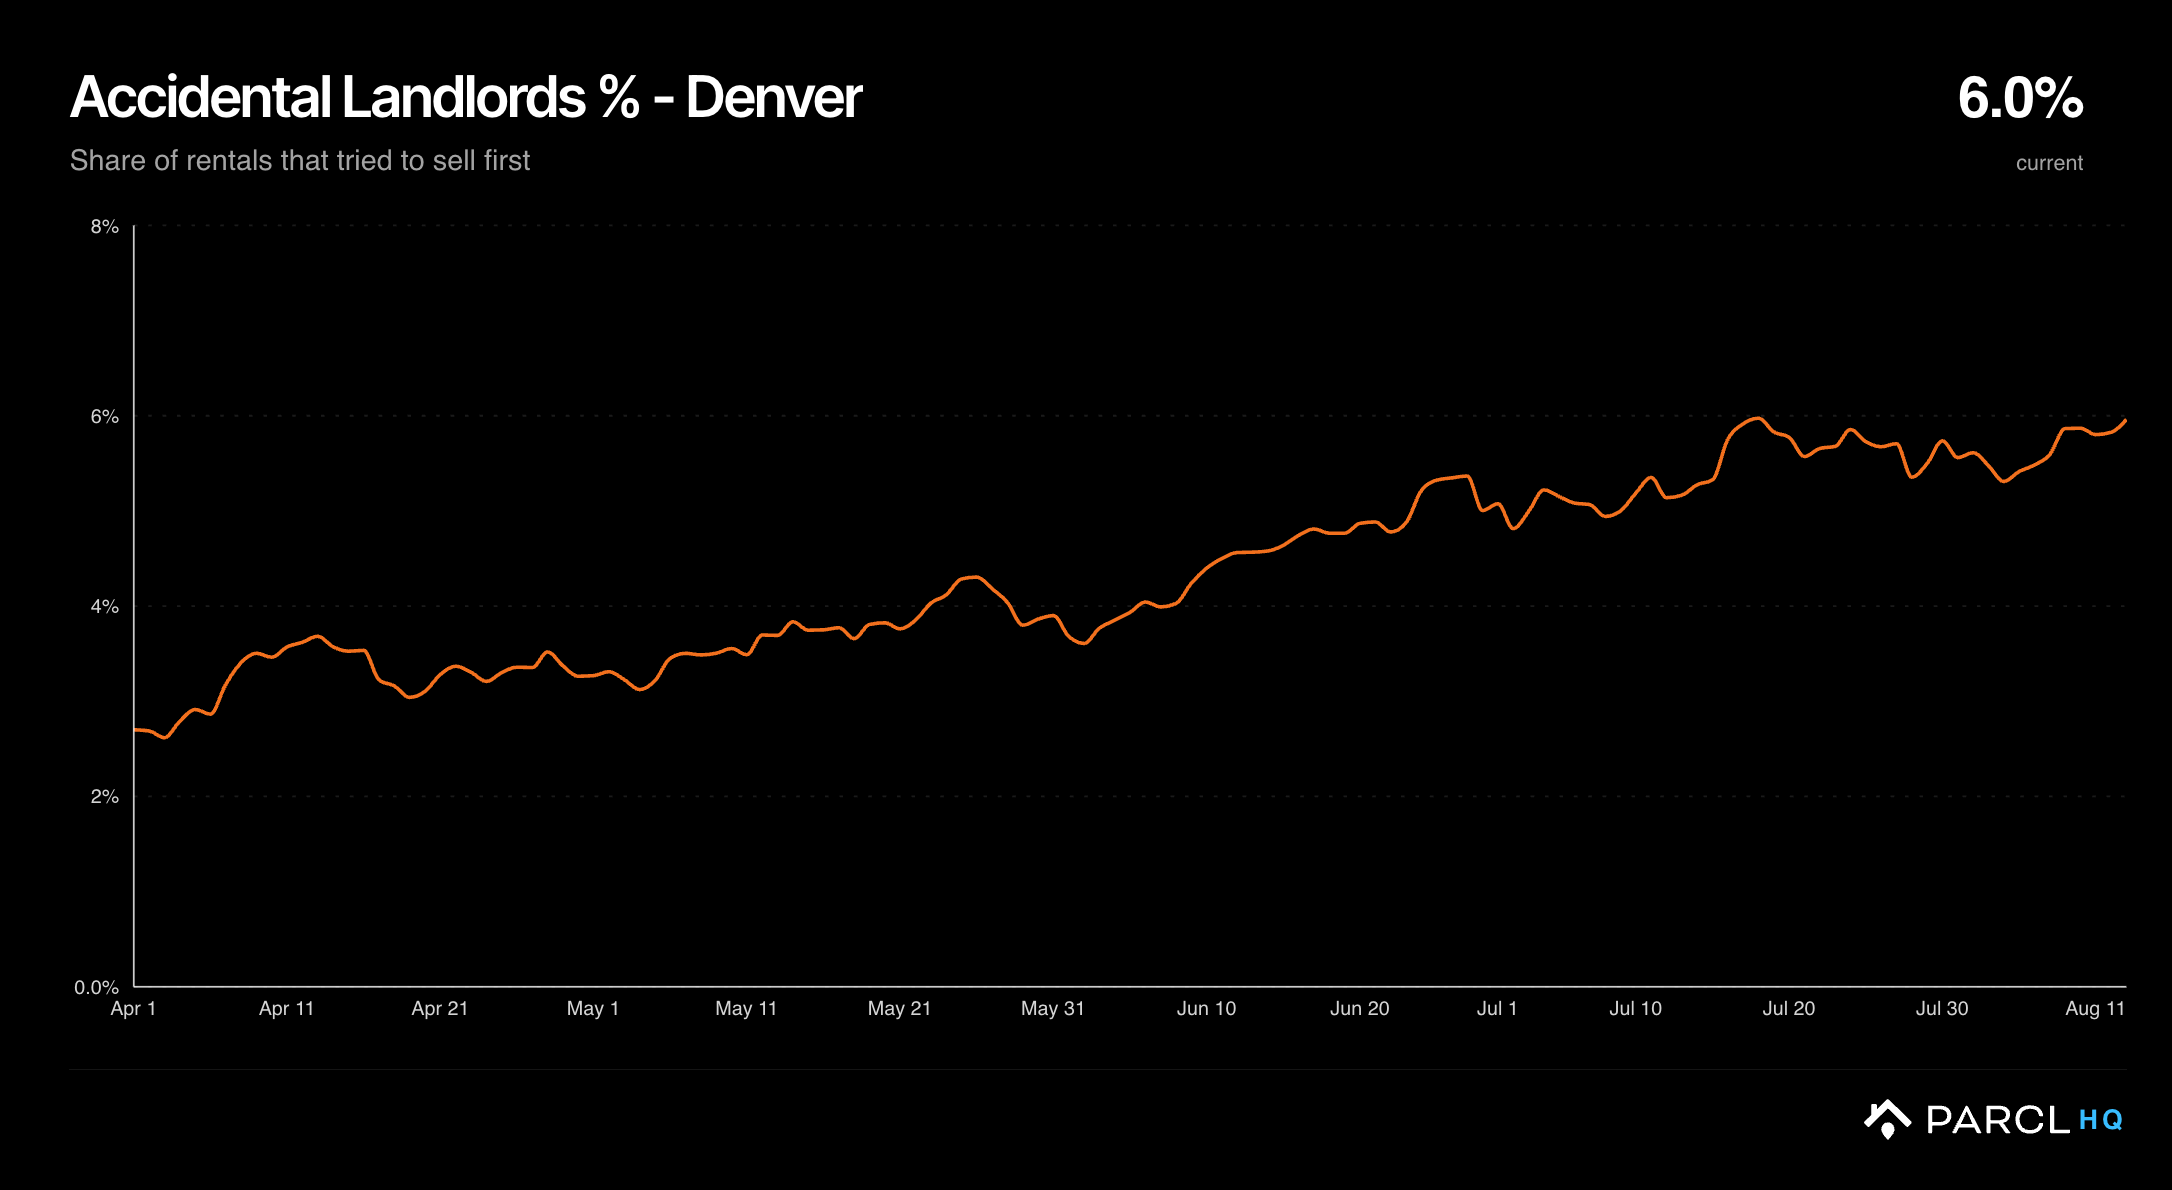
How to use it: Track accidental landlord supply as it enters your markets. If you serve accidental landlords through property management, tax services, insurance, or investment tools, use the metric to guide market strategy and generate leads. Real estate agents and investors can also use accidental landlords as leads, as these owners have already signaled that they may sell under the right conditions.
Double Dipping Finds Owners Testing Both Selling and Renting Strategies
Why we built it: At Parcl, we constantly review our data for unusual patterns to ensure data quality and uncover new market trends and strategies. We recently identified an uptick in a behavior we call "double dipping": owners who list the same home for sale and rent at the same time.
Double dipping is a new metric that complements our accidental landlord data. Accidental landlords list a property for rent after they first try to sell it. Double dipping identifies owners who pursue both options at once: they list the same property for sale and rent at the same time.
What it measures: The share of a market's active single-family rental listings that are also active for sale on the same day.
Example: Texas currently records the highest double-dip share of any state, roughly twice the national rate. The pattern is strongest across the Gulf (Houston) region.
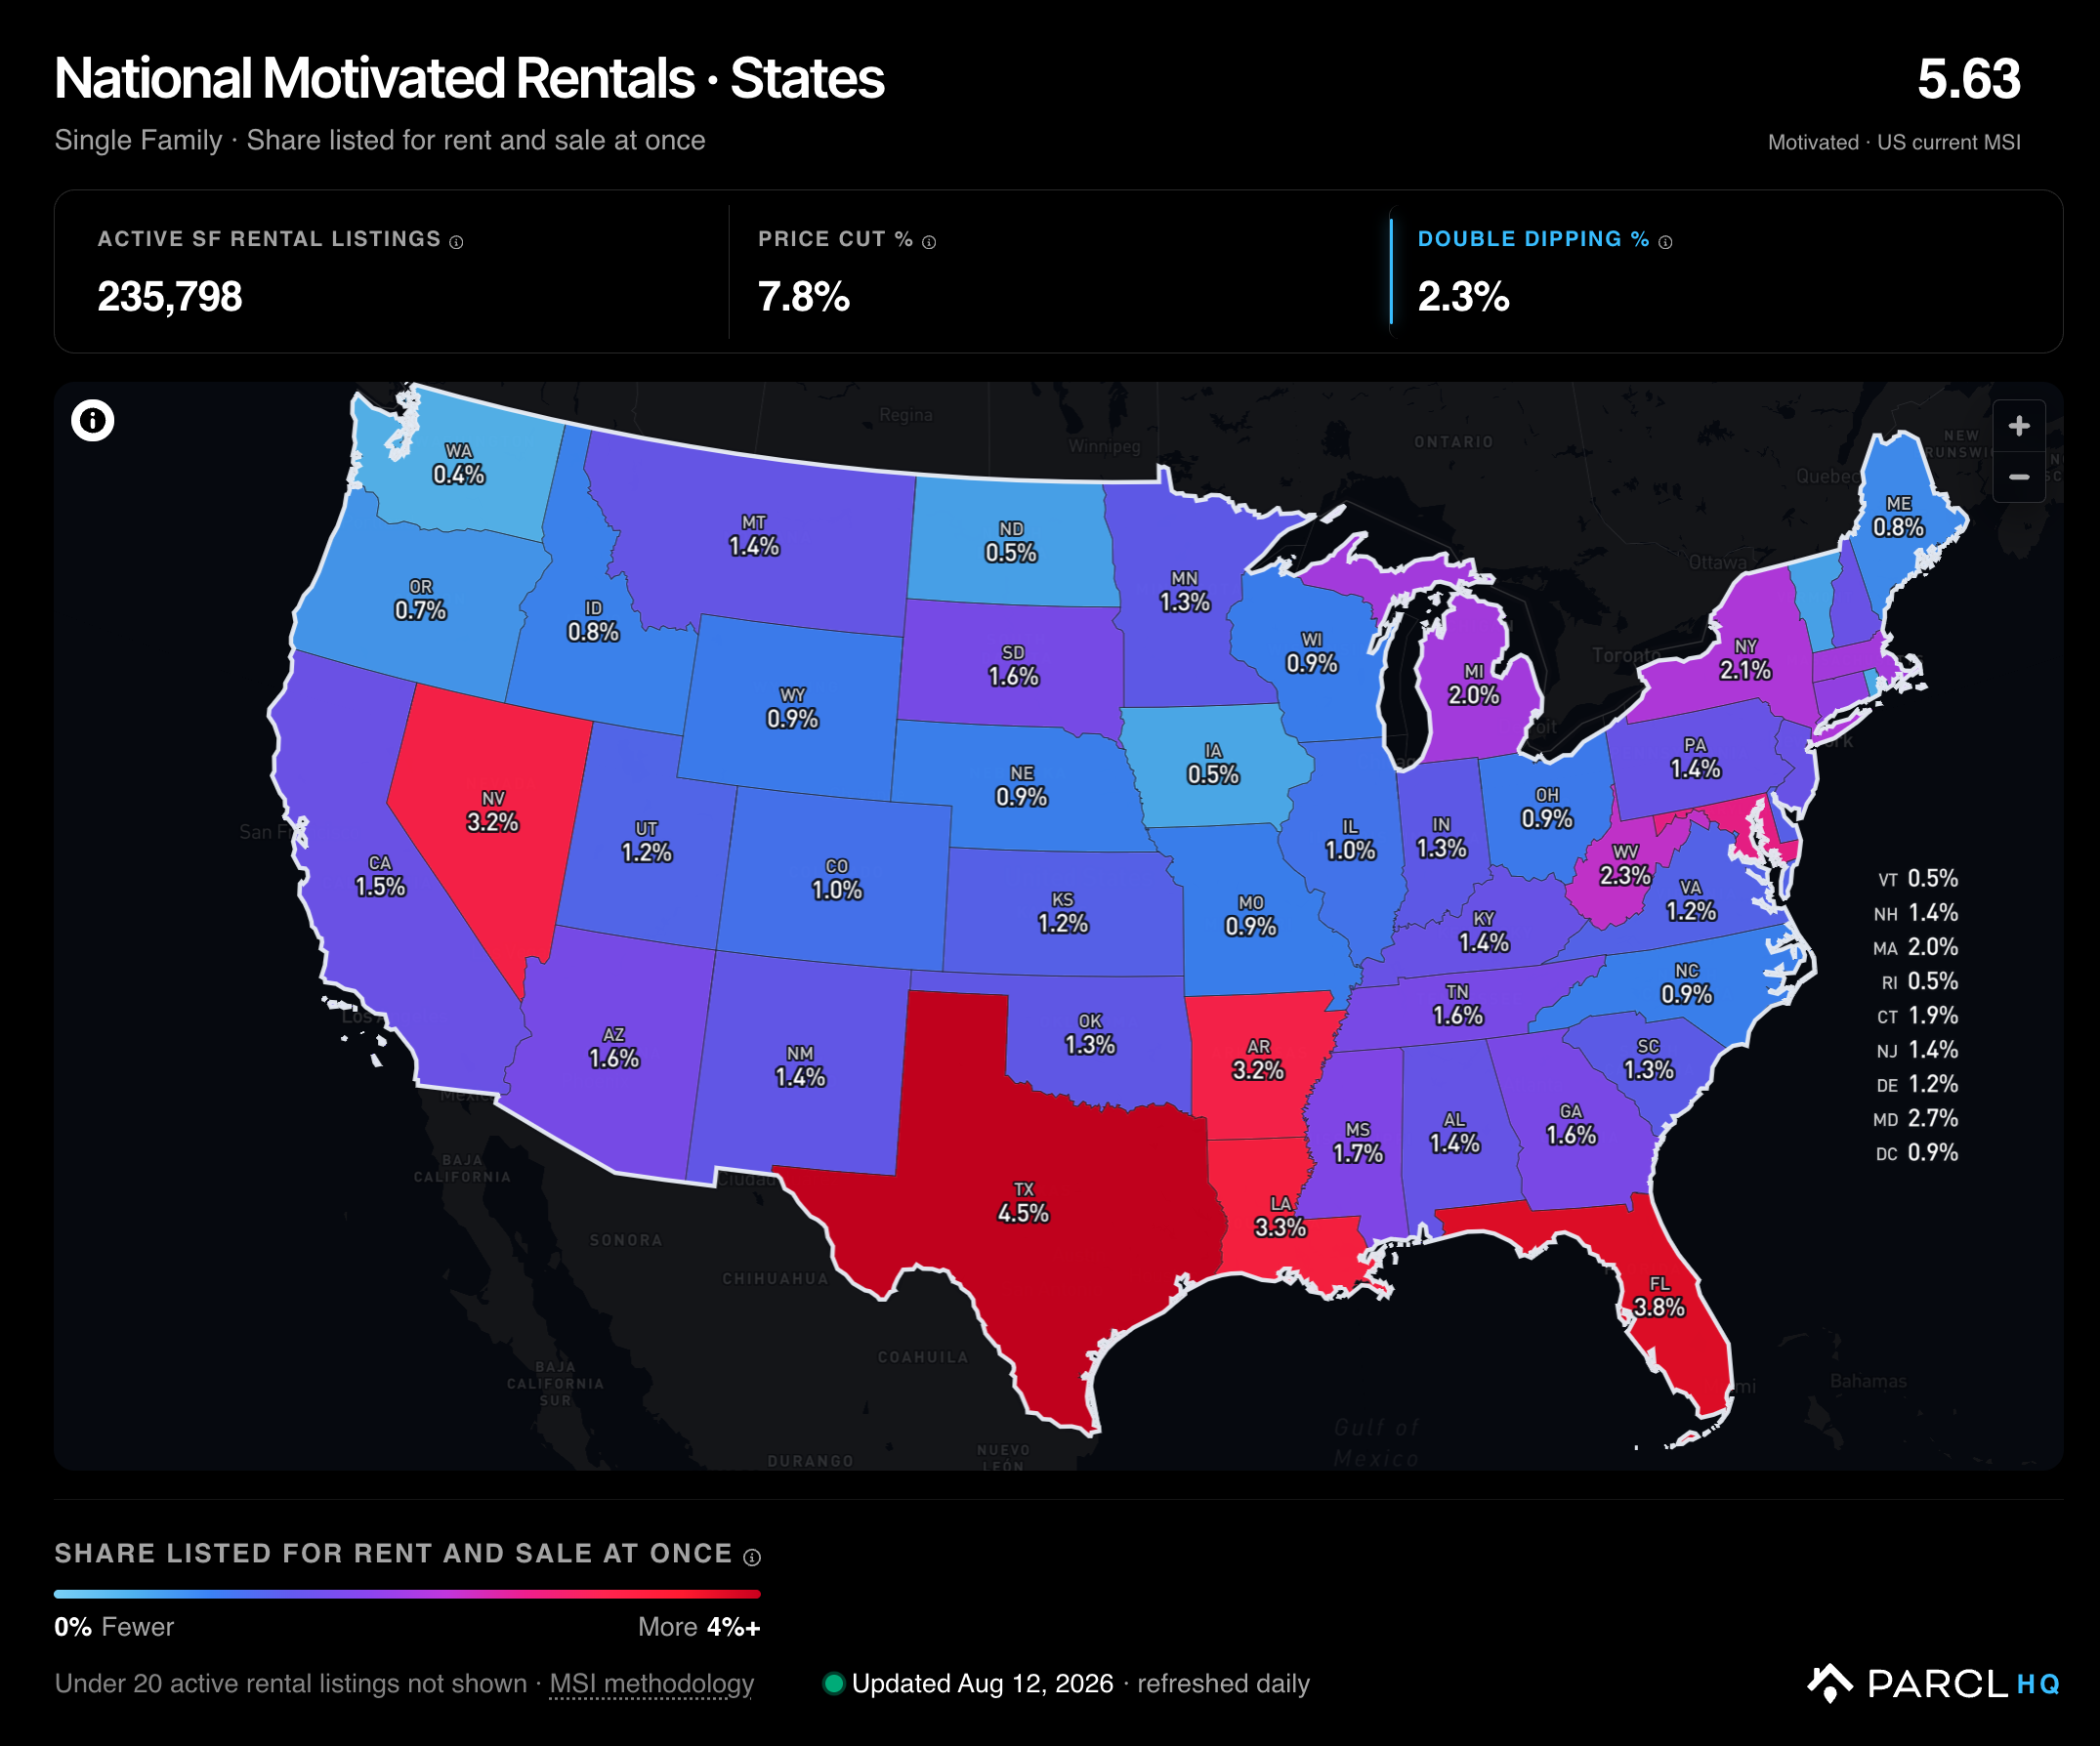
How to use it: Track a distinct source of rental competition: homes that can leave the rental market as soon as they sell. These owners have not committed to the rental market. Double dippers also offer property managers and real estate agents a lead source because they have signaled openness to either outcome.
Algorithmic Pricing Shows Where Machines Set the Rent
Why we built it: Recent legal challenges have brought algorithmic rental pricing into the public eye and greatly expanded awareness of the practice.
In the SFR market, frequent price changes that match algorithmic patterns often signal operator sophistication rather than distress. Institutional SFR operators have higher rates of algorithmic pricing. Markets like Atlanta, where institutional concentration is high, also show elevated rates across their rental inventory.
We built this metric to distinguish algorithmic repricing from rent cuts that signal landlord distress and an urgent need to secure a tenant.
What it measures: The share of a market's active single-family rentals whose repricing behavior matches automated pricing systems. These patterns include price changes in both directions, repeated increases, frequent and rapid revisions, micro-adjustments, and non-round prices such as $2,347. Parcl detects the pattern at the listing level and aggregates the results by market.
Example: Atlanta stands out. Its share of algorithmically priced rentals is well above the national rate, in line with its deep institutional SFR footprint.
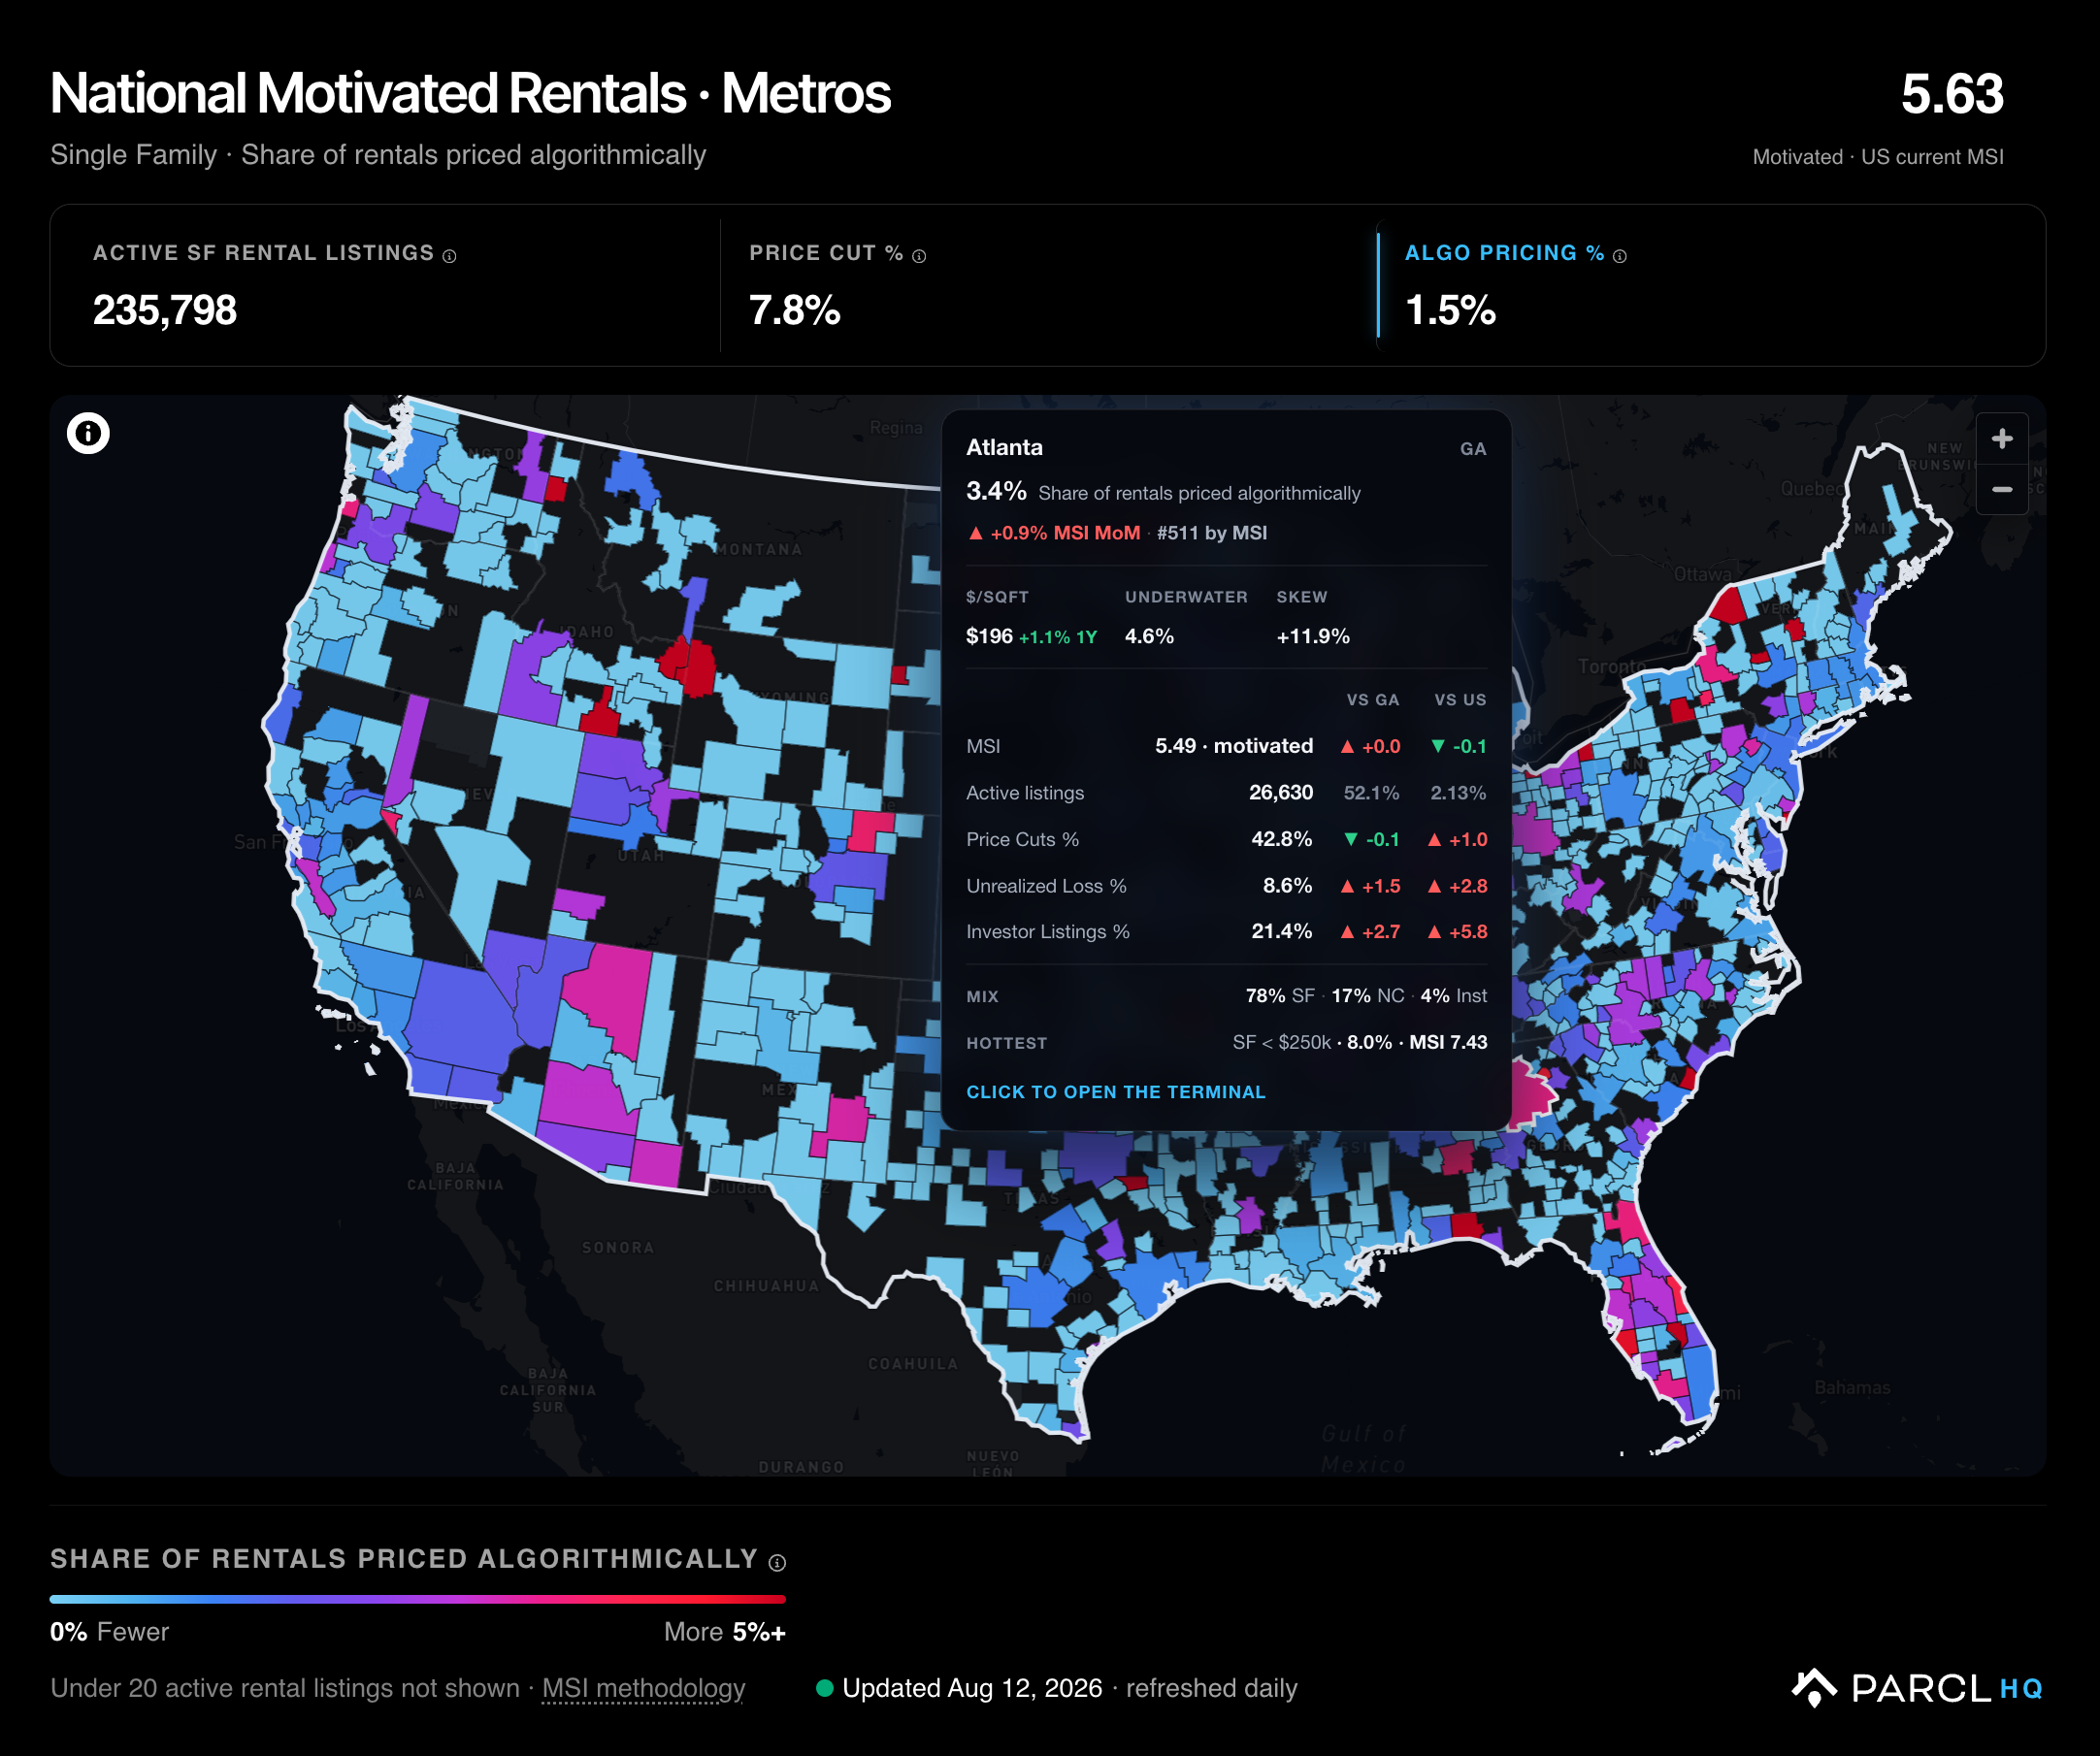
How to use it: Assess the sophistication and competitive intensity of a market's rental operators. If you operate rentals, see which competitors rely on algorithmic pricing and how they are deploying their strategy. If you sell technology to property managers, find operators whose stacks fit your product.
Property Manager Intelligence Maps a Market's Operators
Why we built it: Since launch, Property Manager Intelligence has become one of the platform's most popular datasets (PM data overview). Teams are consistently surprised by the size and fragmentation of the property-management landscape beyond the well-known mega-landlords.
Previously, this intelligence was available only through AI Connect. This release brings two aggregate PM metrics to HQ for every U.S. market, giving you an easy entry point for exploring the data.
What it measures:
PM count: The number of professional property-management companies operating across a market's active single-family rentals.
PM concentration: The share of active single-family rentals managed by the market's ten largest companies. A lower share indicates a more fragmented market.
Example: PM concentration varies widely across markets. Charlotte sits at the concentrated end: a few hundred companies operate there, and the ten largest manage roughly 40% of active single-family rentals.
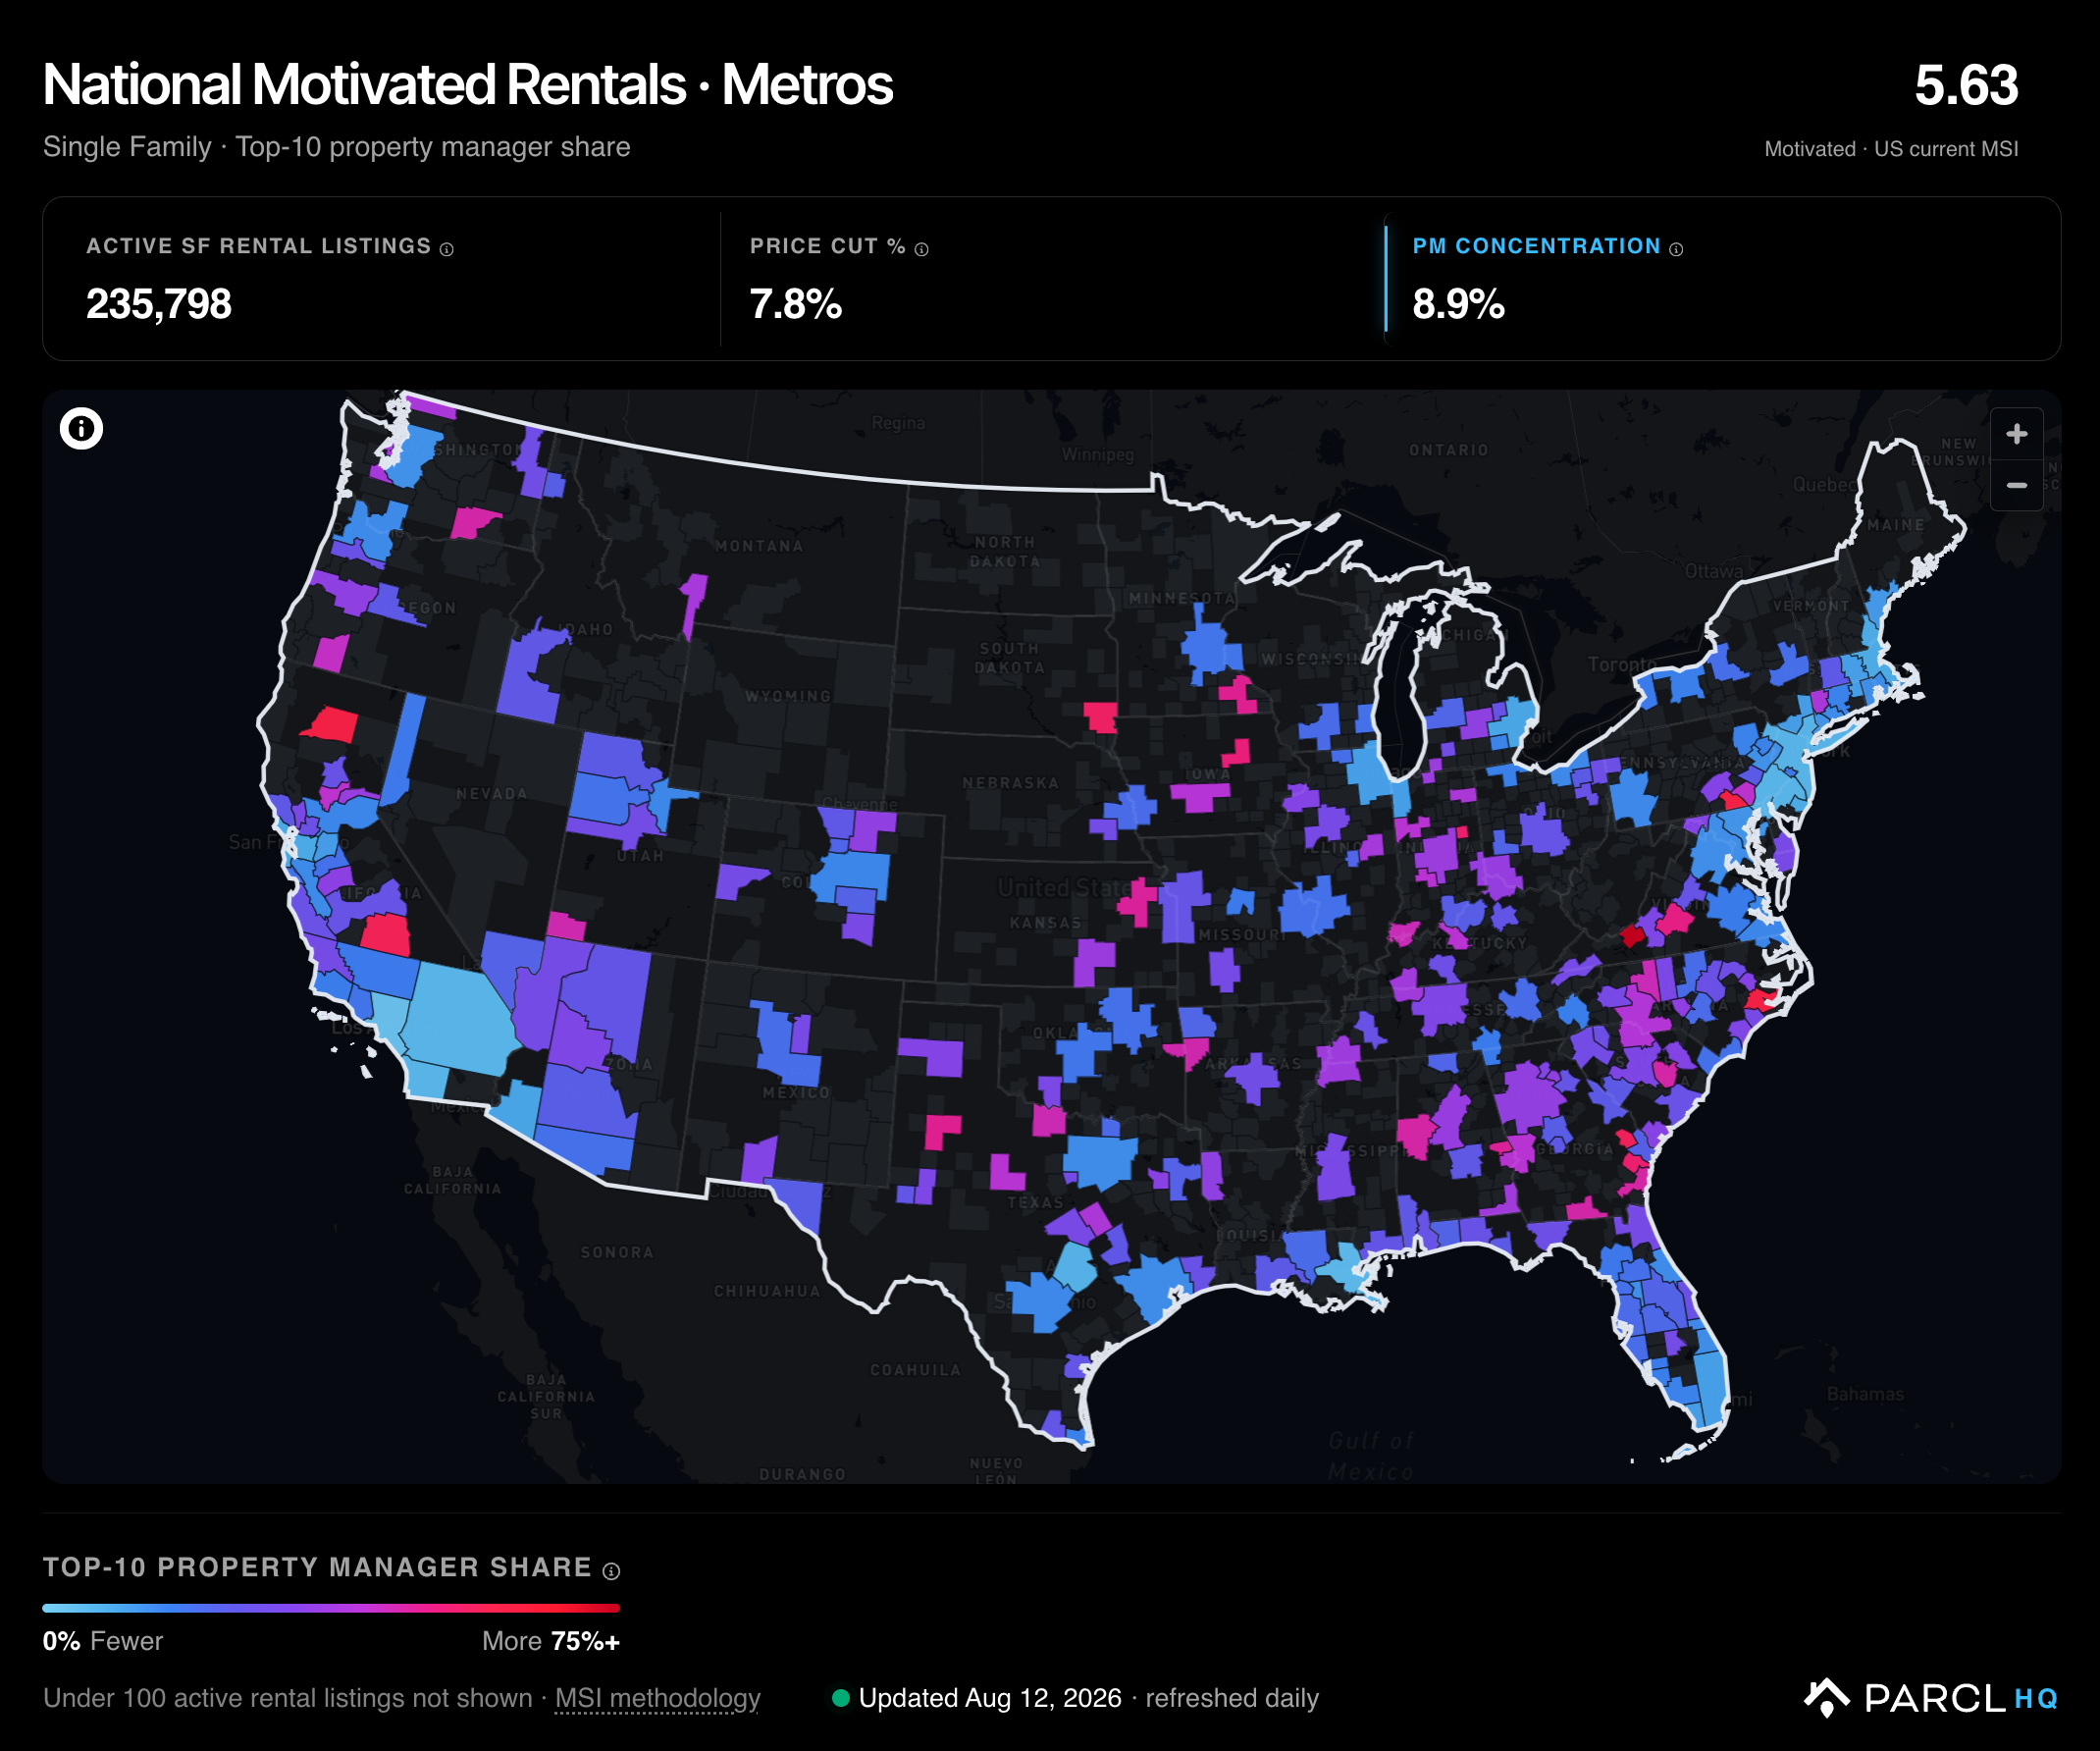
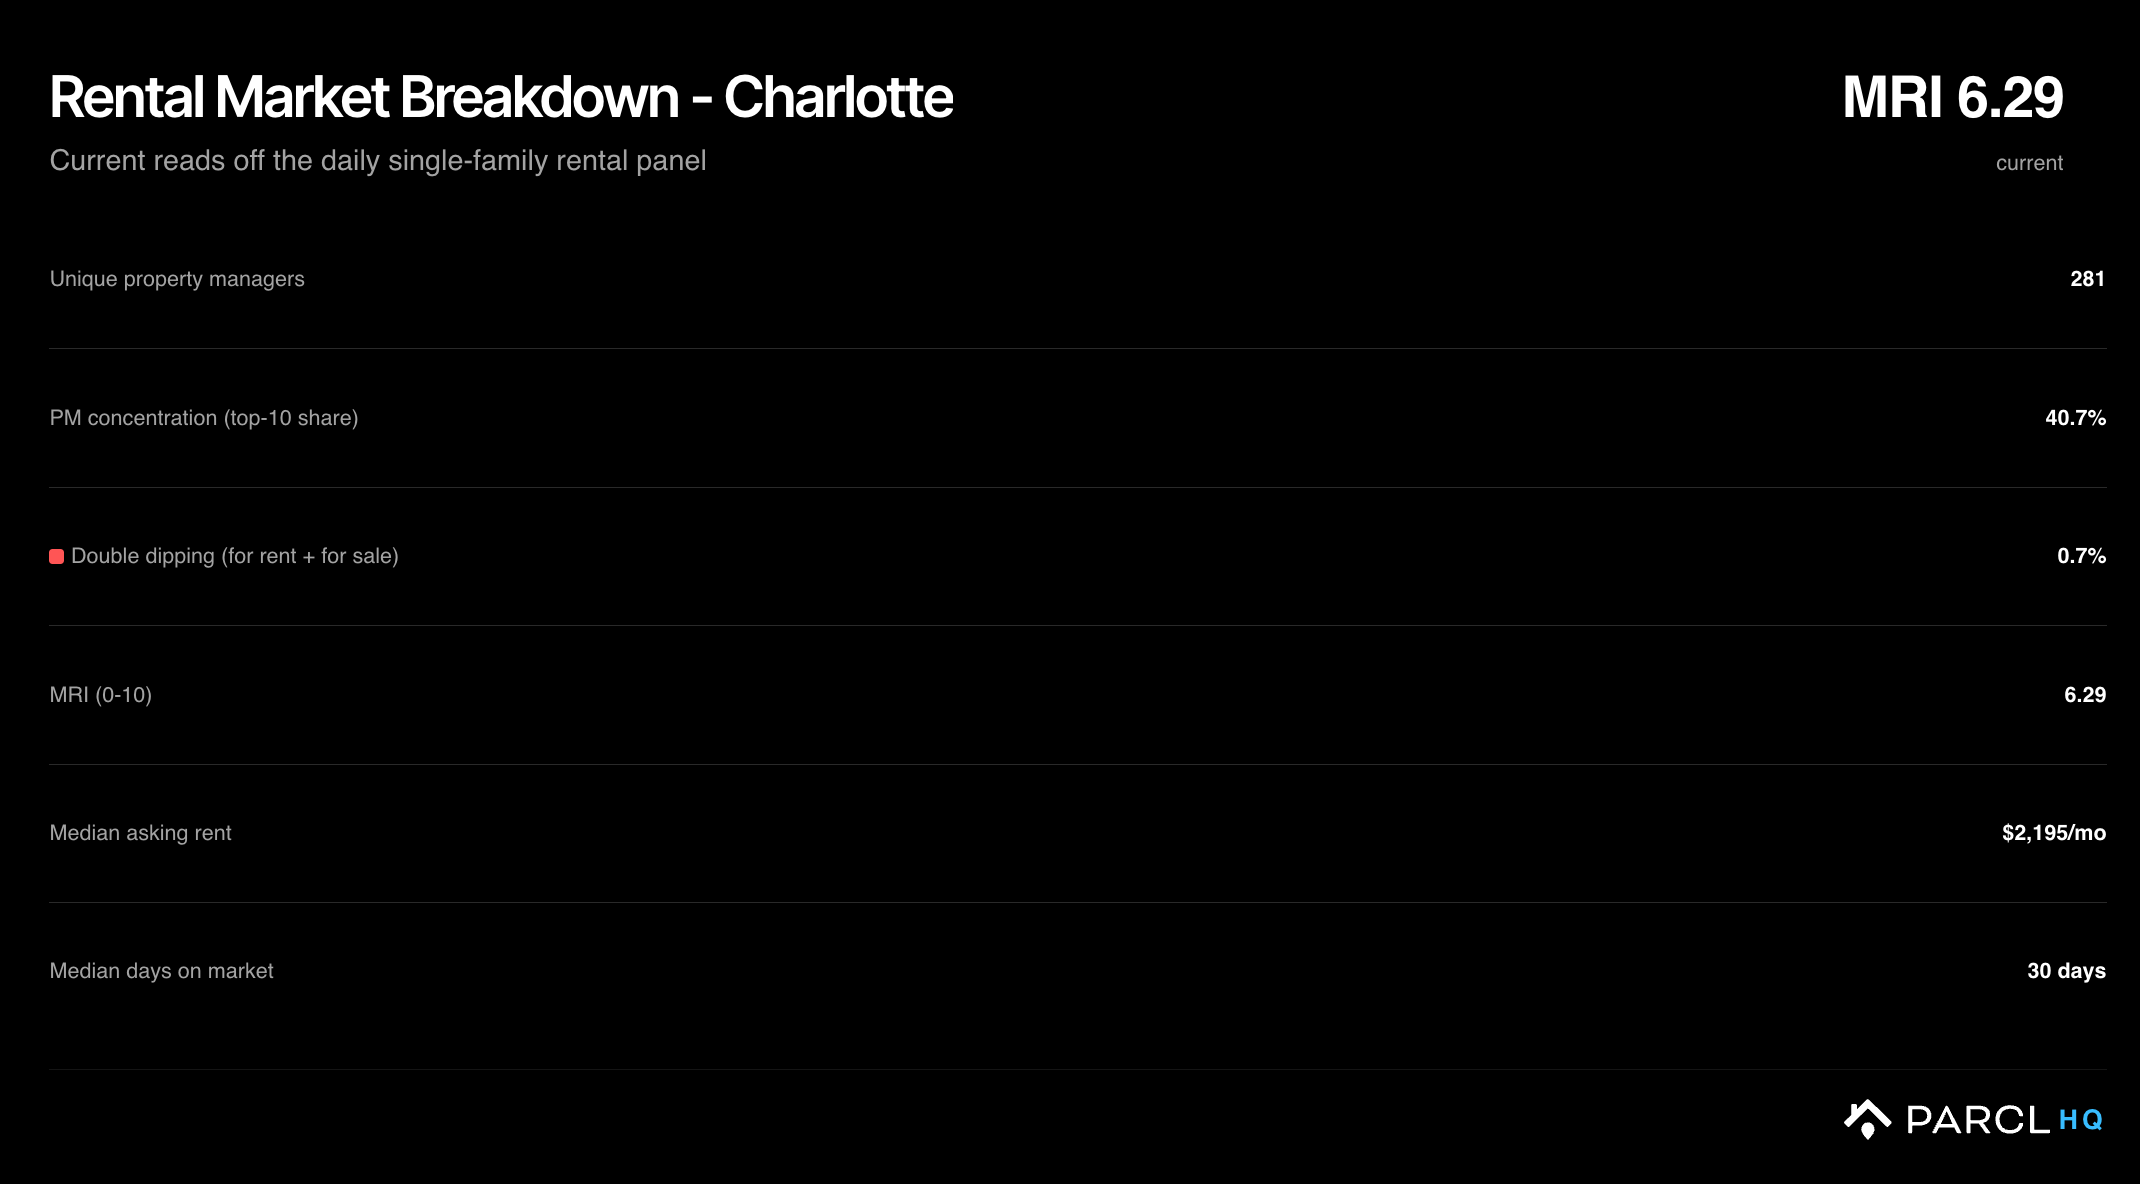
How to use it: Use PM count to size a market's operator universe and PM concentration to understand whether rentals are controlled by a few large players or distributed across many smaller ones. From there, benchmark the competition, identify fragmented markets for acquisition or roll-up strategies, or prioritize where to build lead lists for home services and software. You can then tap into the PM tools in to build CRM-ready lead datasets.
Get Access Today
These new metrics bring a novel, useful way to analyze rental markets to Parcl HQ. They are now available across the HQ interface, free at the state and metro levels and included in the Pro plan at the county and ZIP code levels.
How to get started:
Select "Rental" from the dropdown to calibrate the HQ map to rental insights.
Choose a market, then select "Rental" in the top-right corner to explore its detailed rental insights.
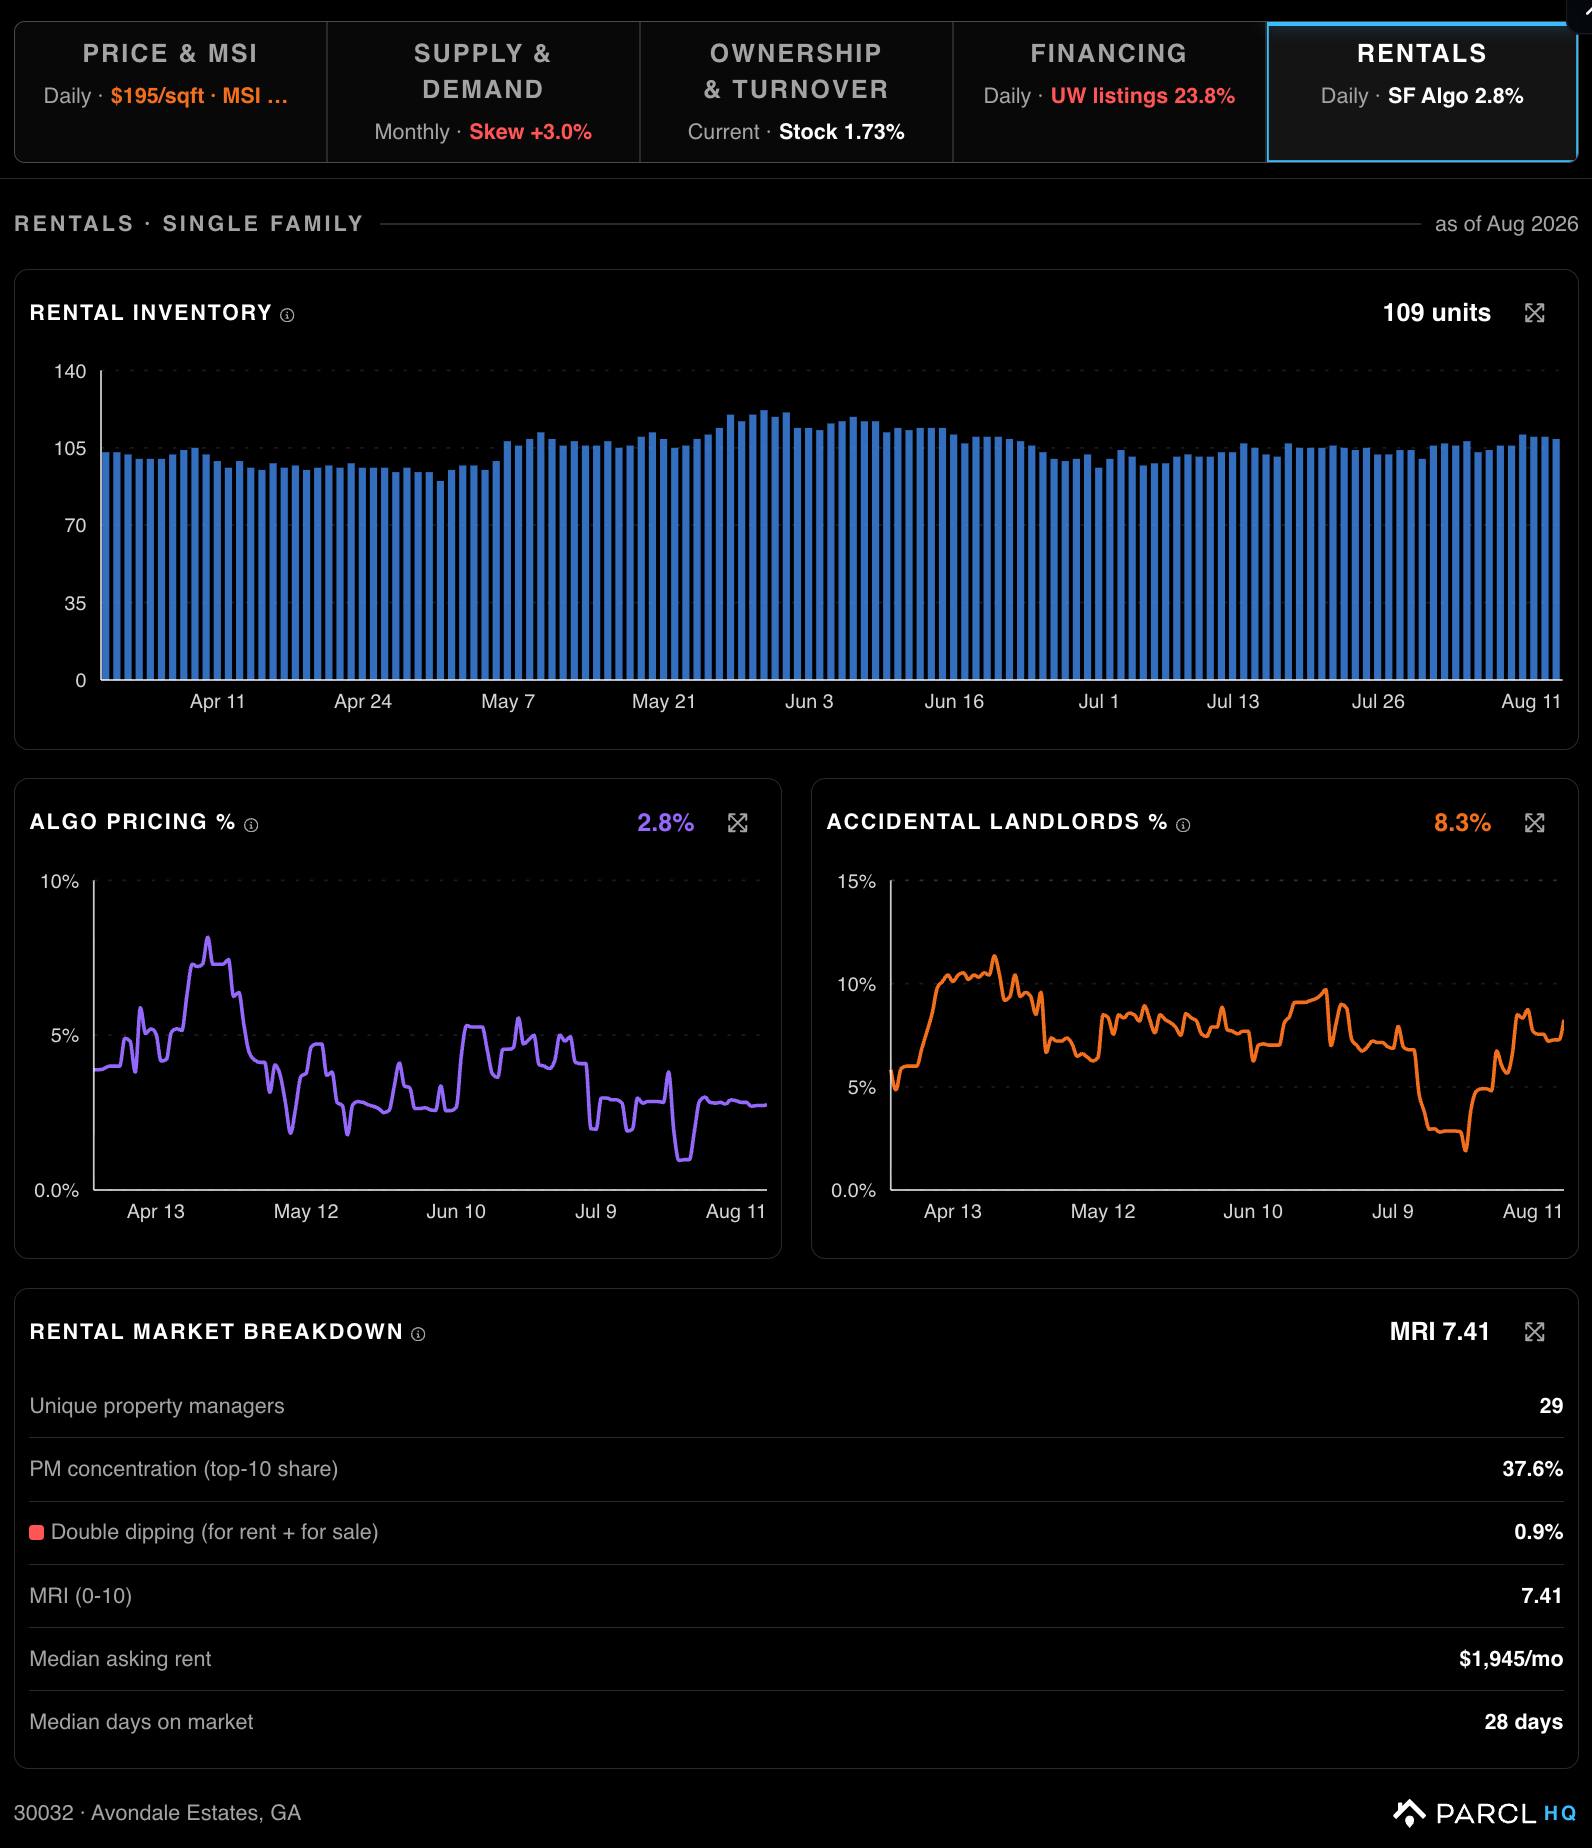
Soon, these data points will also be available programmatically through the Data Vault. We also want your feedback on what to build next, including downloadable lists for rental cohorts such as accidental landlords, similar to our motivated seller lists.
Get in touch with our team with ideas, questions, or feedback: team@parcllabs.com.

Follow Us for More